Impact Factor ISSN: 1449-1907

 Global reach, higher impact
Int J Med Sci 2018; 15(7):696-702. doi:10.7150/ijms.24257 This issue Cite
Research Paper
Low-Dose Evans Blue Dye for Near-Infrared Fluorescence Imaging in Photothrombotic Stroke Model
Hye-Won Ryu1,*, Wonbong Lim4,*, Danbi Jo2, Subin Kim2, Jong Tae Park1, Jung-Joon Min3, Hoon Hyun2,5, ![]() , Hyung-Seok Kim1,5,
, Hyung-Seok Kim1,5, ![]()
1. Department of Forensic Medicine,
2. Department of Biomedical Sciences and
3. Department of Nuclear Medicine, Chonnam National University Medical School, Gwangju 61469, South Korea
4. Department of Premedical Program, School of Medicine, Chosun University, Gwangju 61452, South Korea
5. Center for Creative Biomedical Scientists, Chonnam National University Medical School, Gwangju 61469, South Korea
*These authors contributed equally to this work.
Received 2017-12-8; Accepted 2018-4-9; Published 2018-4-27
Abstract
Background: Evans blue dye (EBD) is the most common indicator to analyze the extent of blood-brain barrier (BBB) breakdown in several neurological disease models. However, the high-dose of EBD (51.9 mg/kg) is usually required for visualization of blue color by the human eye that brings potential safety issues.
Methods: To solve this problem, low-dose of EBD was applied for the near-infrared (NIR) fluorescence-assisted quantitation of BBB breakdown in photothrombotic stoke model. Animals were allocated to seven dose groups ranging from 1.35 nmol (5.19 μg/kg) to 13.5 μmol (51.9 mg/kg) EBD.
Results: EBD was undetectable in the non-ischemic brain tissue, and the fluorescence signals in the infarcted hemisphere seemed proportional to the injected dose in the dose range. Although the maximum fluorescence signals in brain tissue were obtained with the injections of 1.35 nmol ~ 13.5 μmol EBD, the background signals in the neighboring brain tissues were significantly increased as well. Since the high concentration of EBD is necessary for color-based identification of the infarcted lesion in brain tissues, even 10-fold diluted could not be distinguished visually by naked eye.
Conclusions: NIR fluorescence-assisted method could potentially provide new opportunities to study BBB leakage just using small amount of EBD in different pathological conditions and to test the efficacy of various therapeutic strategies to protect the BBB.
Keywords: Evans blue dye, photothrombotic stroke model, blood-brain barrier, near-infrared fluorescence, signal-to-background ratio
Introduction
Impairment of the blood-brain barrier (BBB) after cerebral ischemia leads to extravasation of plasma constituents into the brain parenchyma and is associated with a larger final lesion volume and more negative outcome [1]. Therefore, reliable assessment of the BBB impairment is of major importance in experimental research [2].
Evans blue dye (EBD) is commonly used to assess the changes of BBB permeability induced by various BBB breakdown including stroke, tumors, and several neurological disorders, because of its rapid binding to serum albumin [3-6]. Since the serum albumin cannot cross the BBB under normal physiologic conditions, the accumulation of EBD-bound albumin in brain tissue could be quantified by using spectrophotometry to analyze the extent of vascular leakage [7,8]. However, this method requires extensive tissue processing and could not assess the spatial extravasation pattern of BBB permeability changes within the brain. Moreover, it is not sensitive enough to detect evidence of minor leaks after EBD extraction from the brain tissue [9].
Although color-guided detection of infarcted brain tissue using EBD for intraoperative localization has been widely reported, this method highly depends on a certain dose of EBD. Consequently, a major disadvantage of using EBD is that the high-dose (51.9 mg/kg) required for visualization of blue color by the human eye brings a substantial risk of serious adverse events, such as toxic metabolic encephalopathy [8,10]. By using low-dose EBD, thereby, safe and improved intraoperative imaging technique to localize the infarcted lesion of brain tissue in real-time is needed.
To overcome the EBD limitation, near-infrared (NIR) fluorescence imaging is a promising technique that also facilitates intraoperative, real-time, visual information. This technique is based on the use of NIR fluorophores that can be detected by intraoperative imaging system to visualize specific tissues. NIR fluorophores, with wavelengths ranging from 650-900 nm, have excellent optical properties and high physicochemical stability in the body, which would be beneficial to track the abnormal tissues in vivo. Moreover, the NIR fluorescence imaging eliminates autofluorescence from the body, which can increase accuracy of imaging data from animals [11-17]. However, the number of approaches demonstrating the feasibility of assessment BBB impairment with NIR fluorescence techniques is limited [1,18,19]. EBD has the optical property that it becomes a moderate-strength fluorophore emitting at 680 nm when diluted to levels that are almost undetectable to the human eye. When lower doses of EBD can still provide clear identification of BBB breakage using NIR fluorescence imaging, this could significantly reduce the risk for adverse events. The aim of this study was to assess the feasibility of BBB breakdown using low-dose EBD for intraoperative fluorescence-guided detection of the BBB in animal stroke models.
Materials and Methods
Animals
All animal protocols were carried out in accordance with the Chonnam National University guidelines for the care and use of laboratory animals and were approved by the the Chonnam National University Animal Research Committee. All experiments were carried out in accordance with the guidelines laid down by the National Institutes of Health (Bethesda, MD, USA) about the care and use of animals for experimental procedures. Adult (8-week-old) male Sprague-Dawley (SD) rats weighing ≈ 250 g (N = 6, independent experiments) were purchased from Samtako (Seoul, South Korea).
Photothrombotic Stroke Model Induction and EBD Administration
Focal cortical ischemia was induced by photothrombosis of the cortical microvessels using Rose Bengal (Sigma, St. Louis, MO, USA) with cold light (Zeiss KL1500 LCD, Germany) [5,20]. Each animal was anesthetized with 5% isoflurane and maintained with 3% isoflurane in an oxygen/air mixture using a gas anesthesia mask in a stereotaxic frame (Stoelting, Wood Dale, IL, USA). Body temperature was maintained during surgery at 37 ± 0.5°C using a heating pad controlled by a rectal probe. For illumination, a 4.5 mm fiber-optic bundle from a cold light source was positioned onto the exposed skull 0.5 mm anterior to bregma and 3.7 mm lateral to the midline over the left sensorimotor cortex, as previously described [21]. The brain was illuminated for 10 minutes after infusion of 50 mg/kg Rose Bengal in normal saline into the right femoral vein via a microinjection pump within 1 minute. The scalp was sutured, and the mice were allowed to wake before being returned to their home cages. For the sham surgery, 6 animals received illumination after infusion of normal saline instead of Rose Bengal. Focal cerebral ischemia confirmation was also evaluated by using Evans blue (Sigma, St. Louis, MO, USA) dye extravasations via unaided examination or NIR fluorescence-based ring-enhancement.
Assessment of BBB Integrity
BBB integrity disruption using EBD was evaluated by two methods. One is conventional absorbance methods as described previously [22], and the other is NIR-fluorescnece method. Briefly, the rats received 1.2 mL/kg of 4, 0.4, 0.04, 0.008, and 0.004% Evans blue solution in saline by intraperitoneal (IP) injection 30 min after focal cerebral ischemia induction. Six hours after EBD administration for circulation, the thoracic cavity was opened under anesthesia. The rats were perfused with 50 mL saline transcardially to wash out intravascular EBD until colorless perfusion fluid was obtained from the atrium. After decapitation, the brain was removed and the hemispheres separated and weighed. The right and left hemispheres were to extract the Evans blue and to precipitate protein, 1 mL of 70% trichloroacetic acid was added and mixed by vortex for 1 min. The samples were then placed at 4 °C for overnight and centrifuged for 30 min at 1,000 x g at 4 °C. The 100 µL amount of total supernatants was measured at 620 nm using a spectrophotometer (BIO-RAD, Hercules, CA, USA). The dye concentration was calculated as the ratio of absorbance relative to the amount of tissue.
NIR Fluorescence Imaging System
In vivo NIR fluorescence imaging was performed using the Mini-FLARE® imaging system as described previously [23]. Briefly, the system consists of 2 wavelength separated light sources: a “white” LED light source, generating 26,600 lux of 400 to 650 nm light to illuminate the surgical field and an NIR LED light source, generating 1.08 mW / cm2 of 656-678 nm fluorescence excitation light. White light and NIR fluorescence images are acquired simultaneously and displayed in real time, using custom designed optics and software. Fluorescence intensity was calculated using the Mini-FLARE® software, which allows quantitative measurements.
Intraoperative BBB Integrity Imaging in Stroke Animal Models
For intraperitoneal (IP) injection, EBD stock solution was dissolved in PBS from 45 mM to 4.5 μM concentrations. Initial in vivo screening occurred in Sprague Dawley rats by injecting 13.5 µmol of EBD based on the 4 % concentration of EBD. For kinetic and dose-response studies, 1.35 nmol ~ 13.5 μmol of EBD was injected intraperitoneally into rats and measurements taken over 6 h (N = 6 per dose and time point). The fluorescence signal in the infarcted brain tissue was observed in real-time using the Mini-FLARE® imaging system up to 6 h post-injection.
Quantitation and Statistical Analysis
The fluorescence intensity and background intensity of a region of interest (ROI) over each infarcted brain tissue/neighboring brain tissue were quantified using custom FLARE® software to calculate the signal-to-background ratio (SBR) of targeted brain tissue. Statistical analysis was carried out using a one-way ANOVA followed by Tukey's multiple comparisons test. Results were presented as mean ± S.D. and curve fitting was performed using Prism version 4.0a software (GraphPad, San Diego, CA, USA).
Results
In Vivo NIR Fluorescence Imaging of Conventional EBD Concentration
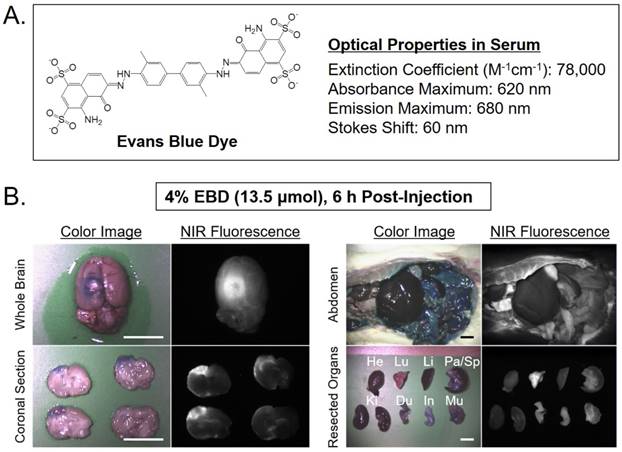
Intraoperative NIR fluorescence guidance was provided by the Mini-FLARE® imaging system and EBD, which clearly identified an infarcted lesion in photothrombotic stroke model. Initial fluorescence monitoring of EBD performance in vivo utilized a single intraperitoneal injection of EBD at a dose of 13.5 µmol in 250 g SD rats 6 h prior to imaging (Figure 1). The optimal time for imaging was selected from our previous report based on the increasing time of EBD extravasation after ischemic injury [5]. As expected, high dose of EBD was well stained the infarcted lesion blue color and showed high nonspecific uptake in most tissues and organs. The dose of 13.5 µmol (51.9 mg/kg) for color-guided detection is equivalent to 10 ~ 20 nmol doses for the fluorescence-guided imaging.
(A) Chemical structure and optical properties of EBD [10]. (B) In vivo NIR imaging of brain tissue (left) and biodistribution (right) using the conventional concentration of 4% EBD in rats. 13.5 μmol of EBD was injected intraperitoneally into 250 g SD-rats 6 h prior to imaging and resection. Abbreviations used are: Du, duodenum; He, heart; In, intestine; Ki, kidneys; Li, liver; Lu, lungs; Mu, muscle; Pa, pancreas; Sp, spleen. Scale bars = 1 cm. Images are representative of N = 6 independent experiments. All NIR fluorescence images have identical exposure and normalizations.
Dose-Dependence of EBD Brain Imaging in Stroke Animal Models
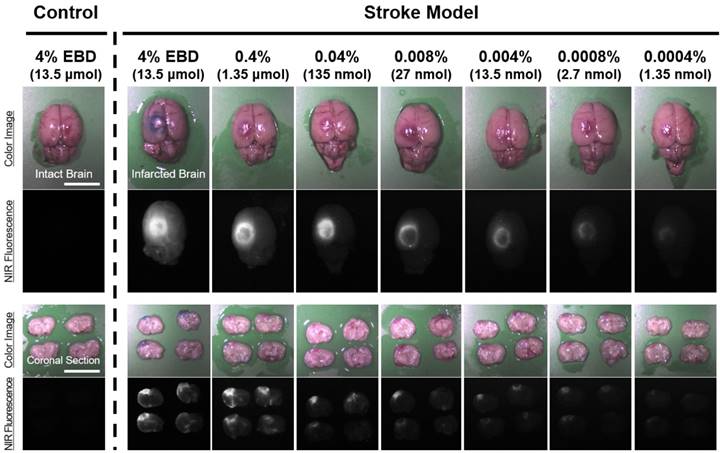
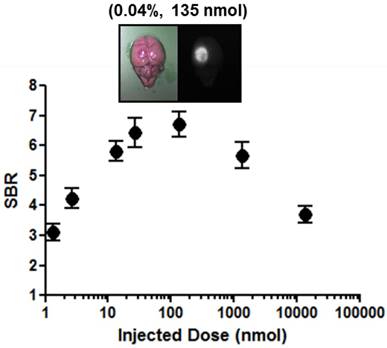
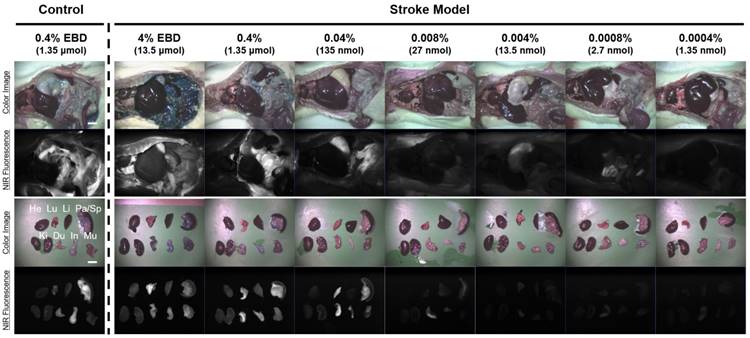
Dose-dependent optimization of EBD for NIR fluorescence imaging was investigated at 6 h post-injection and expressed as SBR. To assess the effect of the dose of injected EBD on the SBR, animals were allocated to seven dose groups ranging from 1.35 nmol (5.19 μg/kg) to 13.5 μmol (51.9 mg/kg) EBD. SBR ratios were calculated by dividing the fluorescence intensity of a large region of interest of the infarcted brain by the tissue directly neighboring region and SBRs were taken from the same brain tissue at 6 h post-injection. As shown in Figure 2, EBD was undetectable in the non-ischemic brain tissue, and the fluorescence signals in the infarcted lesion of each brain tissue seemed proportional to the injected dose in the dose range. In terms of SBR, however, the highest SBRs were observed in the 100 ~ 500-fold diluted doses from 4% EBD stock solution (Figure 3). Although the maximum fluorescence signals in brain tissue were obtained with the injections of 1.35 ~ 13.5 μmol EBD, the background signals in the neighboring brain tissues were significantly increased as well. Since the high concentration of EBD is necessary for color-based identification of the infarcted lesion in brain tissues, even 10-fold diluted dose could not be distinguished visually by naked eye. Therefore, no significant differences were observed in the SBR values between the dose of 13.5 nmol and 1.35 μmol. Moreover, the lower doses of EBD exhibit significantly decreased nonspecific uptake in normal tissues and organs, thereby reducing the risk for toxicity effects (Figure 4).
In vivo dose-dependent imaging of infarcted brain tissue using by diluted EBD in rats. Each concentration of EBD was injected intraperitoneally into 250 g SD-rats in the range of 1.35 nmol to 1.35 μmol 6 h prior to imaging. Scale bars = 1 cm. Images are representative of N = 6 independent experiments. NIR fluorescence images for each condition have identical exposure times and normalizations.
Dose-response plotting of SBR (mean ± S.D.) for infarcted brain tissue. SBR was calculated by the fluorescence intensity of infarcted brain tissue versus the signal intensity of neighboring brain tissue obtained at 6 h post-injection.
In vivo dose-dependent biodistribution of the EBD in rats. Each concentration of EBD was injected intraperitoneally into 250 g SD-rats in the range of 1.35 nmol to 1.35 μmol 6 h prior to imaging and resection. Abbreviations used are: Du, duodenum; He, heart; In, intestine; Ki, kidneys; Li, liver; Lu, lungs; Mu, muscle; Pa, pancreas; Sp, spleen. Scale bars = 1 cm. Images are representative of N = 6 independent experiments. All NIR fluorescence images have identical exposure and normalizations.
Discussion
The role of the BBB in the pathogenesis of acute ischemic stroke, and various neurodegenerative disorders including Alzheimer's disease has emerged as a focus for new therapeutic strategies [24,25]. The disruption of the BBB could be quantified as an increase in the permeability of the BBB. Typically, straightforward method of assessing BBB disruption is the measurement of extravasated blood proteins such as endogenous tracers or exogenous tracers which is bound into endogenous tracers in the brain parenchyma [24].
Basically, EBD has been used to measure the extravasation of albumin following increased BBB permeability. This dye can be extracted from brain tissue by incubating in tricholoroacetic acid (TCA), which can compete with EBD for binding to plasma proteins [26], and quantifying dye concentration with ultraviolet spectrophotometry [27]. Although EBD assay is widely used in numerous BBB integrity studies, EBD has several limitations as 1) its lethal toxicity, and usually high dose of EBD need to visualize the lesion distribution, 2) large amounts of extravasated EBD is still remain in brain parenchyma after TCA incubation, 3) there is evidence that EBD binds to tissues, and 4) there was no standard spectroscopic methods that have been used to estimate the amount dye in brain tissue [28]. However, EBD is the most commonly used marker of BBB integrity and its use has increased substantially in recent years [8].
This study describes a novel application of optical imaging technique for BBB disruption identification after infusing of low dose EBD to overcome the generally cited EBD limitation. In this study, EBD was just identified in the lesion side hemisphere using NIR fluorescence imaging system, and was undetectable in the non-ischemic brain tissue. The fluorescence signals in the lesion of each brain tissue seemed proportional to the injected dose in the dose range.
Previously, EBD has been used extensively in high dosages to macroscopically identify brain injury by blue color. The primary objective of the current study was to test the feasibility to identify the BBB disruption using dilute EBD and NIR fluorescence. In this study, the author adopted well-established TCA extraction method after EBD injection via intraperitoneal injection [5,6,20], and separated the brain sample as supernatant and remaining brain tissue for spectrophotometer assessment. Interestingly, the blue colorization in the brain was gone into the supernatant with overnight TCA incubation and the blue color is just visible to the unaided eye in the supernatant, but there was strong remaining EBD fluorescence was visible under NIR fluorescence imaging in the brain. EBD fluorescence in the remaining brain was persisted even in the low dose of EBD administration (data not shown).
The potential advantages of using NIR fluorescence imaging are the increased tissue penetration of light at 700 nm and the fact that EBD can be administered via a simple peritoneal cavity using significantly lower doses, thereby reducing the risk for toxicity effects. A clear identification of the BBB disruption using NIR fluorescence was found in all animal stroke models within a certain period of time after injection, and as shown in Figure 2, the infarcted area of brain tissue could be detected even if a 10,000-fold serial dilution of conventional EBD concentration. Animals were allocated to six different dose groups to reduce the dosage of EBD, however no significant differences in SBR between 10-fold dilution and 1,000-fold dilution groups were found. Therefore, based on this study, the 500 ~ 1,000-fold diluted doses from 4% EBD stock solution seem optimal based on logistical and safety preferences.
The conventional spectroscope method to evaluate the BBB integrity was spent more 24 h intravenous EBD injection after animal modeling such as focal cerebral ischemia. To compare with conventional spectroscope method, the working time to archive the optimal image under NIR fluorescence imaging system is 'real-time' after brain removal. In this study, each different EBD dye was injected 6 h prior to capture the image, and NIR-based fluorescence images for EBD leakage around lesion were archived immediately after brain removal. This method gives a chance to reduce the turnaround time and is a great advantage to researcher to get appropriate results.
Since the penetration depth of NIR fluorescence imaging using 700 nm light and EBD has a maximum of approximately 3-5 mm, identification of the stroke may still be challenging under some circumstances. Improved contrast agents with 800 nm fluorescence, a higher extinction coefficient, and a higher quantum yield would help in this regard. It is expected that these contrast agents will be reported in our forthcoming study.
In conclusion, NIR fluorescence-assisted method is sensitive, simple, and could potentially provide new opportunities to study BBB leakage just using small amount of EBD in different pathological conditions and to test the efficacy of various therapeutic strategies to protect the BBB.
Acknowledgements
This study was supported by the National Research Foundation of Korea (NRF) grant funded by the Korea government (MSIP) (No. NRF-2015R1C1A1A01053168; H.H.; No. NRF-2016R1A2B4008316; K.H.S.) and the Pioneer Research Center Program (2015M3C1A3056410; H.H.).
Competing Interests
The authors have declared that no competing interest exists.
References
1. Klohs J, Steinbrink J, Bourayou R, Mueller S, Cordell R, Licha K. et al. Near-infrared fluorescence imaging with fluorescently labeled albumin: a novel method for non-invasive optical imaging of blood-brain barrier impairment after focal cerebral ischemia in mice. J Neurosci Methods. 2009;180(1):126-32
2. Wunder A, Schoknecht K, Stanimirovic DB, Prager O, Chassidim Y. Imaging blood-brain barrier dysfunction in animal disease models. Epilepsia. 2012;53(Suppl. 6):14-21
3. Ujiie M, Dickstein DL, Carlow DA, Jefferies WA. Blood-brain barrier permeability precedes senile plaque formation in an Alzheimer disease model. Microcirculation. 2003;10(6):463-70
4. Piao MS, Lee JK, Jang JW, Hur H, Lee SS, Xiao L. et al. Melatonin improves functional outcome via inhibition of matrix metalloproteinases-9 after photothrombotic spinal cord injury in rats. Acta Neurochir. 2014;156(11):2173-82
5. Choi KH, Kim HS, Park MS, Kim JT, Kim JH, Cho KA. et al. Regulation of caveolin-1 expression determines early brain edema after experimental focal cerebral ischemia. Stroke. 2016;47(5):1336-43
6. Moon JH, Na JY, Lee MC, Choi KH, Lee JK, Min JJ. et al. Neuroprotective effects of systemic cerebral endothelial cell transplantation in a rat model of cerebral ischemia. Am J Transl Res. 2016;8(5):2343-53
7. Wang H, Lai TW. Optimization of Evans blue quantitation in limited rat tissue samples. Sci Rep. 2014;4:6588
8. Saunders NR, Dziegielewska KM, Møllgård K, Habgood M.D. Markers for blood-brain barrier integrity: how appropriate is Evans blue in the twenty-first century and what are the alternatives? Front Neurosci. 2015;9:385
9. Jaffer H, Adjei IM, Labhasetwar V. Optical imaging to map blood-brain barrier leakage. Sci Rep. 2013;3:3117
10. Lee S, Lim W, Ryu HW, Jo D, Min JJ, Kim HS, Hyun H. ZW800-1 for assessment of blood-brain barrier disruption in a photothrombotic stoke model. Int J Med Sci. 2017;14(13):1430-35
11. Jo D, Hyun H. Structure-inherent targeting of near-infrared fluorophores for image-guided surgery. Chonnam Med J. 2017;53(2):95-102
12. Park MH, Hyun H, Ashitate Y, Wada H, Park G, Lee JH. et al. Prototype nerve-specific near-infrared fluorophores. Theranostics. 2014;4(8):823-33
13. Hyun H, Wada H, Bao K, Gravier J, Yadav Y, Laramie M. et al. Phosphonated near-infrared fluorophores for biomedical imaging of bone. Angew Chem Int Ed. 2014;53(40):10668-72
14. Hyun H, Park MH, Owens EA, Wada H, Henary M, Handgraaf HJ. et al. Structure-inherent targeting of near-infrared fluorophores for parathyroid and thyroid gland imaging. Nat Med. 2015;21(2):192-7
15. Hyun H, Owens EA, Wada H, Levitz A, Park G, Park MH. et al. Cartilage-specific near-infrared fluorophores for biomedical imaging. Angew Chem Int Ed. 2015;54(30):8648-52
16. Owens EA, Hyun H, Tawney JG, Choi HS, Henary M. Correlating molecular character of NIR imaging agents with tissue-specific uptake. J Med Chem. 2015;58(10):4348-56
17. Owens EA, Hyun H, Dost TL, Lee JH, Park G, Pham DH. et al. Near-infrared illumination of native tissue for image-guided surgery. J Med Chem. 2016;59(11):5311-23
18. Piper S, Bahmani P, Klohs J, Bourayou R, Brunecker P, Müller J. et al. Non-invasive surface-stripping for epifluorescence small animal imaging. Biomed Opt Express. 2010;1(1):97-105
19. Ergin A, Wang M, Zhang JY, Bruce JN, Fine RL, Bigio IJ. et al. The feasibility of real-time in vivo optical detection of blood-brain barrier disruption with indocyanine green. J Neurooncol. 2012;106(3):551-60
20. Choi KH, Kim HS, Park MS, Lee EB, Lee JK, Kim JT. et al. Overexpression of caveolin-1 attenuates brain edema by inhibiting tight junction degradation. Oncotarget. 2016;7(42):67857-67
21. Wiessner C, Bareyre FM, Allegrini PR, Mir AK, Frentzel S, Zurini M. et al. Anti-Nogo-A antibody infusion 24 hours after experimental stroke improved behavioral outcome and corticospinal plasticity in normotensive and spontaneously hypertensive rats. J Cereb Blood Flow Metab. 2003;23(2):154-65
22. Choi HS, Ahn SS, Shin NY, Kim J, Kim JH, Lee JE. et al. Permeability parameters measured with dynamic contrast-enhanced MRI: Correlation with the extravasation of evans blue in a rat model of transient cerebral ischemia. Korean J Radiol. 2015;16(4):791-7
23. Lim W, Sohn H, Ko Y, Park M, Kim B, Jo D. et al. Real-time in vivo imaging of metastatic bone tumors with a targeted near-infrared fluorophore. Oncotarget. 2017;8(39):65770-7
24. Kassner A, Merali Z. Assessment of Blood-Brain Barrier Disruption in Stroke. Stroke. 2015;46(11):3310-15
25. Winkler EA, Nishida Y, Sagare AP, Rege SV, Bell RD, Perlmutter D. et al. GLUT1 reductions exacerbate Alzheimer's disease vasculo-neuronal dysfunction and degeneration. Nat Neurosci. 2015;18(4):521-30
26. Grimbleby FH, Ntailianas HA. Binding of trichloroacetic acid by protein. Nature. 1961;189:835-6
27. Radu M, Chernoff J. An in vivo assay to test blood vessel permeability. J Vis Exp. 2013(73):e50062
28. Cai X, Bandla A, Mao D, Feng G, Qin W, Liao LD. et al. Biocompatible Red Fluorescent Organic Nanoparticles with Tunable Size and Aggregation-Induced Emission for Evaluation of Blood-Brain Barrier Damage. Adv Mater. 2016;28(39):8760-5
Author contact
![]() Corresponding authors: Hyung-Seok Kim, M.D., Ph.D., 160 Baekseo-ro, Dong-gu, Gwangju 61469, South Korea. Office: +82-62-220-4092; Fax: +82-62-223-4250; Email: veritasac.kr and Hoon Hyun, Ph.D., 160 Baekseo-ro, Dong-gu, Gwangju 61469, South Korea. Office: +82-61-379-2652; Fax: +82-61-379-8455; Email: hhyunac.kr
Corresponding authors: Hyung-Seok Kim, M.D., Ph.D., 160 Baekseo-ro, Dong-gu, Gwangju 61469, South Korea. Office: +82-62-220-4092; Fax: +82-62-223-4250; Email: veritasac.kr and Hoon Hyun, Ph.D., 160 Baekseo-ro, Dong-gu, Gwangju 61469, South Korea. Office: +82-61-379-2652; Fax: +82-61-379-8455; Email: hhyunac.kr