Impact Factor ISSN: 1449-1907

 Global reach, higher impact
Int J Med Sci 2018; 15(6):536-548. doi:10.7150/ijms.23402 This issue Cite
Research Paper
miRNA-135b Contributes to Triple Negative Breast Cancer Molecular Heterogeneity: Different Expression Profile in Basal-like Versus non-Basal-like Phenotypes
Paolo Uva1*, Paolo Cossu-Rocca2,3* ![]() , Federica Loi4, Giovanna Pira5, Luciano Murgia2, Sandra Orrù6, Matteo Floris1, Maria Rosaria Muroni2, Francesca Sanges2, Ciriaco Carru5, Andrea Angius7, Maria Rosaria De Miglio2
, Federica Loi4, Giovanna Pira5, Luciano Murgia2, Sandra Orrù6, Matteo Floris1, Maria Rosaria Muroni2, Francesca Sanges2, Ciriaco Carru5, Andrea Angius7, Maria Rosaria De Miglio2
1. CRS4, Science and Technology Park Polaris, Piscina Manna, 09010, Pula, Cagliari, Italy;
2. Department of Clinical and Experimental Medicine, University of Sassari, Viale San Pietro 8, 07100, Sassari, Italy;
3. Department of Diagnostic Services, Pathology Unit, “Giovanni Paolo II” Hospital, ASSL Olbia - ATS Sardegna, Via Bazzoni-Sircana, 07026, Olbia, Italy;
4. Osservatorio Epidemiologico Veterinario Regionale, Via XX Settembre 9, OEVR, 09125, Cagliari, Italy;
5. Department of Biomedical Sciences, University of Sassari, 07100,Viale San Pietro 43b, Sassari, Italy;
6. Department of Pathology, “A. Businco” Oncologic Hospital, ASL Cagliari, Via Jenner 1, 09121, Cagliari, Italy;
7. Istituto di Ricerca Genetica e Biomedica (IRGB), CNR, Cittadella Universitaria di Cagliari, 09042, Monserrato (CA), Italy
*These two authors contributed equally to this work.
Received 2017-10-19; Accepted 2018-1-5; Published 2018-3-9
Abstract
The clinical and genetic heterogeneity of Triple Negative Breast Cancer (TNBC) and the lack of unambiguous molecular targets contribute to the inadequacy of current therapeutic options for these variants. MicroRNAs (miRNA) are a class of small highly conserved regulatory endogenous non-coding RNA, which can alter the expression of genes encoding proteins and may play a role in the dysregulation of cellular pathways. Our goal was to improve the knowledge of the molecular pathogenesis of TNBC subgroups analyzing the miRNA expression profile, and to identify new prognostic and predictive biomarkers.
We conducted a human miRNome analysis by TaqMan Low Density Array comparing different TNBC subtypes, defined by immunohistochemical basal markers EGFR and CK5/6. RT-qPCR confirmed differential expression of microRNAs. To inspect the function of the selected targets we perform Gene Ontology and KEGG enrichment analysis.
We identified a single miRNA signature given by miR-135b expression level, which was strictly related to TNBC with basal-like phenotype. miR-135b target analysis revealed a role in the TGF-beta, WNT and ERBB pathways. A significant positive correlation was identified between neoplastic proliferative index and miR-135b expression.
These findings confirm the oncogenic roles of miR-135b in the pathogenesis of TNBC expressing basal markers. A potential negative prognostic role of miR-135b overexpression might be related to the positive correlation with high proliferative index. Our study implies potential clinical applications: miR-135b could be a potential therapeutic target in basal-like TNBCs.
Keywords: Triple Negative Breast Cancer, miR-135b, Basal-like Breast Cancer, Prognostic marker, MicroRNA expression profile, TaqMan Low Density Array
Introduction
Breast cancer (BC) is the most frequent malignant tumor in females and the commonest cause of cancer death among women worldwide [1]. Gene expression profiling studies have established the heterogeneous nature of BC, which might be considered as a collection of distinct “intrinsic” subtypes, including luminal A, luminal B, ERBB2+, basal, and normal breast-like, showing variable biologic and clinic behavior and response to treatment [2,3].
Breast cancer with basal-like phenotypes defined by the expression of high molecular weight (basal) cytokeratin are well known by pathologists, although the focus on these tumors occurred with the identification of the basal-like “intrinsic” (BLBC) subtype, which shows a more aggressive clinical behavior than that of Luminal A and B subtypes [4].
About 75% of BLBCs are referred to Triple Negative phenotype (TNP), being ER/PR/HER2 negative and basal markers positive by immunohistochemistry, while the remaining 25% comprises all other “intrinsic” subtypes [5,6].
Triple Negative Breast Cancer (TNBC) encompasses a heterogeneous group of tumors with different clinic-pathological features and genetic-molecular alterations [7] and is histologically prevalently categorized as high-grade invasive carcinomas of no special type (NST). Other special phenotypes, such as metaplastic, medullary and adenoid cystic carcinomas are still included among TNBC. These special phenotypes substantially differ in terms of biologic behavior and clinical course [8].
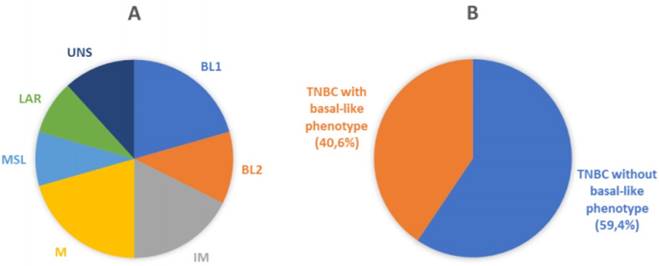
Recently, Lehmann et al. provided further insight in the complexity of the disease. Distinct TNBC subtypes were identified by transcriptional analysis, i.e. basal-like 1-2 (BL1-2), immunomodulatory (IM), claudin-low-enriched mesenchymal (M), mesenchymal stem-like (MSL), and luminal androgen receptor (LAR) variants, each showing a unique biology and specific drug sensitivities (Figure 1A) [9]. The potential clinical utility of assessing TNBC subtypes was determined by displaying different pathologic complete response (pCR) rates after chemotherapy among molecular TNBC subtypes, with the BL1 subtype achieving the highest pCR rate (52%) [10]. Therefore, the treatment of TNBC patients has been demanding due to the heterogeneity of the disease and the absence of unambiguous molecular targets.
Molecular and phenotypic heterogeneity of TNBC. A) Pie chart displaying molecular sub-classification and prevalence of subtypes of TNBC. BL1, basal-like 1; BL2, basal-like 2; IM, immunomodulatory; M, mesenchymal; MSL, mesenchymal stem-like; LAR, luminal AR; UNS, unstable (according to Lehmann et al.) [9]. B) Schematic representation of classification of breast cancer samples analyzed in the current study. Our cohort was represented by TNBC (106 cases) that were sub-classified by immunohistochemical analysis in Basal-like phenotypes (43 cases) and non-Basal-like phenotypes (63 cases), using EGFR and CK5/6 as basal markers.
Recently, the molecular biology of BC has entered in the era of miRNAs, a class of endogenous, small, non-coding RNA that regulate gene expression by interacting with target mRNAs, resulting in either mRNA degradation or translational repression [11]. MiRNAs are involved in multiple signaling pathways, including cell cycle regulation, proliferation, differentiation and apoptosis [12] and can regulate the development of tumors [13], so they could potentially be used as therapeutic targets. MicroRNA profiling platforms are widely used to evaluate differentially expressed miRNAs between tumors and corresponding healthy tissue to establish the relationship between miRNAs dysregulation and human neoplastic disease. Specifically, expression level variations in several miRNAs have been identified between normal and neoplastic breast tissues [14,15], among different molecular subtypes of BC [16] and in BC with different response to endocrine therapy [17]. Different miRNAs have been found to be involved in the pathogenesis of TNBC [18,19] and recent studies have been developed to identify miRNA profiles and their target genes, which might function as potential biomarkers to predict efficacy of anticancer drugs and cancer prognosis [20-22].
Our study is focused on miRNAs expression profiles in basal-like TNBC compared with non-basal-like TNBC, also defined as Quintuple Negative Breast Cancer (QNBC) [23], to yield further insights into the molecular mechanisms of tumorigenesis in these subcategories of TNBC with poor prognosis and deprived of therapeutic options.
Materials and Methods
Patients and samples
The study was conducted according to the Declaration of Helsinki. The protocol was reviewed and approved by the Azienda Sanitaria Locale Sassari Bioethics Committee (n. 1140/L, 05/21/2013), which renounced the need for written informed consent from patients, according to the Italian legislation on guidelines for the implementation of retrospective observational studies (G.U. n. 76, 31/03/2008). The breast tissue sample dataset of the Histopathology Department archive of Cagliari (Italy) was completely anonymized. We selected 106 TNBC, out of a pool of 593 primary TNBC, collected and diagnosed in about 14-years of routine activity, according with the availability of formalin-fixed, paraffin-embedded (FFPE) tumor blocks from surgical specimens. All cases were fully re-analyzed by two experienced pathologists, and categorized according to current WHO classification [24].
Data after diagnosis were available for 102 TNBC patients. The follow-up started at time of diagnosis (January 2000 - October 2014) and ended on December 2014. The median follow-up time was 65 months [longest follow-up time 183 months from diagnosis; 63% (64/102) ≥ 36 months; 54% (55/102) ≥ 60 months].
Moreover, we selected 9 normal breast tissues (NBT) from patients who underwent breast reduction surgery.
From FFPE specimens, 3μm-thick tissue sections were cut for hematoxylin and eosin stains (H&E) and immunohistochemical analysis. Additional consecutive sections were also obtained for RNA extraction and genetic analysis.
Immunohistochemistry
TNBC subtypes definition was established by immunohistochemistry using the basal markers Epidermal Growth Factor Receptor (EGFR) and Cytokeratin 5/6 (CK5/6). TNBC cases positive for EGFR or CK5/6 or both were categorized as BLBC, whereas tumors negative for both markers were defined as QNBC (the “five markers method”) (Figure 1B) [25,26].
Immunohistochemistry was performed using specific antibodies against mouse monoclonal Androgen Receptor (AR, clone 2F12, dilution 1:25, Novocastra, Dublin, OH, USA) and mouse monoclonal CK5/6 (Clone CK5/6.007, dilution 1:100, Biocare Medical, Concord, CA, USA). Immunostaining was performed using an autostainer system (Benchmark Ultra Ventana-Roche). Mouse monoclonal EGFR (Clone 2-18C9) immunoreaction was executed using EGFR pharmDx™ Kit (DakoCytomation), according to manufacturer's instructions.
AR expression was interpreted as positive if at least 1% immunostained tumor nuclei were detected in the sample, according with ASCO/CAP recommendations for immunohistochemical testing of hormone receptors in BC. CK5/6 was considered positive when ≥ 5% of neoplastic cells exhibited immunoreactivity. Moreover, the results were scored semi-quantitatively including intensity (0, negative; 1+, weak; 2+, moderate; 3+, strong). EGFR was considered positive when ≥ 1% of neoplastic cells exhibited positivity, according to manufacturer's instructions. Finally, subcellular localization of immunostaining was also assessed for each antibody for all positive tumors.
RNA isolation
Five 10 μm-thick consecutive sections from TNBC and NBT specimens were prepared, and tumors were macro-dissected with a scalpel blade under sterile conditions, using corresponding H&E stained sections as a guide. Total RNAs were extracted using a miRNeasy FFPE Kit (Qiagen, Hilden, Germany) in accordance with the manufacturer's instructions. RNA concentration and purity were assessed using the Nanodrop ND-1000 spectrophotometer (Thermo Fisher Scientific, Waltham, MA, USA) and the Qubit-fluorometric quantitation using Qubit® RNA BR Assay Kit (Thermo Fisher Scientific). The RNA integrity was assessed by the RNA Integrity Number (RIN) using the Agilent RNA 6000 Nano Kit on the BioAnalyzer 2100 (Agilent, Santa Clara, CA, USA)
Human miRNA card array and quantitative real-time PCR
The human miRNome analysis was first performed in a subset of our cohort 4 BLBC, 5 QNBC and 2 NBT. We have used the TaqMan® Array Human MicroRNA Card A set v3.0 (Thermo Fisher Scientific): a high throughput PCR-based miRNA array, which enables analysis of 384 miRNA assays present in the miRBase version 18.0. The card A contains three endogenous controls (MammU6, RUN44, and RUN48) for relative quantitation, of which only MammU6 was present in four replicates while the other two controls appeared just once, and an assay unrelated to any mammalian species, ath-miR-159a, as a negative control. Total RNAs (1000 ng) were converted to cDNAs using Megaplex™ RT Primers Human Pool A (Thermo Fisher Scientific), that contain a set of 377 stem-looped reverse transcriptional primers and 4 controls, and TaqMan® MicroRNA Reverse Transcription kit (Thermo Fisher Scientific). The reverse transcription mix included 1.07x Megaplex™ RT Primers Human Pool A, 1.07x RT buffer, 0.65mM each of dNTPs, 3mM MgCl2, 75U/μl MultiScribe reverse transcriptase, and 2U/μl RNase inhibitor. The 7.5 μl reactions were incubated at the following conditions: 40 cycles at 16°C for 2 minutes, 42°C for 1 minute and at 50°C for 1 second, and 1 final cycle at 85°C for 5 minutes.
PCRs were performed using 450μl TaqMan® Universal PCR Master Mix, No AmpErase UNG (2X; Thermo Fisher Scientific), and 6 μl diluted pre-amplification product in a final volume of 900 μl. One hundred μl of the PCR mix were dispensed into each port of the TaqMan miRNA array, and then the fluidic card was centrifuged and mechanically sealed. The 384-well format TaqMan Low Density Array (TLDA) arrays were run on an ABI 7900HT Fast Real-Time PCR system at the following conditions: 50°C for 2 minutes, 94.5°C for 1 minute, and 40 cycles at 97°C for 30 seconds and 59.7°C for 1 minute. RT-qPCR raw data were analyzed using SDS 2.4 and RQ Manager Software (Thermo Fisher Scientific).
The differential expression of significantly deregulated miRNAs (q-value < 0.05) was further validated by RT-qPCR in an independent dataset of patients and controls (24 BLBC, 28 QNBC, 9 NBT) constituting our validation cohort. The cDNA synthesis was performed as described above. The PCR reactions were carried out in final volumes of 10 μl using the Applied Biosystems 7900HT Fast Real-Time PCR System (Thermo Fisher Scientific). Briefly, reaction mix consisted of 54 ng of reverse-transcribed RNA, 1x TaqMan® Universal PCR Master Mix, 0.2 mM TaqMan® primer-probe mix (Thermo Fisher Scientific). An RT-negative control was included in each batch of reactions. Cycling conditions were: 10 minutes of denaturation at 95°C, 40 cycles at 95°C for 15 seconds and at 60°C for 1 minute. MiRNA U6 was used as reference for normalizing miRNA expression. All reactions were performed in triplicate.
Prediction of miRNA targets, gene ontology and pathways mapping
To predict the potential target genes of the specific deregulated miRNAs we utilized 7 target prediction algorithms: DianaMicroT_strict [27], miRanda-mirSVR_S_C [28], MirTarget2 [29], picTar_chicken [30], PITA_Top [31], starBase [32] and TargetScan_v6.2 [33]. In addition, experimentally validated targets were identified by literature search and collected from miRecords [34] and mirTarBase v4.5 [35] databases. Comparisons of target genes lists were performed with custom scripts using the computing environment R [36]. Targets predicted by at least two of the seven prediction algorithms or experimentally validated (i.e. reported in at least one database or in literature) were selected for subsequent analysis.
To inspect the function of the differentially expressed miRNAs, the selected targets were used to perform Gene Ontology (GO) and KEGG enrichment analysis using the Database for Annotation, Visualization, and Integrate Discovery (DAVID) Knowledgebase (http://david.abcc.ncifcrf.gov). Terms with Benjamin-corrected enrichment p-values <0.1 were considered.
Statistical analysis
Patient characteristics are presented according to BLBC and QNBC subtypes (Table 1). Descriptive overall and subgroup analysis was carried out and differences in the basic characteristics and clinical parameters were analyzed using the Student t-test for normal distributed variables, Chi-Square test, or Fisher's exact test in case of less than five expected cases, were used to test differences in frequencies, as appropriated. The primary end-point of the analysis was overall survival (OS) expressed as the number of months from diagnosis to the date of death or to last follow up, if no event occurred (censored time). Follow-up was updated as of 31 December 2014. The Kaplan-Meier method was used to plot survival curves and cumulative incidence of events, and the log-rank test was used to compare mean survival rates across subtypes. For multivariate analysis, Cox regression model was built to estimate the adjusted hazard ratios (HRs) of breast cancer subtypes with age, tumor size, histological type, grade, stage, Ki67, tumor infiltrating lymphocyte and androgen receptors expression.
Clinic-pathological characteristics of Triple Negative Breast Cancer subtypes.
| BLBC (n = 63) n (%) | QNBC (n = 43) n (%) | p-value* | |
|---|---|---|---|
| Age (years) | 58 (16) | 57 (12) | 0.78 |
| Menstrual status | 0.49 | ||
| None | 13 (45) | 7 (32) | |
| Physiological | 11 (38) | 12 (54) | |
| Post-surgery | 5 (17) | 3 (14) | |
| Site | 0.14 | ||
| Dx | 33 (59) | 17 (39) | |
| Sx | 22 (39) | 24 (56) | |
| Bilateral | 1(2) | 2 (5) | |
| Histologic subtype | 0.088 | ||
| Ductal | 42 (69) | 28 (68) | |
| Lobular | 0 (0) | 3 (7) | |
| Other subtype | 19 (31) | 10 (24) | |
| Size (cm) | 0.78 | ||
| ≤ 2 cm | 31 (51) | 22 (54) | |
| > 2 cm | 30 (49) | 19 (46) | |
| pT | 0.75 | ||
| T1-T2 | 54 (87) | 38 (91) | |
| T3-T4 | 8 (13) | 4 (9) | |
| pN | 0.407 | ||
| N0-N1 | 47 (82) | 31 (76) | |
| N2-N3 | 10 (18) | 10 (24) | |
| Grade | 0.279 | ||
| 1 | 4 (6) | 2 (5) | |
| 2 | 13 (21) | 4 (9) | |
| 3 | 46 (73) | 36 (86) | |
| Stage | 0.404 | ||
| I | 13 (23) | 13 (33) | |
| II | 30 (54) | 16 (40) | |
| III | 13 (23) | 11 (27) | |
| Necrosis | 0.188 | ||
| Present | 24 (41) | 12 (29) | |
| Absent | 34 (59) | 30 (71) | |
| Tumor infiltrating lymphocyte | 0.082 | ||
| Present | 21 (40) | 24 (58) | |
| Absent | 31 (40) | 17 (42) | |
| Lympho-vascular invasion | 0.255 | ||
| Present | 18 (35) | 10 (24) | |
| Absent | 34 (65) | 32 (76) | |
| Margin's infiltration | 0.561 | ||
| Present | 3 (8) | 1 (4) | |
| Absent | 35 (92) | 23 (96) | |
| Ki67 | 0.105 | ||
| ≤ 35% | 41 (67) | 21 (51) | |
| > 35% | 20 (33) | 20 (49) | |
| Androgen receptors | 0.854 | ||
| Present | 18 (29) | 13 (30) | |
| Absent | 45 (71) | 30 (70) | |
| Surgery | 0.507 | ||
| Mastectomy | 19 (35) | 12 (28) | |
| Lumpectomy | 1 (2) | 2 (5) | |
| Quadrantectomy | 31 (56) | 28 (65) | |
| Combined | 4 (7) | 1 (2) | |
| EGFR | < 0.0001 | ||
| Positive | 50 (79) | 0 (0) | |
| Negative | 13 (21) | 43 (100) | |
| CK 5/6 | < 0.0001 | ||
| Positive | 45 (71) | 0 (0) | |
| Negative | 18 (29) | 43 (100) |
BLBC = Basal-like breast cancer
QNBC = Quintuple negative breast cancer
n = number
*The p-values are bold where they are less than or equal to the significance level of 0.05.
Relative miRNA expression was calculated using the comparative cycle threshold (2-ΔΔCt) method [37]. Ct values were normalized using the quantile normalization method. An unsupervised hierarchical clustering, using Pearson's correlation as distance measure and average linkage as agglomerative algorithm, was used to assess which samples clustered together based on their expression profiles. miRNAs with statistically significant changes in expression were identified by Statistical Analysis of Microarray (SAM) analysis [38]. Differences with False Discovery Rate (FDR) corrected p-value (q-value) <0.05 were retained as statistically significant. All the analyses were performed in R using the samr package for differential expression analysis, and STATA version 13 (STATA Corp., TX, USA).
Results
Comparative analysis of basal-like versus non-basal-like TNBC
One hundred and six patients diagnosed with primary TNBC were involved in the study. The immunohistochemical results for EGFR and CK5/6 are shown in Figure 2; the immunoreactivity was observed as membranous or membranous-cytoplasmic and cytoplasmic, respectively. Fifty out of 106 (47.2%) TNBC expressed EGFR with variable staining intensity (1+ to 3+) and percentages of positive neoplastic cells varying between 5% and 99%. Normal breast tissues present in TNBC samples did not show EGFR immunoreactivity. Forty-five out of 106 (42.5%) TNBC expressed CK5/6 with variable staining intensity (1+ to 3+) and percentages of positive neoplastic cells varying between 5% and 100%. Co-expression of EGFR and CK5/6 was detectable in 32 out of 106 (30.2 %) of TNBC. Forty-three out of 106 (40.6%) TNBC were negative for both basal markers and were considered as TNBC without basal-like features (Figure 1B).
Morphologic and immunohistochemical features of Triple Negative Breast Cancer. A) Hematoxylin & Eosin stain illustrates a Triple Negative variant with features of high grade infiltrating duct carcinoma (original magnification 200X); B) Immunohistochemistry for EGFR displaying moderate to strong, membranous and membranous-cytoplasmic immunoreactivity (original magnification 200X); C) Immunohistochemistry for CK5/6 showing diffuse and intense cytoplasmic immunoreactivity (original magnification 200X); D) Immunohistochemistry for AR showing intense nuclear immunoreactivity in the majority of neoplastic cells (original magnification 200X).
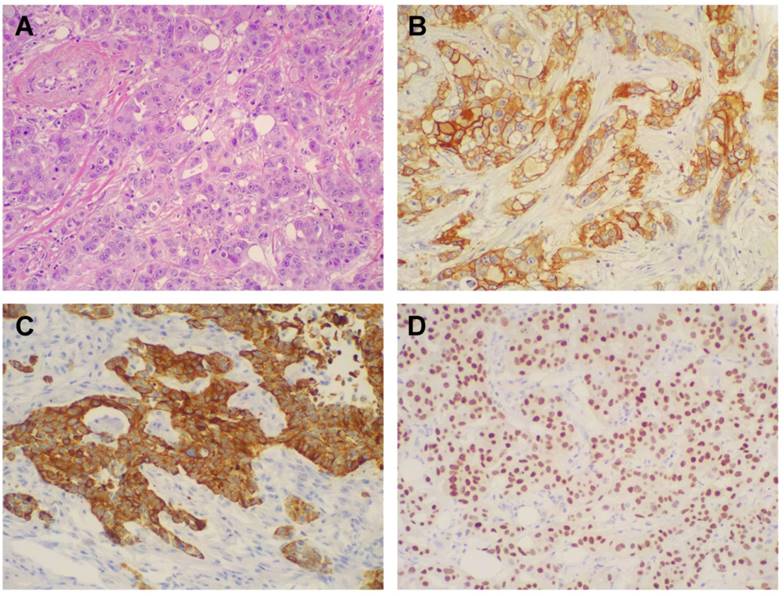
Androgen Receptor expression was identified in 28 out of 106 TNBC (26.4%), namely 16 out of 63 (25.4%) BLBC and in 12 out of 43 (27.9%) QNBC.
The clinic-pathological features at diagnosis of BLBC and QNBC included in this study are reported in Table 1. No significant differences were found between the two groups except in the distribution of EGFR and CK5/6 expression, as expected by the immunohistochemical classification of TNBCs used in this study.
Clinical outcomes
The median follow-up time was 65 months overall, 74 months for BLBC group (range 1-183) and 35 for QNBC group (range 4-132) with a significant difference between the two subset (p-value = 0.015). No patients died of other diseases or casualties. 45 BLBCs and 37 QNBCs patients were reported to be alive with no evidence of disease (NED) at the ended follow-up date. Two patients for each group were lost from follow-up and they were excluded by survival analysis.
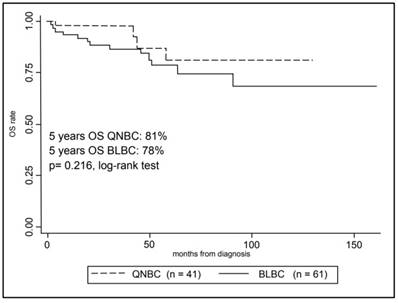
In Figure 3, Kaplan-Meier curves are shown for the OS comparing the two groups. The 5-year overall survival rate was 80% ± 4% (mean ± SE) for the overall cohort, in particular 78% ± 5% (mean ± SE) for BLBCs and 81% ± 9% (mean ± SE) for QNBCs, however this difference in survival rate was not statistically significant (p-value = 0.216, log-rank test).
Kaplan-Meier analysis of patients Overall Survival with Triple Negative Breast Cancer according to selected immunohistochemistry subtypes.
Multivariate analyses results are shown in Table 2. BLBC group shows an increased risk of death compared to QNBC group, but this difference has a borderline statistically significance (HR for OS: 3.26, 95% CI: 0.98 - 10.1, p-value = 0.054). Patients with Androgen Receptors expression have an increased risk of death (HR for OS: 2.90, 95% CI: 1.19 - 7.06, p-value = 0.019). Tumor size is a good predictive factor of the OS, with a statistically significant difference in risk increase when tumor size is greater than 2 cm compared to minor (HR for OS: 3.25, 95% CI: 1.28 - 8.30, p-value = 0.013). Finally, high Ki67 value is an independent prognostic factor for poor survival (HR for OS: 0.098, 95% CI: 0.094 - 0.099, p-value = 0.026).
Multivariate Analysis for Overall Survival.
| Overall survival | |||
|---|---|---|---|
| Hazard ratio | 95% IC | p-value * | |
| TNBC subtype | |||
| QNBC | Ref | ||
| BLBC | 3.26 | 0.98 - 10.1 | 0.054 |
| Age | |||
| ≤ 50 | Ref | ||
| > 50 | 2.53 | 0.52 - 12.4 | 0.25 |
| Grade | |||
| I/II | Ref | ||
| III | 0.63 | 0.15 - 2.55 | 0.52 |
| Histological type | |||
| Other | Ref | ||
| Ductal | 1.71 | 0.34 - 8.53 | 0.51 |
| Size (cm) | |||
| ≤ 2 | Ref | ||
| > 2 | 3.25 | 1.28 - 8.30 | 0.013 |
| Stage | |||
| 1 | Ref | ||
| 2 | 1.09 | 0.18 - 6.47 | 0.92 |
| 3 | 2.70 | 0.51 - 14.2 | 0.24 |
| Tumor infiltrating lymphocyte | |||
| Negative | Ref | ||
| Positive | 0.38 | 0.08 - 1.85 | 0.23 |
| Androgen receptors | |||
| Negative Positive | Ref 2.90 | 1.19 - 7.06 | 0.019 |
| Ki67 | |||
| ≤ 35% | Ref | ||
| > 35% | 0.098 | 0.094 - 0.099 | 0.026 |
*The p-values are bold where they are less than or equal to the significance level of 0.05.
MiRNA expression profiles of basal-like versus non-basal-like TNBC
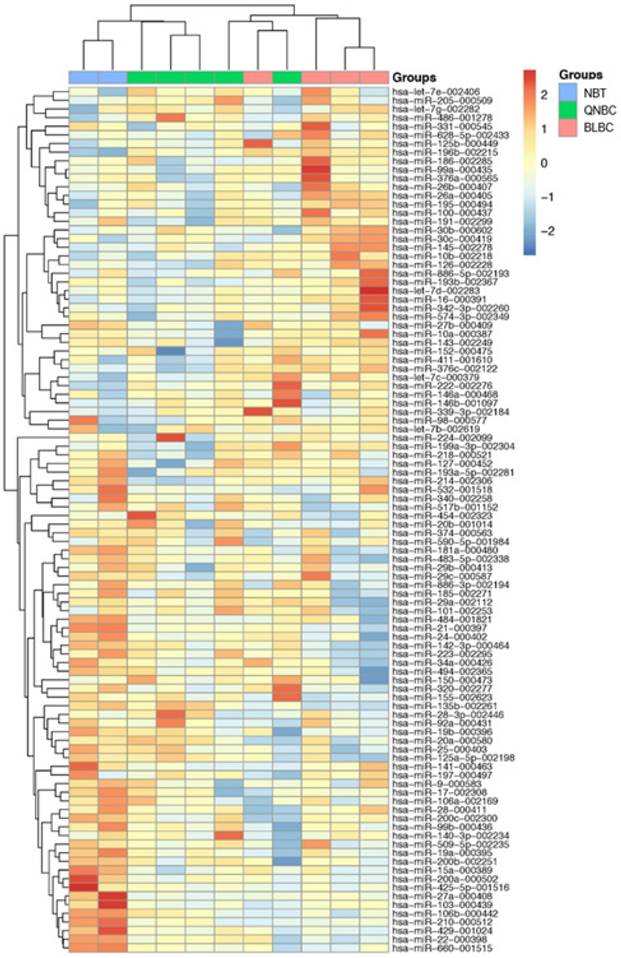
RT-PCR data using TLDA in BLBC and QNBC, and normal breast tissues were produced. After normalization and removing the miRNAs that were not expressed in most of the cohort, 100 miRNAs were used to perform unsupervised hierarchical clustering analysis, which clearly separated normal breast tissue samples from tumor samples. Additionally, the cluster of tumor samples was further divided in two subgroups, BLBC and QNBC (Figure 4).
A 100-miRNAs expression signature reveals changes between TNBC with basal and non-basal features and NBT. Unsupervised hierarchical clustering analysis of basal-like breast cancer (BLBC; pink), quintuple negative breast cancer (QNBC; green) and normal breast tissue (NBT; blue) was performed using 100 differentially expressed miRNAs. Dendrograms of clustering analysis for samples and miRNAs are displayed on the top and left, respectively, and depicts similarities in the gene expression profiles among the samples. The relative up and down regulation of miRNAs is indicated by red and light blue, respectively. hsa; Homo sapiens.
Using SAM analysis, only miR-135b showed statistical differential expression between BLBC and QNBC samples (q-value = 0.011). The expression levels of miR-135b were upregulated in BLBC compared with QNBC. miR-135b identified as differentially expressed by microarray analysis was selected for further validation by RT-qPCR. Comparison of expression levels between the miRNA-135b array data and the RT-qPCR results demonstrated a strong correlation between the methodologies (Figure 5).
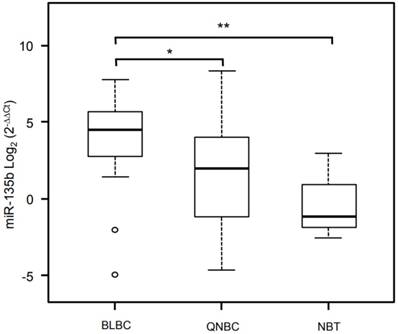
Validation analysis for miR-135b expression levels by real-time polymerase chain reaction. Box and whisker plots were used to summarize the distribution of miR-135b expression levels of 4.50 (interquartile range, 2.79/5.61) in BLBC, 1.98 (interquartile range, -1.16/3.95) in QNBC and -1.14 (interquartile range, -1.82/-0.89) in normal breast tissue. Statistical analysis by Mann Whitney test showed significant differences with *p-value = 0.007 between BLBC and QNBC, and with **p-value = 0.04 between BLBC and NBT. Box plot explanation: upper horizontal line of box, 75th percentile; lower horizontal line of box, 25th percentile; horizontal bar within box, median; upper horizontal bar outside box, 90th percentile; lower horizontal bar outside box, 10th percentile. Circles represent outliers. The values of miR-135b expression levels are expressed as Log2 (2-ΔΔCt).
Association analysis of clinic-pathological features and miR-135b expression level
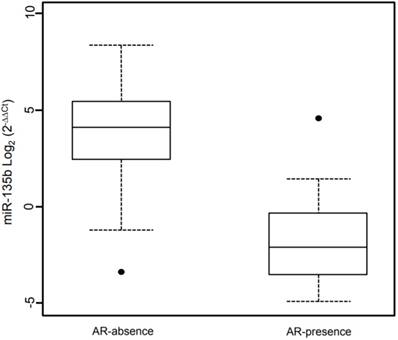
A linear regression model was fitted to identify association between miR-135b and the investigated phenotypes. This model contained as independent variables the phenotypes examined or adjusted for (Table 3). The linear regression shows a significantly association of high Ki67 expression and miR-135b overexpression (β = 0.94, p-value < 0.05) and strong positive correlation (ρ = 0.434, p-value < 0.05). Androgen receptor expression is strongly associated with low miR-135b values (β = -25.9, p-value < 0.05) and shows strong negative correlation (ρ = -0.276, p-value < 0.05), as represented in Figure 6. Each other characteristics considered didn't show statistically significantly association with miR-135b, but inverse correlation was found for the age at diagnosis (ρ= -0.326, p-value < 0.05).
miR-135b expression significantly associated with clinic-pathological tumors characteristics.
| Regression Analysis | Correlation Analysisa | |||
|---|---|---|---|---|
| Characteristic | β | p-valueb | ρ | p-valueb |
| Age (years) | - 0.82 | 0.165 | -0.326 | 0.031 |
| Ki67 | 0.94 | 0.0013 | 0.434 | 0.003 |
| Stage | 4.28 | 0.807 | 0.070 | 0.648 |
| Grade | 1.50 | 0.951 | 0.239 | 0.117 |
| Size (cm) | 0.567 | 0.572 | 0.222 | 0.146 |
| Androgen Receptors | -25.9 | 0.047 | -0.27 | 0.019 |
a Spearman's rank correlation analysis
b The p-values are bold where they are less than or equal to the significance level of 0.05.
Box plot showing the distribution of miR-135b expression levels associated with the presence/absence of Androgen Receptor status. Box plot explanation: upper horizontal line of box, 75th percentile; lower horizontal line of box, 25th percentile; horizontal bar within box, median; upper horizontal bar outside box, 90th percentile; lower horizontal bar outside box, 10th percentile. Dot represent outliers. The values of miR-135b expression levels are indicated in Log2 (2-ΔΔCt).
Genes targeted by miR-135b in TNBC
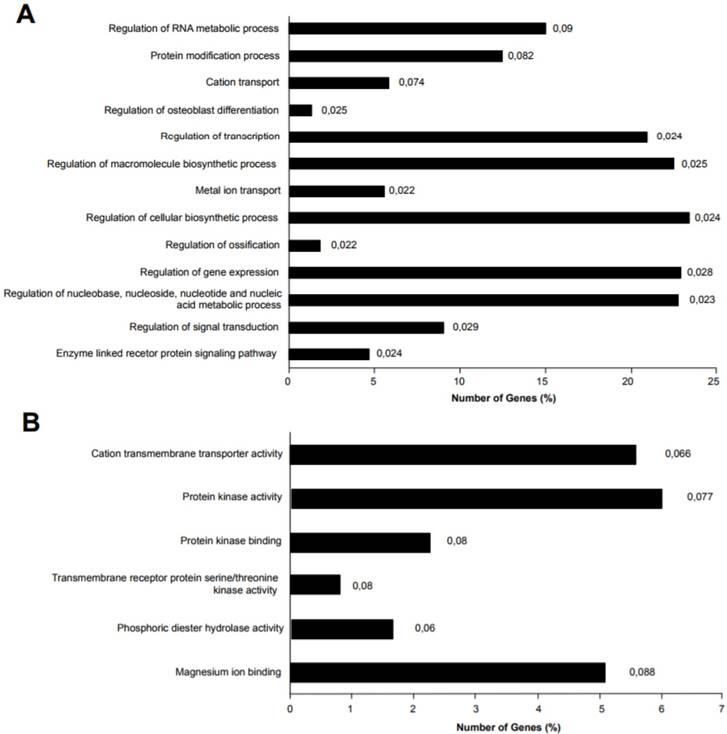
Different genes were experimentally validated as miR-135b targets, including recognized genes that are deregulated in breast cancer, such as ER, AR, LATS2, HIF1AN, RUNX2, and BMPR2 [39-41]. Accordingly, miR-135b upregulation, as identified in basal-like TNBC, affects important biological processes by deregulation of its target genes, such as the regulation of transcription, macromolecules biosynthetic process, gene expression, nucleic acid metabolic process, signal transduction, enzyme linked receptor protein signaling pathway. The deregulation of these biological processes might explain molecular mechanisms of tumorigenesis and the strong aggressiveness of basal-like TNBC, controlling basic cellular functions such as growth, differentiation, apoptosis etc. Moreover, the miR-135b target genes were also enriched in interesting molecular function classes, as represented in Figure 7A-B.
miR-135b target genes were analyzed for Gene Ontology (GO) enrichment and mapped for Gene Ontology category. A) Percentage of target genes involved in each GO Biological Processes term. B) Percentage of target genes involved in each GO Molecular Functions term. The represented GO terms were significant at p-value < 0.1. The values at the end of the bars represent the p-values.
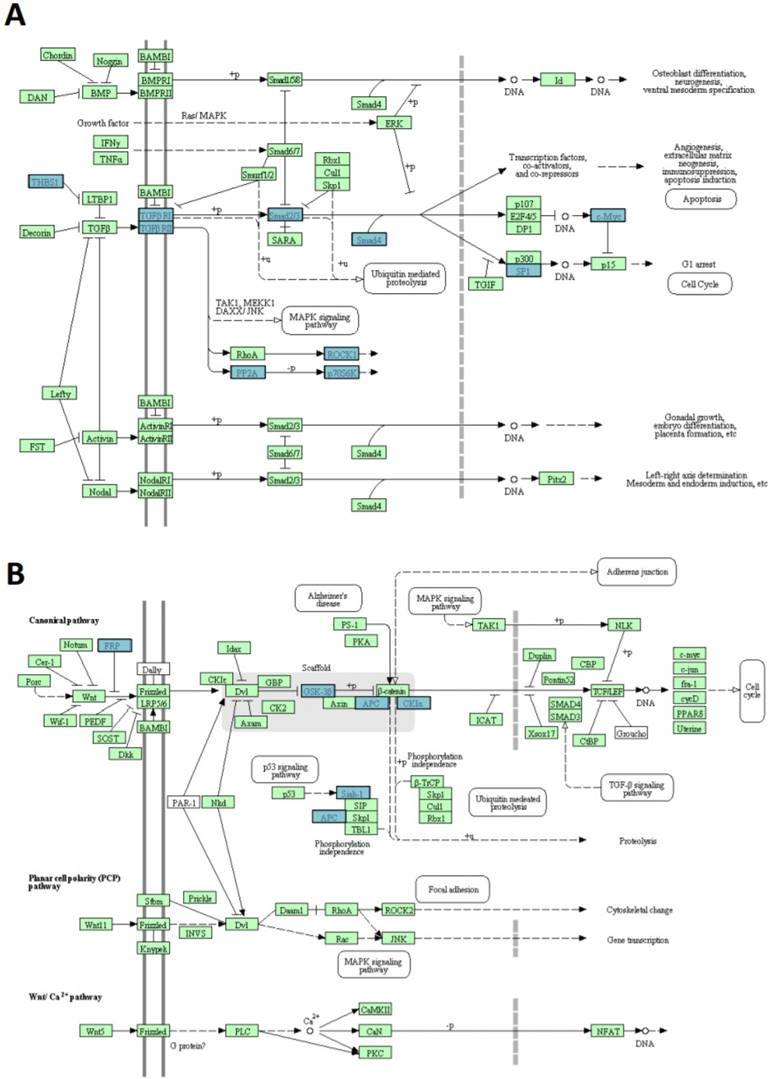
In silico prediction analysis found that the set of genes regulated by miR-135b was enriched of several proteins (THBS1-2, TGFBR1-2, SMAD2-4, SP1, MYC, ROCK1-2, PP2A-P70S6K), that have key roles in TGF-beta signaling pathway, GSK-3β, CK1α, APC, SFRP4, SIAH1 members of WNT signaling pathway and CBL-b component of ERBB signaling pathway (Figure 8A-B). These pathways have already been correlated with breast cancer pathogenesis [42-44].
miR-135b upregulated in BLBC represses multiple genes. A) TGF-beta signaling pathway and B) WNT signaling pathway. The pathways listed and diagrams are those generated by Kyoto Encyclopedia of Genes and Genome 4 (KEGG), via the DAVID (Database for Annotation, Visualization, and Integrate Discovery). Blue rectangles represent genes targeted by miR-135b; green rectangles represent genes that are not targeted by miR135b.
Discussion
The recognition of miRNAs as regulators of gene expression identifies them as new diagnostic and prognostic indicators and new therapeutic targets. Furthermore, it is currently accepted that the miRNA expression profile shows high accuracy in the classification of tumors [45].
In the current study, an extensive analysis of miRNAs expression profiles was carried out in tumor samples from TNBC patients: miR-135b, was detected overexpressed in BLBC compared to QNBC and normal breast tissue.
The miR-135 family includes miR-135a and miR-135b which are encoded by separate genes located on chromosome 3 (3p21) and 12 (12q23) for miR-135a, and on chromosome 1 (1q32.1) for miR-135b. Although, their “seed sequences” are identical, we did not observe any effect of miR-135a in our study. Nevertheless, it has been described that miRNA genes are mapped on chromosomal regions frequently interested by aberrations in human cancer, suggesting that miRNAs expression could be affected by genomic abnormalities. Interestingly, miR-135b is located on chromosome 1q32.1, one of the regions most frequently gained in breast cancer [46].
Previous evidence of the role of miRNAs in breast cancer have permitted to identify specific “miRNA expression signatures” correlated with ER, PR and HER2 status, sustaining a role in disease classification of BC [39]. miR-135b is included in the miRNA signatures related to ER status and its expression is inversely correlated with ER protein levels [39,40,47]. Additionally, strong correlation was identified between miR-135b overexpression and BLBC compared to luminal BC [47,48].
In our study, a significant association and a strong positive correlation with proliferative index of tumors highlighted the involvement of miR-135b in the TNBC aggressiveness and progression. These data are in concordance with the literature, which describes different miRNA expression signatures comparing BCs with high and low proliferative index, whose differential expression was validated and characterized by “in vitro” functional assays [47].
In silico prediction results [42-44] emphasize that miR-135b target genes are involved in molecular networks associated with tumor aggressiveness. Main signaling pathways including TGF-beta, WNT and ERBB, which control cellular proliferation, migration, invasion, apoptosis, and whose deregulation contributes to the tumor development. Moreover, Hua et al. have shown that miR-135b overexpression works as an oncogene in breast cancer and it is a key molecule to regulate proliferation, invasion, migration and cell cycle [41]. Finally, Arigoni et al. have demonstrated the association between miR-135b expression and poor overall survival and early metastatization in BC [49].
In our study, AR expression was strongly associated with low miR-135b values with a strong negative correlation, supporting a role of miR-135b in TNBC pathogenesis and progression, which should not be related to endocrine pathways. Interestingly, Aakula et al. have proved that ER and AR are targets of miR-135b in BC and prostate cancer, respectively [40].
Nowadays, clinical management of TNBC patients is founded on prognostic and predictive indicators based on traditional clinic-pathological features. The identification of prognostic factors to distinguish TNBC into biologically and clinically different groups, even with the support of “surrogate” immunohistochemical definitions of intrinsic subtypes, should be pursued to accurately select therapeutic strategies.
In our study, 59.4% of TNBC expressed one or both of the basal markers. Our results established that the main clinic-pathological features of BLBC are not different from those of QNBC. The difference in survival rate between the BLBC and QNBC demonstrated an increased risk of death for the BLBC group compared to QNBC group. These findings support the hypothesis about actual biological differences between these TNBC subgroups, and highlight the prognostic and therapeutic significance of defining the BL phenotype in TNBC patients. Interestingly, Choi et al. have revealed that QNBC had the poorer OS when compared to BLBC, although BLBC patients who did not undergo to chemotherapy were the worst prognostic subtype in terms of disease free survival and OS, concluding that the identification of basal markers consent to select TNBC patients who will more likely benefit of adjuvant chemotherapy [23].
Our analysis has shown that AR expression has to be considered as a prognostic independent factor of poor survival in TNBC patients. The role of AR in TNBC is not clear, and, mostly, there is disagreement about its prognostic significance [50-52]. Hu et al., in a study including a large number of TNBC patients with a long follow-up time (31 years), showed that the association of AR status and BC survival is dependent on ER expression, and specifically stated that TNBC patients with AR expression showed significant increase in mortality [52]. Accordingly, Farmer et al. reported that the molecular apocrine profile was associated with a poor survival [53]. Besides, “in vitro” study suggests that androgens might induce proliferative effects in ER-negative cells [54].
Our results contribute to providing concrete evidence of the prognostic significance of basal markers expression and AR status, along with usual pathologic parameters such as tumor size and Ki-67.
Our study contributes to shed light on the molecular complexity of TNBC, and shows that miR135-b expression is strictly related to basal-like molecular subtype of TNBC, compared with non-basal-like TNBC variants: the association and the positive correlation of miR-135b overexpression with high proliferative index in TNBC can explain their clinic aggressiveness.
Based on our data, we propose that miR-135b may act as an oncogene to participate in the pathogenesis of TNBC, independently of hormone pathways activation. Our study implies potential clinical applications, since modifying miR-135b expression status might be a potential therapeutic option to improve outcome of TNBCs with basal-like features. Based on our findings, we suggest the possible use of miR-135b as a blood-based biomarker as a reliable method in basal-like TNBC patients follow-up.
Abbreviations
TNBC: Triple negative breast cancer; miRNA: microRNAs; BC: Breast cancer; BLBC: Basal-like breast cancer; TNP: Triple negative phenotype; NST: High-grade invasive carcinomas of no special type; BL1-2: Basal-like1-2; IM: Immunomodulatory; M: Claudin-low-enriched mesenchymal; MSL: Mesenchymal stem-like; LAR: Luminal androgen receptor; pCR: Pathologic complete response; QNBC: Quintuple negative breast cancer; FFPE: Formalin-fixed, paraffin-embedded; NBT: Normal breast tissues; H&E: Hematoxylin and eosin; EGFR: Epidermal growth factor receptor; CK5/6: Cytokeratin 5/6; AR: Androgen receptor; RIN: RNA integrity number; TLDA: TaqMan low density array; RT-qPCR: quantitative-Real Time-PCR; GO: Gene ontology; DAVID: Database for annotation, visualization, and integrate discovery; OS: Overall survival; HRs: Hazard ratios; SAM: Statistical analysis of microarray; FDR: False Discovery Rate; NED: No evidence of disease.
Acknowledgements
We are thankful to the CRS4 HPC group for IT support. This work was supported in part by grants from Fondazione di Sardegna, Italy and from Regione Autonoma della Sardegna, Italy - Anno 2011, Legge Regionale 7 agosto 2007, n.7: "Promozione della Ricerca Scientifica e dell'Innovazione Tecnologica in Sardegna".
Ethics Committee Approval and Patient Consent
The authors declare that the study was conducted according to the Declaration of Helsinki. The protocol was reviewed and approved by the Azienda Sanitaria Locale Sassari Bioethics Committee (n. 1140/L 05/21/2013), which renounced the need for written informed consent from patients, according to the Italian legislation on guidelines for the implementation of retrospective observational studies (G.U. n. 76. 31/03/2008).
Competing Interests
The authors have declared that no competing interest exists.
References
1. Ban KA, Godellas CV. Epidemiology of Breast Cancer. Surg Oncol Clin N Am. 2014;23:409-22
2. Perou CM, Sørlie T, Eisen MB. et al. Molecular portraits of human breast tumours. Nature. 2000;406:747-52
3. De Abreu FB, Wells WA, Tsongalis GJ. The emerging role of the molecular diagnostics laboratory in breast cancer personalized medicine. Am J of Pathol. 2013;183:1075-83
4. Sorlie T, Perou CM, Tibshirani R. et al. Gene expression patterns of breast carcinomas distinguish tumor subclasses with clinical implications. Proc Natl Acad Sci USA. 2001;98:10869-74
5. Bertucci F, Finetti P, Cervera N. et al. How basal are triple-negative breast cancers? Int J Cancer. 2008;123:236-40
6. Prat A, Adamo B, Cheang MCU. et al. Molecular characterization of basal-like and non-basal-like triple-negative breast cancer. Oncologist. 2013;18:123-33
7. Metzger-Filho O, Tutt A, De Azambuja E. et al. Dissecting the heterogeneity of triple-negative breast cancer. J Clin Oncol. 2012;30:1879-87
8. Reis-Filho JS, Tutt ANJ. Triple negative tumours: A critical review. Histopathology. 2008;52:108-18
9. Lehmann BD, Bauer JA, Chen X. et al. Identification of human triple-negative breast cancer subtypes and preclinical models for selection of targeted therapies. J Clin Invest. 2011;121:2750-67
10. Masuda H, Baggerly KA, Wang Y. et al. Differential Response to Neoadjuvant Chemotherapy Among 7 Triple-Negative Breast Cancer Molecular Subtypes. Clin Cancer Res. 2013;19:5533-40
11. Guo L, Lu Z. The fate of miRNA* strand through evolutionary analysis: Implication for degradation as merely carrier strand or potential regulatory molecule? PLoS One. 2010;5:1-9
12. He L, Hannon GJ. MicroRNAs: small RNAs with a big role in gene regulation. Nat Rev Genet. 2004;5:522-31
13. Peng Y, Croce CM. The role of MicroRNAs in human cancer. Signal Transduction Targeted Ther. 2016 doi:10.1038/sigtrans.2015.4
14. Iorio MV, Ferracin M, Liu CG. et al. MicroRNA gene expression deregulation in human breast cancer. Cancer Res. 2005;65:7065-70
15. Blenkiron C, Goldstein LD, Thorne NP. et al. MicroRNA expression profiling of human breast cancer identifies new markers of tumor subtype. Genome Biol. 2007;8(10):R214
16. Foekens JA, Sieuwerts AM, Smid M. et al. Four miRNAs associated with aggressiveness of lymph node-negative, estrogen receptor-positive human breast cancer. Proc Natl Acad Sci USA. 2008;105:13021-6
17. Rodríguez-González FG, Sieuwerts AM, Smid M. et al. MicroRNA-30c expression level is an independent predictor of clinical benefit of endocrine therapy in advanced estrogen receptor positive breast cancer. Breast Cancer Res Treat. 2011;127:43-51
18. Ren Y, Han X, Yu K. et al. MicroRNA-200c downregulates XIAP expression to suppress proliferation and promote apoptosis of triple-negative breast cancer cells. Mol Med Rep. 2014;10:315-21
19. Gwak JM, Kim HJ, Kim EJ. et al. MicroRNA-9 is associated with epithelial-mesenchymal transition, breast cancer stem cell phenotype, and tumor progression in breast cancer. Breast Cancer Res Treat. 2014;147:39-49
20. Li J-Y, Jia S, Zhang W-H. et al. Differential distribution of microRNAs in breast cancer grouped by clinicopathological subtypes. Asian Pac J Cancer Prev. 2013;14:3197-203
21. Piva R, Spandidos DA, Gambari R. From microRNA functions to microRNA therapeutics: Novel targets and novel drugs in breast cancer research and treatment. Int J Oncol. 2013;43:985-94
22. Gasparini P, Cascione L, Fassan M. et al. microRNA expression profiling identifies a four microRNA signature as a novel diagnostic and prognostic biomarker in triple negative breast cancers. Oncotarget. 2014;5:1174-84
23. Choi Y-L, Oh E, Park S. et al. Triple-negative, basal-like, and quintuple-negative breast cancers: better prediction model for survival. BMC Cancer. 2010;10:507
24. Colditz G, Chia KS, Wilson C. et al. Invasive breast carcinoma: introduction and general features. In: (ed.) Lakhani SR, Ellis IO, Schnitt SJ, Tan PH van de VM. World Health Organization Classification of the Tumors-WHO Classification of Tumours of the Breast, 4th ed. Lyon: IARC Press. 2012:14-31
25. Nielsen TO, Hsu FD, Jensen K. et al. Immunohistochemical and clinical characterization of the basal-like subtype of invasive breast carcinoma. Clin Cancer Res. 2004;10:5367-74
26. Thike AA, Iqbal J, Cheok PY. et al. Triple negative breast cancer: outcome correlation with immunohistochemical detection of basal markers. Am J Surg Pathol. 2010;34:956-64
27. Paraskevopoulou MD, Georgakilas G, Kostoulas N. et al. DIANA-microT web server v5.0: service integration into miRNA functional analysis workflows. Nucleic Acids Res. 2013;41:W169-73
28. Betel D, Wilson M, Gabow A. et al. The microRNA.org resource: Targets and expression. Nucleic Acids Res. 2008;36:D149-53
29. Wong N, Wang X. miRDB: An online resource for microRNA target prediction and functional annotations. Nucleic Acids Res. 2015;43:D146-52
30. Krek A, Grün D, Poy MN. et al. Combinatorial microRNA target predictions. Nat Genet. 2005;37:495-500
31. Kertesz M, Iovino N, Unnerstall U. et al. The role of site accessibility in microRNA target recognition. Nat Genet. 2007;39:1278-84
32. Li JH, Liu S, Zhou H. et al. StarBase v2.0: Decoding miRNA-ceRNA, miRNA-ncRNA and protein-RNA interaction networks from large-scale CLIP-Seq data. Nucleic Acids Res. 2014;42:D92-7
33. Lewis BP, Burge CB, Bartel DP. Conserved seed pairing, often flanked by adenosines, indicates that thousands of human genes are microRNA targets. Cell. 2005;120:15-20
34. Xiao F, Zuo Z, Cai G. et al. miRecords: An integrated resource for microRNA-target interactions. Nucleic Acids Res. 2009;37:D105-10
35. Hsu S-D, Lin F-M, Wu W-Y. et al. MiRTarBase: A database curates experimentally validated microRNA-target interactions. Nucleic Acids Res. 2011;39:D163-69
36. Ihaka R, Gentleman R. R: A language for data analysis and graphics. J Comput Graph Stat. 1996;5:299-314
37. Livak KJ, Schmittgen TD. Analysis of relative gene expression data using real-time quantitative PCR and the 2-DDCT Method. Methods. 2001;25:402-8
38. Tusher VG, Tibshirani R, Chu G. Significance analysis of microarrays applied to the ionizing radiation response. Proc Natl Acad Sci USA. 2001;98:5116-21
39. Lowery AJ, Miller N, Devaney A. et al. MicroRNA signatures predict oestrogen receptor, progesterone receptor and HER2/neu receptor status in breast cancer. Breast Cancer Res. 2009;11:R27
40. Aakula A, Leivonen SK, Hintsanen P. et al. MicroRNA-135b regulates ERα, AR and HIF1AN and affects breast and prostate cancer cell growth. Mol Oncol. 2015;9:1287-300
41. Hua K, Jin J, Zhao J. et al. miR-135b, upregulated in breast cancer, promotes cell growth and disrupts the cell cycle by regulating LATS2. Int J Oncol. 2016;48:1997-2006
42. Jamdade VS, Sethi N, Mundhe NA. et al. Therapeutic targets of triple-negative breast cancer: a review. Br J Pharmacol. 2015;172:4228-37
43. Ding M-J, Su K, Cui G. et al. Association between transforming growth factor-β1 expression and the clinical features of triple negative breast cancer. Oncol Lett. 2016;11:4040-4
44. Rangel MC, Bertolette D, Castro NP. et al. Developmental signaling pathways regulating mammary stem cells and contributing to the etiology of triple-negative breast cancer. Breast Cancer Res Treat. 2016;156:211-26
45. Lu J, Getz G, Miska EA. et al. MicroRNA expression profiles classify human cancers. Nature. 2005;435:834-8
46. Argos M, Kibriya MG, Jasmine F. et al. Genomewide scan for loss of heterozygosity and chromosomal amplification in breast carcinoma using single-nucleotide polymorphism arrays. Cancer Genet Cytogenet. 2008;182:69-74
47. Enerly E, Steinfeld I, Kleivi K. et al. miRNA-mRNA integrated analysis reveals roles for miRNAs in primary breast tumors. PLoS One. 2011;6(2):e16915
48. Zhu M, Yi M, Kim CH. et al. Integrated miRNA and mRNA expression profiling of mouse mammary tumor models identifies miRNA signatures associated with mammary tumor lineage. Genome Biol. 2011 doi:10.1186/gb-2011-12-8-r77
49. Arigoni M, Barutello G, Riccardo F. et al. MiR-135b coordinates progression of ErbB2-driven mammary carcinomas through suppression of MID1 and MTCH2. Am J Pathol. 2013;182:2058-70
50. Niemeier LA, Dabbs DJ, Beriwal S. et al. Androgen receptor in breast cancer: expression in estrogen receptor-positive tumors and in estrogen receptor-negative tumors with apocrine differentiation. Mod Pathol. 2010;23:205-12
51. Rakha EA, El-Sayed ME, Green AR. et al. Prognostic markers in triple-negative breast cancer. Cancer. 2007;109:25-32
52. Hu R, Dawood S, Holmes MD. et al. Androgen receptor expression and breast cancer survival in postmenopausal women. Clin Cancer Res. 2011;17:1867-74
53. Farmer P, Bonnefoi H, Becette V. et al. Identification of molecular apocrine breast tumours by microarray analysis. Oncogene. 2005;24:4660-71
54. Doane AS, Danso M, Lal P. et al. An estrogen receptor-negative breast cancer subset characterized by a hormonally regulated transcriptional program and response to androgen. Oncogene. 2006;25:3994-4008
Author contact
![]() Corresponding author: Paolo Cossu-Rocca, MD., Tel/Fax: +39 079 228016/079 213559; email: roccoit
Corresponding author: Paolo Cossu-Rocca, MD., Tel/Fax: +39 079 228016/079 213559; email: roccoit