Impact Factor ISSN: 1449-1907
- Issue 8; 2026
- Issue 7; 2026
- Issue 6; 2026
- Issue 5; 2026
- Issue 4; 2026
- Volume 23; 2026
- Past Issues
- Editorial Board
- Cover Images
- Index & Coverage
- Cover Suggestion
- Special Issues
Introduction
Materials and methods
Results
Discussion
Conclusions
Abbreviations
Acknowledgements
References

 Global reach, higher impact
Int J Med Sci 2018; 15(5):484-491. doi:10.7150/ijms.23107 This issue Cite
Research Paper
Impact of placental weight and fetal/placental weight ratio Z score on fetal growth and the perinatal outcome
Yoshio Matsuda1,2 ![]() , Toshiya Itoh3, Hiroaki Itoh3
, Toshiya Itoh3, Hiroaki Itoh3 ![]() , Masaki Ogawa4, Kemal Sasaki5, Naohiro Kanayama3, Shigeki Matsubara6
, Masaki Ogawa4, Kemal Sasaki5, Naohiro Kanayama3, Shigeki Matsubara6
1. Department of Obstetrics and Gynecology, Japan Community Health Care Organization (JCHO) Mishima General Hospital 2276 Yata Aza Fujikubo, Mishima- City, Shizuoka 411-0801 JAPAN
2. Department of Obstetrics and Gynecology, International University of Health and Welfare Hospital, 537-3 Iguchi Nasushiobara, Tochigi 329-2763 Japan
3. Department of Obstetrics and Gynecology, Hamamatsu University School of Medicine 1-20-1 Handayama, Higashi-ku, Hamamatsu city, Shizuoka, Japan 431-3192
4. Department of Obstetrics and Gynecology, Tokyo Women's Medical University, 8-1 Kawada-cho, Shinjuku-ku, Tokyo 162-8666, Japan
5. Faculty of Childhood Education, Yokohama Soei University, 1 Miho-cho, Midori-ku, Yokohama, Kanagawa 226-0015
6. Department of Obstetrics and Gynecology, Jichi Medical University, 3311-1 Yakushiji, Shimotsuke, Tochigi 329-0498, Japan
Received 2017-9-29; Accepted 2018-2-3; Published 2018-3-8
Abstract
Objective: To classify the infants into 9 blocks based on the deviation of both placental weight (PW) and fetal/placental weight ratio (F/P) Z score and compared the incident rate of perinatal death in each of the small for date (SFD) vs. appropriate for date (AFD) vs. heavy for date (HFD) groups.
Methods: The study population consisted of 93,034 placentas/infants from women who vaginally delivered a singleton infant. They were classified into 3 groups according to infants' weight: SFD (n=3,379), AFD (n=81,143) and HFD (n=8,512). The population was classified into 9 blocks according to the combination of i) low vs. middle vs. high placental weight (PW: a sex-, parity- and gestational-age-specific placental weight) and ii) low vs. middle vs. high F/P. In both i) and ii), ± 1.28 standard deviations in the in the Z scores was used for classifying low vs. middle vs. high, with 3x3 making 9 blocks. We then determined whether or not the perinatal death in each block differed among the three groups (SFD vs. AFD vs. HFD).
Results: (1) The proportions of 'balanced growth of placenta and infant' (appropriate PW and F/P based on Z-score) were 37.6% in the SFD group, 78.8% in the AFD group, and 51.2% in HFD group. (2) The proportion of 'inappropriately heavy placenta' in the SFD group and that of 'inappropriately light placenta' in the HFD group were 0.3 and 0.4%, respectively, a very rare phenomenon. The proportions of 'inappropriately heavy placenta' and 'inappropriately light placenta' accounted for 4.1 and 5.5% in AFD group, respectively. (3) The rates of perinatal death in those with 'balanced growth of placenta and infant' were lowest in the SFD and AFD groups.
Conclusion: By showing the fact that perinatal death was lowest in cases with balanced fetal/ placental growth, we conclude that 9-block categorization of PW and F/P based on deviation in the Z-score may be a candidate factor employable for understanding fetal and placental growth and perinatal deaths.
Keywords: appropriate for date, fetal/placental weight ratio(F/P), heavy for date, placental weight, small for date, Z score
Introduction
Placental weight (PW), which is closely related to fetal growth, has been reported to change according to various pregnancy-related conditions. Reports have shown that a lower PW is associated with chronic hypertension/preeclampsia, whereas a higher PW is associated with maternal anemia, gestational diabetes, and fetal growth restriction [1-3]. PW may reflect the maternal and fetal environment, and, therefore may be employable to detect it. The fetal/placental weight ratio (F/P) has attracted obstetricians' attention, as it may indicate certain underlying conditions associated with some placental disorders, especially in relation to growth-restricted fetuses. This parameter has therefore been discussed in relation to adverse perinatal outcomes, such as perinatal death, non-reassuring fetal status and low Apgar scores [2, 3].
We previously showed that the F/P was significantly lower in female fetuses, primiparity, small for date (SFD) infants, and those with preeclampsia than in male fetuses, multiparity, appropriate for date (AFD) infants, and those without preeclampsia, respectively [4].
In addition, a Norwegian birth cohort study found that infants with a decreased F/P at birth were more likely to develop certain cardiovascular events in adulthood; therefore, PW and F/P may be important not only in evaluating individual patients but also from the perspective of the developmental origins of health and disease (DOHaD) [6]. Endemic nomograms of PW and F/P have been established for some ethnic groups and used in birth-cohort analyses [7, 8]. The lack of data on PW and F/P in Asian populations prompted us to create nomograms for PW and F/P in the Japanese population and Z scores for PW and F/P [9].
An unduly heavy placenta [10], i.e., heavier than expected from the infant's weight [11], has been reported to be associated with adverse pregnancy outcomes. In complicated pregnancies associated with a low birth weight, the placenta was relatively heavy compared with the birth weight [12]. Such an unduly heavy placenta is here referred to as 'inappropriately heavy placenta'. Similarly, an unduly light placenta is referred to as 'inappropriately light placenta”. Both have not yet been fully characterized by simple assessment by F/P.
Some reports have indicated the potential limitation of simple F/P assessment because normal F/P 'ratio' might be reflected from the results of both normal, both low, or both high of BW and PW [5] [10]. Hutcheon et, al. demonstrated that placental weight is the independent predictor for the neonatal and infantile morbidity as well as mortality [5]. Therefore, we focused on the possibility that the simultaneous assessment of F/P and PW might be useful as well as reliable for assessing pathophysiology for adverse outcomes in comparison with the simple assessment by F/P.
In consideration of various contradictive opinions of the clinical interpretation of PW and F/P, we hypothesized that more detailed classification based on the deviation of both PW and F/P using Z score may be useful to assess the risk of perinatal death in the Japanese general population. By using Japan Perinatal Registry Network database 2013, we classified the infants into 9 blocks based on the deviation of both PW and F/P Z score and compared the incident rate of perinatal death in each of the SFD vs. AFD vs. LFD groups.
Materials and methods
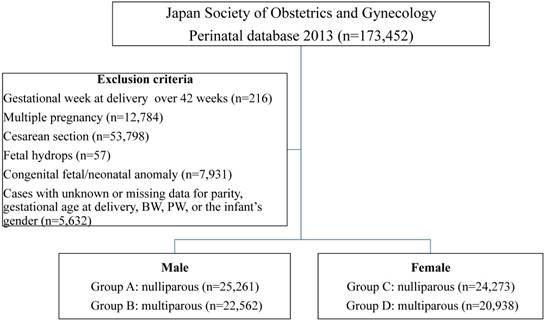
The study protocol was reviewed and approved by the Ethics Committee of International University of Health and Welfare. (Date of approval: 2015/02/14, reference number: 13-B-99) Individual data were collected from the Japan Perinatal Registry Network database 2013, which is managed by the Japan Society of Obstetrics and Gynecology. The characteristics of this database were previously reported [4, 13, 14]. The exclusion criteria included the following: gestational week at delivery over 42 weeks, multiple pregnancy, fetal hydrops, congenital fetal/neonatal anomaly, and cases with unknown or missing data for parity, gestational age at delivery, birth weight (BW), PW, or the infant's gender.
As described previously [4], after manually removing blood clots, the untrimmed placenta together with the membranes and umbilical cord was weighed by the midwife. In more detail, the placenta was weighed without drainage within 2 h after delivery using standardized scales of medical devise grade. In case of a fragmented placenta, all fragments were collected and weighed. The F/P was calculated by dividing the BW by the PW in grams, and was rounded off to three decimal places [9].
The neonatal growth chart (New Japanese neonatal anthropometric chart) in general use in Japan, published by Itabashi et al. in 2010 [15], was generated based on data from vaginal deliveries, as the BW of infants from cesarean deliveries was significantly lighter during the preterm period. Thus, in this study, the PW and F/P were analyzed only in placentas/infants delivered vaginally. The study population consisted of 93,034 placentas/infants from women who vaginally delivered a singleton infant between 22 and 41 weeks of gestation. Four sets of groups were constructed according to the infants' gender and the mothers' parity (nulliparous or multiparous): Group A: male, nulliparous (n=25,261), Group B: male, multiparous (n=22,562), Group C: female, nulliparous (n=24,273), and Group D: female, multiparous (n=20,938). (Figure 1)
Study flow chart
BW was classified into the following three groups, according to the above-mentioned neonatal growth chart [15]: SFD group (both BW and neonatal height less than the 10th percentile, n=3,379), AFD group (in the range of the 10th to 90th percentile, n=81,143) and HFD (over the 90th percentile, n=8,512) group. In the present study, we enrolled SFD neonates in consideration of their potential pathophysiological involvement of small composition and excluded the neonates with BW less than the 10th percentile and height of the 10th percentile and more.
The standard curves of the PW and F/P were constructed by the LMS method (described later) according to fetal gender (male or female) and maternal parity (nulliparous or multiparous), and were represented as the 10th, 50th, and 90th percentiles for every gestational week and day. The LMS method was used to calculate three sets of values for each gestational day: skewness (L), median (M), and coefficient of variation (S), using Box-Cox transformation [16]. Each Z score of the PW and F/P was then calculated by the formula; Z = [(sample data/M) L -1]/ (L x S).
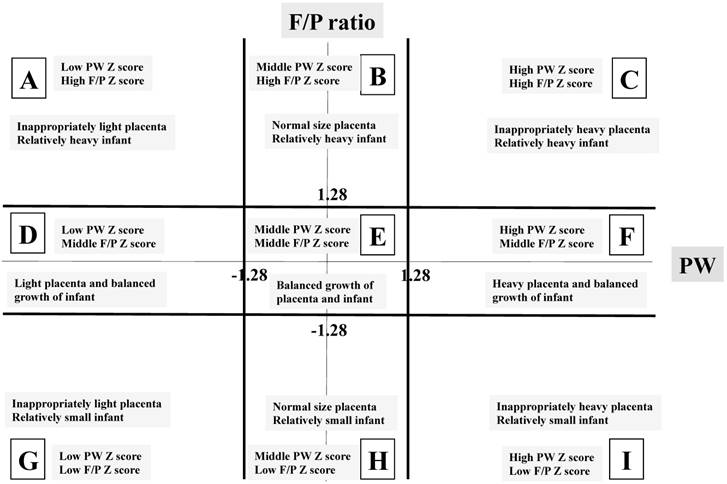
Because the 10th percentile and 90th percentile of data were considered to be almost equal to - 1.28 and 1.28 standard deviations (SD) of data and the Z score represents a marker of deviation from average, we classified study population into three groups as follows: low Z score group, less than -1.28 SD; middle Z score group, -1.27 to 1.27 SD; and high Z score group, over 1.28 SD. In order to clarify the importance of the PW and F/P, we investigated the relationships between the Z score of PW and that of F/P. As a result, the nine blocks shown in Figure 2 were made, and we labeled them as follows: block A, inappropriately light placenta, relatively heavy infant; block B, normal size placenta, relatively heavy infant; block C, inappropriately heavy placenta, relatively heavy infant; block D, light placenta, balanced growth of infant; block E, balanced growth of placenta and infant; block F, heavy placenta, balanced growth of infant; block G, inappropriately light placenta, relatively small infant; block H, normal size placenta, relatively small infant and block I, inappropriately heavy placenta, relatively small infant. Block E was considered a control for the other eight blocks.
Labels of the nine blocks made by placental weight (PW) and fetal/placental (F/P) Z scores. The X-axis represents the PW Z score focusing on scores of -1.28 SD and 1.28 SD. The Y-axis represents the F/P Z score focusing on scores of -1.28 SD and 1.28 SD.
Poor perinatal outcomes (cases) were defined as perinatal death consisting of intrauterine fetal death (IUFD) and neonatal death. We determined whether the characteristics, including perinatal death and gestational weeks at delivery, of each block differed among the SFD vs. AFD vs. LFD groups.
The results were expressed as the means ± SD or median (range). The statistical analyses were performed using the SAS 9.1 software program (SAS Institute, Cary, NC, USA). An analysis of variance for continuous variables, confirmed by Dunnet's method, and the chi-square test for categorical variables, confirmed by Dunnet's method, were used for the statistical analyses. A p-value <0.05 was considered significant.
Results
Table 1 shows the data of gestational weeks, BW, and fetal/infantile death according to the three groups (SFD, AFD, and HFD). Table 2 summarizes the data of gestational weeks and BW. The gestational weeks at delivery in four blocks (A, D, G and H) were significantly shorter than in block E in the SFD group. The gestational weeks at delivery in another four blocks (A, D, H and I) were significantly longer than in block E in the AFD group. However, only the gestational weeks at delivery in block F was significantly longer than in block E in the HFD group. (Table 2)
Clinical background in the present study
| SFD group: n=3,379 | ||||||||||
| Gestational weeks | Birth weight | IUFD | ND | |||||||
| Block | n | Mean±SD | Median (range) | Mean±SD | Median (range) | |||||
| A | 396 | 38.2±2.4 | 39(23-41) | 2224±422 | 2326(410-2857) | 19 (4.8%) | 0 (0) | |||
| D | 1,352 | 38.3±2.3 | 39(22-41) | 2206±397 | 2293(210-2858) | 32 (2.4%) | 8 (0.6%) | |||
| E | 1,270 | 38.6±2.1 | 39(22-41) | 2364±331 | 2435(286-2950) | 10 (0.8%) | 3 (0.2%) | |||
| G | 18 | 32.4±6.0 | 31.5(24-40) | 927±705 | 656(175-2016) | 10 (55.6%) | 1 (12.5%) | |||
| H | 333 | 37.5±4.0 | 39(22-41) | 2103±581 | 2285(208-2818) | 22 (6.6%) | 3 (1.0%) | |||
| I | 10 | 35.8±5.2 | 36.5(23-41) | 1897±720 | 2036(366-2594) | 1 (10%) | 0 (0) | |||
| AFD group: n=81,143 | ||||||||||
| Gestational weeks | Birth weight | IUFD | ND | |||||||
| Block | n | Mean±SD | Median (range) | Mean±SD | Median (range) | |||||
| A | 4,474 | 38.8±1.7 | 39(22-41) | 2843±322 | 2860(466-3772) | 23 (0.5%) | 0 (0) | |||
| B | 3,883 | 38.6±1.9 | 39(22-41) | 3115±357 | 3168(542-3882) | 15 (0.4%) | 2 (0.05%) | |||
| D | 1,427 | 38.9±1.7 | 39(23-41) | 2652±265 | 2694(541-3240) | 5 (0.4%) | 2 (0.14%) | |||
| E | 63,933 | 38.7±2.0 | 39(22-41) | 2961±386 | 2999(332-4170) | 143(0.2%) | 45 (0.1%) | |||
| F | 1,849 | 38.4±1.7 | 39(23-40) | 3252±316 | 3300(612-3844) | 2 (0.1%) | 0 (0) | |||
| H | 2,257 | 38.9±1.6 | 39(22-41) | 2797±279 | 2830(425-3478) | 7 (0.3%) | 1 (0.04%) | |||
| I | 3,320 | 38.7±2.0 | 39(22-41) | 3089±382 | 3142(434-4148) | 18 (0.5%) | 4 (0.12%) | |||
| HFD group: n=8,512 | ||||||||||
| Gestational weeks | Birth weight | IUFD | ND | |||||||
| Block | n | Mean±SD | Median (range) | Mean±SD | Median (range) | |||||
| A | 32 | 39.3±1.2 | 40(36-41) | 3675±238 | 3640(3162-4050) | 0 (0) | 0 (0) | |||
| B | 804 | 38.9±1.9 | 39(23-41) | 3610±388 | 3650(890-5154) | 3 (0.4%) | 0 (0) | |||
| E | 4,353 | 38.7±1.9 | 39(22-41) | 3556±362 | 3600(556-4650) | 9 (0.2%) | 1 (0.02%) | |||
| F | 2,707 | 38.9±1.6 | 39(25-41) | 3691±344 | 3694(861-5288) | 2 (0.1%) | 3 (0.1%) | |||
| I | 616 | 38.9±1.5 | 39(32-41) | 3630±289 | 3654(2336-4328) | 1 (0.2%) | 0 (0) | |||
IUFD: intrauterine fetal death, ND: neonatal death
Summary of the statistical differences: Comparisons of gestational age at delivery and birth weight in each block with 'block E' within the corresponding groups
| SFD group | AFD group | HFD group | ||||||||
|---|---|---|---|---|---|---|---|---|---|---|
| Gestational age | Birth weight | Gestational age | Birth weight | Gestational age | Birth weight | |||||
| Block | p | p | Block | p | p | Block | p | p | ||
| A | 0.04 | <.0001 | A | <.0001 | <.0001 | A | 0.069 | 0.1348 | ||
| D | 0.011 | <.0001 | B | 0.363 | <.0001 | B | 1 | <.0001 | ||
| G | <.0001 | <.0001 | D | <.0001 | <.0001 | F | 0.046 | <.0001 | ||
| H | 0.002 | <.0001 | F | 0.144 | <.0001 | I | 0.204 | <.0001 | ||
| I | 0.152 | 0.039 | H | <.0001 | <.0001 | |||||
| I | 0.003 | <.0001 |
SFD: small for date, AFD: appropriate for date, HFD: heavy for date
The BWs in all five blocks (A, D, G, H, and I) were significantly lighter than in block E in the SFD group. The BWs in three blocks (A, D and H) were significantly lighter and those in the remaining three blocks (B, F and I) were heavier than in block E in the AFD group. The BWs in three blocks (B, F and I) were significantly heavier than in block E in the HFD group.
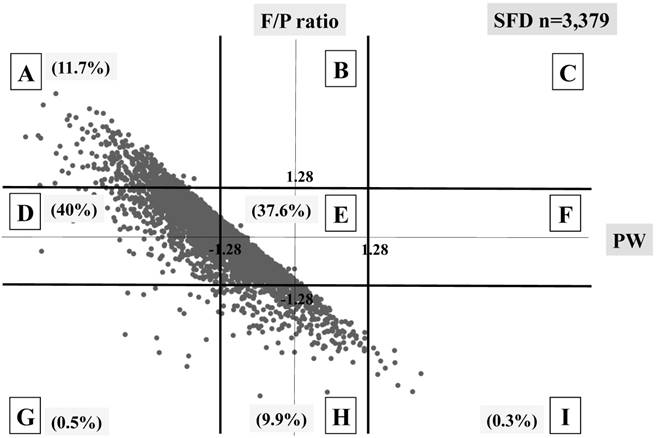
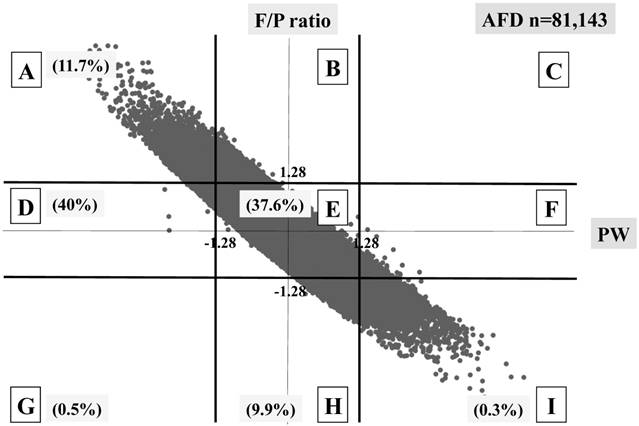
Three different distributional patterns were observed: six blocks (A, D, E, G, H and I) in the SFD group (Figure 3), seven blocks (A, B, D, E, F, H and I) in the AFD group (Figure 4), and five blocks (A, B, E, F and I) in the HFD group (Figure 5). As fetal body weight became bigger from the SFD group, the AFD group to the HFD groups, the graph of straight line showing the relationship between Z scores of PW and those of F/P moved from the left bottom part to the right top part (Figures 3-5).
Distribution of SFD infants (n=3,379) The percentage of each block is shown.
Distribution of AFD infants (n=81,143) The percentage of each block is shown.
Distribution of HFD infants (n=8,512) The percentage of each block is shown.
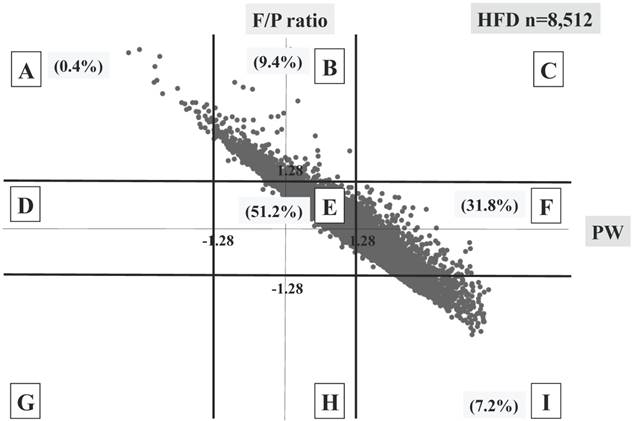
The proportions of block E were 37.6% in the SFD group, 78.8% in the AFD group, and 51.2% in the HFD group. There were many cases that deviated from block E in the SFD group. The proportion of block I (inappropriately heavy placenta) in the SFD group and that of block A (inappropriately light placenta) in the HFD group were 0.3% and 0.4%, respectively; these accounted for 4.1 and 5.5% in the AFD group, respectively. (Figures 3-5)
In total, perinatal death rates per 100 deliveries were observed in 3.2% (109/3,379) in the SFD group, 0.3% (267/81,143) in the AFD group, and 0.2% (19/8,512) in the HFD group. The perinatal death of block E was the lowest in both the SFD and the AFD groups, whereas there were no differences among five blocks in the HFD group. (Table 3) Although a statistical difference was not observed, possibly due to small sample size, the perinatal death in block I was markedly high (10%) in the SFD group.
p value of perinatal, intrauterine fetal, and neonatal deaths to block E in each block in the three groups
| SFD group | AFD group | HFD group | |||||||||||
|---|---|---|---|---|---|---|---|---|---|---|---|---|---|
| Block | PD | IUFD | ND | Block | PD | IUFD | ND | Block | PD | IUFD | ND | ||
| A | <0.001 | <0.001 | 0.96 | A | 0.042 | 0.001 | 0.3 | A | 1 | 1 | 1 | ||
| D | 0.02 | 0.056 | 0.49 | B | 0.45 | 0.22 | 1 | B | 0.84 | 0.69 | 1 | ||
| E | REF | REF | REF | D | 0.62 | 0.86 | 0.81 | E | REF | REF | REF | ||
| G | <0.001 | <0.001 | <0.01 | E | REF | REF | REF | F | 0.98 | 0.5 | 0.28 | ||
| H | <0.001 | <0.001 | 0.3 | F | 0.55 | 0.85 | 0.72 | I | 1 | 1 | 1 | ||
| I | 0.36 | 0.269 | 1 | H | 1 | 0.93 | 1 | ||||||
| I | 0.002 | 0.003 | 0.76 |
PD: perinatal death
IUFD: intrauterine fetal death
ND: neonatal death
REF: reference for other blocks
Contrary to the significant higher incidences of perinatal deaths in the blocks A, D, G, and H compared to block E in the SFD group, significant differences were observed between blocks A and E and between blocks I and E in the AFD group. These tendencies were almost the same in the cases of IUFD.
Discussion
Using a sex-, parity- and gestational-age-specific PW and F/P Z scores in Japanese vaginally-delivered singleton population, we made the following findings for the first time: (1) the distribution of 9 blocks, based on PW and F/P Z scores (3 x 3 = 9 blocks), differed among the SFD, AFD, and HFD group. (2) An 'inappropriately heavy placenta' in the SFD group and 'inappropriately light placenta' in the HFD were very rare. (3) Each block was related to perinatal death.
We believe that the F/P should be established in an individual population and updated. The secular trends in neonatal anthropometric measurements at birth are associated with changes not only in antenatal management and maternal age and size but also in socioeconomic or environmental conditions. Neonatal growth charts should therefore be updated to reflect these changes [17]. This may also hold true for the F/P. The major previous reports on F/P were from 1970's [18], 1980's [10] or 1990's [19, 20]. In addition, these reports have issues with ethnicities (multiracialities), and, thus, studies on the F/P in single ethnicity populations are needed. Fortunately, more than 95% of the present study population consisted of single ethnicity (Japanese), so these present data overcame the issue of heterogeneous ethnicities in previous studies. While other reports have described the F/P of Japanese population, these values were derived from a small sample size (n=3,434) at a single institute [21]. We believe that the present data, at least in part, provided fundamental data of F/P of a single ethnicity based on a large sample size.
The fact that the 'inappropriately heavy placenta' (block I) and 'inappropriately light placenta' (block A) exist even among AFD infants suggests that the compensatory mechanism of placental growth may work according to fetal growth: that is, F/P is well controlled as far as within normal range. However, HFD with inappropriately light placenta and SFD with inappropriately heavy placenta were very rare. “SFD with inappropriately heavy placenta” may indicate a relatively inefficient placental ability to maintain fetal growth [22]. This rarity may indicate the presence of an unknown placental disorder in which compensatory control system does not work well, leading to “large placenta but small infant”.
McNamara et al. [3] analyzed the Z score in complicated pregnancy and showed that the Z score was able to predict maternal complications, such as chronic hypertension or preexisting diabetes. In the present study, the block-classifications based on both the PW and F/P Z scores were well correlated with fetal/neonatal death.
This study has some limitations. First, the study population was limited to vaginally delivered placentas/infants, excluding those abdominally delivered; despite the latter being more frequently associated with adverse perinatal outcomes, we did not provide data on this clinically significant fraction. Second, the present data were mainly obtained from secondary and tertiary obstetric institutes and may therefore not represent the entire Japanese population.
It would be further interesting study to investigate the relationship between each block (group) and maternal risk factors such as smoking habit, diabetes or hypertension in pregnancy and, to apply the 9-block categorization to retrospective reanalysis of the ongoing birth cohort in search of predictive factors of long-term developmental prognosis of the offspring.
Conclusions
By showing the fact that perinatal death was lowest in cases with balanced fetal/ placental growth, we conclude that 9-block categorization of PW and F/P based on deviation in the Z-score may be a candidate factor employable for understanding fetal and placental growth and perinatal deaths.
Abbreviations
PW: placental weight; BW: birth weight; F/P: fetal/placental weight ratio; SFD: small for date; AFD: appropriate for date; HFD: heavy for date; IUFD: intrauterine fetal death; DOHaD: developmental origins of health and disease.
Acknowledgements
We thank Mr. Norio Sugimoto for his statistical help. This work was supported in part by Grants-in-Aid for Scientific Research from the Ministry of Education, Science, Culture and Sports of Japan (Nos. 15H04882 and 16K15703).
Competing Interests
The authors have declared that no competing interest exists.
References
1. Silasi M, Cohen B, Karumanchi SA, Rana S. Abnormal placentation, angiogenic factors, and the pathogenesis of preeclampsia. Obstet Gynecol Clin North Am. 2010;37:239-53
2. Ness RB, Bass D, Hill L, Klebanoff MA, Zhang J. Diagnostic test characteristics of placental weight in the prediction of small-for-gestational-age neonates. The Journal of reproductive medicine. 2007;52:793-800
3. McNamara H, Hutcheon JA, Platt RW, Benjamin A, Kramer MS. Risk factors for high and low placental weight. Paediatric and perinatal epidemiology. 2014;28:97-105
4. Matsuda Y, Ogawa M, Nakai A, Hayashi M, Satoh S, Matsubara S. Fetal/Placental weight ratio in term Japanese pregnancy: its difference among gender, parity, and infant growth. International journal of medical sciences. 2015;12:301-5
5. Hutcheon JA, McNamara H, Platt RW, Benjamin A, Kramer MS. Placental weight for gestational age and adverse perinatal outcomes. Obstetrics and gynecology. 2012;119:1251-8
6. Risnes KR, Romundstad PR, Nilsen TI, Eskild A, Vatten LJ. Placental weight relative to birth weight and long-term cardiovascular mortality: findings from a cohort of 31,307 men and women. American journal of epidemiology. 2009;170:622-31
7. Almog B, Shehata F, Aljabri S, Levin I, Shalom-Paz E, Shrim A. Placenta weight percentile curves for singleton and twins deliveries. Placenta. 2011;32:58-62
8. Wallace JM, Bhattacharya S, Horgan GW. Gestational age, gender and parity specific centile charts for placental weight for singleton deliveries in Aberdeen, UK. Placenta. 2013;34:269-74
9. Ogawa M, Matsuda Y, Nakai A, Hayashi M, Sato S, Matsubara S. Standard curves of placental weight and fetal/placental weight ratio in Japanese population: difference according to the delivery mode, fetal sex, or maternal parity. European journal of obstetrics, gynecology, and reproductive biology. 2016;206:225-31
10. Naeye RL. Do placental weights have clinical significance? Human pathology. 1987;18:387-91
11. Bonds DR, Gabbe SG, Kumar S, Taylor T. Fetal weight/placental weight ratio and perinatal outcome. American journal of obstetrics and gynecology. 1984;149:195-200
12. Eskild A, Romundstad PR, Vatten LJ. Placental weight and birthweight: does the association differ between pregnancies with and without preeclampsia? American journal of obstetrics and gynecology. 2009;201:595.e1-5
13. Matsuda Y, Hayashi K, Shiozaki A, Kawamichi Y, Satoh S, Saito S. Comparison of risk factors for placental abruption and placenta previa: case-cohort study. The journal of obstetrics and gynaecology research. 2011;37:538-46
14. Hayashi M, Nakai A, Satoh S, Matsuda Y. Adverse obstetric and perinatal outcomes of singleton pregnancies may be related to maternal factors associated with infertility rather than the type of assisted reproductive technology procedure used. Fertility and sterility. 2012;98:922-8
15. Itabashi K, Miura F, Uehara R, Nakamura Y. New Japanese neonatal anthropometric charts for gestational age at birth. Pediatrics international: official journal of the Japan Pediatric Society. 2014;56:702-8
16. Cole TJ. Using the LMS method to measure skewness in the NCHS and Dutch National height standards. Annals of human biology. 1989;16:407-19
17. Bertino E, Spada E, Occhi L, Coscia A, Giuliani F, Gagliardi L. et al. Neonatal anthropometric charts: the Italian neonatal study compared with other European studies. Journal of pediatric gastroenterology and nutrition. 2010;51:353-61
18. Molteni RA, Stys SJ, Battaglia FC. Relationship of fetal and placental weight in human beings: fetal/placental weight ratios at various gestational ages and birth weight distributions. The Journal of reproductive medicine. 1978;21:327-34
19. Godfrey KM, Redman CW, Barker DJ, Osmond C. The effect of maternal anaemia and iron deficiency on the ratio of fetal weight to placental weight. British journal of obstetrics and gynaecology. 1991;98:886-91
20. Lao TT, Wong W. The neonatal implications of a high placental ratio in small-for-gestational age infants. Placenta. 1999;20:723-6
21. Hasegawa J, Arakawa K, Nakamura M, Matsuoka R, Ichizuka K, Katsufumi O. et al. Analysis of placental weight centiles is useful to estimate cause of fetal growth restriction. The journal of obstetrics and gynaecology research. 2011;37:1658-65
22. Salafia CM, Charles AK, Maas EM. Placenta and fetal growth restriction. Clinical obstetrics and gynecology. 2006;49:236-56
Author contact
![]() Corresponding authors: Yoshio Matsuda, M.D., Ph.D., Director, Japan Community Health Care Organization (JCHO) Mishima General Hospital, 2276 Yata Aza Fujikubo, Mishima- City, Shizuoka 411-0801 JAPAN. Tel: +81-55-975-3031 (ext. 2843); Fax: +81-55-973-3647; E-mail: yoshiom2979com and Hiroaki Itoh, M.D., D.Med.Sci., Professor, Department of Obstetrics and Gynecology, Hamamatsu University School of Medicine, 1-20-1 Handayama, Higashi-ku, Hamamatsu 431-3192, Japan. Tel: +81-53-435-2309; Fax: +81-53-435-2308; e-mail: hitou-endoac.jp
Corresponding authors: Yoshio Matsuda, M.D., Ph.D., Director, Japan Community Health Care Organization (JCHO) Mishima General Hospital, 2276 Yata Aza Fujikubo, Mishima- City, Shizuoka 411-0801 JAPAN. Tel: +81-55-975-3031 (ext. 2843); Fax: +81-55-973-3647; E-mail: yoshiom2979com and Hiroaki Itoh, M.D., D.Med.Sci., Professor, Department of Obstetrics and Gynecology, Hamamatsu University School of Medicine, 1-20-1 Handayama, Higashi-ku, Hamamatsu 431-3192, Japan. Tel: +81-53-435-2309; Fax: +81-53-435-2308; e-mail: hitou-endoac.jp