Impact Factor ISSN: 1449-1907

 Global reach, higher impact
Int J Med Sci 2018; 15(2):161-169. doi:10.7150/ijms.21665 This issue Cite
Research Paper
Assessment of the Temporomandibular Joint Function in Young Adults without Complaints from the Masticatory System
Wojciech Kondrat1, Teresa Sierpińska1 ![]() , John Radke2
, John Radke2
1. Department of Prosthetic Dentistry , Medical University of Białystok, M. Skłodowskiej-Curie 24A, 15-276 Białystok;
2. Bioresearch Associates (JVA, Bioresearch Assoc., Milwaukee, WI, USA).
Received 2017-6-28; Accepted 2017-11-2; Published 2018-1-1
Abstract
Objective of the study was to evaluate the clinical status of the masticatory system in young adults with full permanent dentition and no stomatognathic system complaints. The study involved 186 randomly selected people with full dental arches with normal occlusal conditions corresponding to Angle's Class I aged 18 - 21 years with an average age of 19 years. Subjects were clinically examined and temporomandibular joint (TMJ) vibrations were recorded during open-wide and close movements using BioJVA. Then, patients were categorized into groups according to Piper's classification system. The TMJs of the subjects were categorized according to the values of the vibration energy and the Piper protocol. This detected 33.4% of the joints with loosened ligaments, subluxation in 8.28%, initial signs of disc dysfunction in 5.08% and disc displacement without locking in 1.6 %. Median frequency differed significantly (p < 0.05) between the group of subjects with initial signs of TMJ dysfunction and other groups. Peak Frequency differed significantly (p < 0.05) between the healthy joints and those with TMJ subluxation. In this group of young healthy people, the majority of study joints generated small vibrations. However, a subset of people manifested higher vibrations that may indicate an early stage of TMJ dysfunction. Median Frequency was an important parameter for detecting initial symptoms of TMJ dysfunction. Peak Frequency was an important characteristic parameter for detecting TMJ subluxation.
Keywords: masticatory system, joint vibration analysis, TMJ diagnostics.
Introduction
The most common reasons for visits to the dental office are dental caries, periodontal problems or the loss of teeth [1]. Most patients do not report dysfunctions of the masticatory system (temporomandibular joints and masticatory muscles). Small abnormalities in the function of the masticatory system initiate morphological and/or functional adaptations, so patients are able to function without pain. Patients undergoing a general dental examination, with no obvious masticatory system signs or symptoms of temporomandibular disorders (TMD), are not usually diagnosed as having even minor dysfunctions of the temporomandibular joints or masticatory muscles. Therefore, the early stages of a disorder may go undiagnosed and remain untreated. According to Jensen & Ruf studies [2] almost every third subjects with subclinical TMD developed clinical TMD over a 2.4- year period. They also emphasize that it would be deliberate to carry out systematic TMJ-screening in all adult patients prior to orthodontic treatment, in order to identify patients at risk. Over a lifetime, our adaptive capacities change under the influence of individual and external factors, such as general health, age, and living conditions [3]. The reduction of the compensatory mechanisms can lead to measureable locomotor masticatory system dysfunctions. McNeill [4] states that approximately 75% of the population may experience one of the many signs of masticatory dysfunction. Other authors also recognize the frequent occurrence of masticatory system dysfunction even in very young people [5, 6]. In order to detect existing anomalies in the masticatory organ, it is necessary to have broad clinical experience. A carefully conducted clinical examination is critically important, but does not allow for detection of all abnormalities. Brown [7] suggests that the clinical examination and history questionnaire used during the evaluation of TMD patients are less accurate evaluating asymptomatic subjects than when combined with computerized joint vibration analysis. The use of modern instrumentation and methods in the examination of patients allows for an easy, fast and non-invasive detection of small abnormalities in the motor function of the masticatory system, enabling early preventive and therapeutic measures, which are of great importance in efficient medical treatment [8-13]. The most accurate and complete diagnosis possible can only help the clinician to develop an effective treatment plan. Vibration analysis of the TMJ could be clinically useful as a screening examination for TMD patients. JVA (Joint Vibration Analysis) can not only detect an internal derangement, but since it is a dynamic test, it can also evaluate how well adapted it is. This allows the clinician to recognize a well-adapted internal derangement that does not require treatment (avoiding unnecessary treatment). Using the total vibration energy as a threshold, the diagnostic sensitivity for the abnormal joints is around 82%, while the diagnostic specificity for the joints with no evidence of internal derangement is around 75% [14]. At the same time, 98.3% of the asymptomatic volunteers with bilateral normal TMJ computerized tomography (CT) scanning was involved below the threshold [13].
Study objective
Considering that young healthy adults with full natural dentition usually did not report any complaints from temporomandibular joints the main objective was to collect normative data from the stomatognathic system using joint vibration analysis (JVA) and to find the differences between males and females.
Methodology
The studies were conducted on a group of young people attending secondary schools and students of the first year studies in the Medical University. The information regarding the research was presented to the governments and parents of five high schools, so around 1500 young persons were informed and taken into consideration when planning the research. Finally, the study involved 186 people - 98 females and 88 males in the average age of 19 years. They met the following:
Inclusion criteria:
1) full dental arches with normal occlusive conditions corresponding to Angle's Class I;
2) at least one year from the end of orthodontic treatment;
3) general good health.
Exclusion criteria:
1) missing teeth (congenital and acquired);
2) undergoing or recently completed orthodontic treatment;
3) previous craniofacial surgery and/or injuries;
4) reporting clear symptoms of the functional disorders of the masticatory system.
Data were collected in the Department of Prosthetic Dentistry and the protocol conformed to the criteria of The Helsinki Declaration, ICH Guideline for Good Clinical Practice, and approved by the Local Ethical Committee with an approval number of KBET/89B/2009. The participants were recruited into the study after obtaining consent from educational authorities, school headmasters, parents, and participants themselves.
The clinical examinations were conducted and took into account the inclusion criteria of joint disorders by Dworkin and Leresche [15]. The study card consisted of four parts: personal data, general medical history, specialist history and basic clinical examination. General medical history contained questions about the health of the subjects i.e. past or existing infections, allergies, diseases of the cardiovascular, respiratory, gastrointestinal, genitourinary, neurological, hormonal disorders or psychological problems. The specialist history concerned dental diseases, in particular any difficulty chewing, speaking, obtaining proper occlusion of the teeth, hypersensitivity of the teeth, pain or acoustic phenomena in the temporomandibular joints when opening, incising or yawning, the presence of headaches and/or bad posture. The clinical examination included enhanced focus on the muscles and temporomandibular joints. The intra-oral and extra-oral examination covered the muscles of the head, neck, shoulders, temporal muscles, masseters, all pterygoids, mylohyoids, digastrics, suprahyoids, infrahyoids and sternocleidomastoids. It also included inspection for tumors of the jaw, tongue, larynx and the base of the temporomandibular ligament.
The vibrational analysis of the temporomandibular joints was carried out using the BioJVA and the BioPAKTM computer program (BioResearch Associates, Inc. Milwaukee WI USA). Before carrying out the tests using BioJVA, the patients were informed about the process and trained in the exact maximum unassisted wide opening and closing of the mouth following the metronome on the computer screen. The skin around the temporomandibular joints and recording sensors were rubbed before each test using a swab with alcohol to remove layers of dirt, make-up and to improve the accuracy of the measurements. The accelerometers were placed on the patient's head directly over both TMJs so that they were located evenly from the centre of the head. During tests the patient maintained a good resting posture, i.e. sat upright and looked straight ahead. The vibration recording procedure was preceded by measuring the exact maximum range of mouth opening of each patient with a ruler (in mm) between the incisal edges of the upper and lower central incisors. This data was then entered into the program to allow an estimate of the location of each registered vibration. Recordings of the right and left TMJ vibrations were drawn on the computer screen in real time as acoustic waveform graphs, presented as the relationship between vibration amplitude and time. The recording lasted for ten seconds and included six complete cycles of the opening and closing of the mouth. Individual vibrations were detected automatically by the computer program and verified by a doctor.
The study was performed always on the same days of the week (Tuesday & Wednesday) and at the same time (between 8:00 AM and 12:00 PM). The examinations were performed under the same conditions (the same room, the same dental chair, the same patient's position on the dental chair without additional lightning), and all conducted by the same person.
Because the diagnosis using BioJVA is based on the model of diagnosis according to the Piper classification, that was constructed on the basis of MRI findings [16], the examined temporomandibular joints were divided into 5 groups, on the basis of the nature of the registered vibrational energy and the range of opening motion.
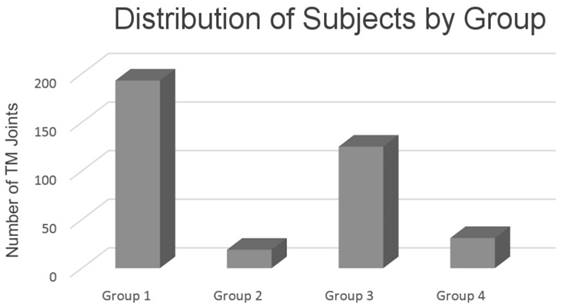
Group 1- diagnosis according to Piper - 1 - a group of completely healthy joints; n = 193 joints
Group 2- diagnosis according to Piper - 3b - a group of people with subclinical signs of a (partial) lateral pole displacement of the TMJ disk, non-reducing with permanently stretched ligaments; n = 19 joints.
Group 3 - diagnosis according to Piper - 3a - Ligament Laxity - a group of people with loose articular ligaments or a reducing partial disk displacement off of only the lateral pole; (n = 125).
Group 4 - diagnosis according to Piper - TMJ subluxation/eminence click; n = 31 joints.
Group 5 - diagnosis according to Piper - 4a- chronic complete disc displacement with reduction; n = 6 joints.
Given that the group 5 included a small number of joints (n = 6), “n” was too small to carry out a statistical analysis, thus Group 5 was not included in this analysis.
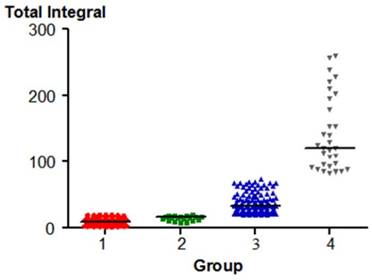
All TMJs were divided into the four groups based on; 1) the recorded Total Integrated intensity of the vibrations in Pascals x Hertz (PaHz) and 2) the maximum range of opening of their mouth (ROM) in millimeters. These were the primary parameters utilized. Secondarily, a further division took into account: 1) the Integral > 300 Hz (the integrated intensity of all of the vibration components with frequencies above 300 Hz), 2) the Ratio of the > 300 Hz/ < 300 Hz (the ratio of the above 300 Hz intensity to the below 300 Hz intensity). The procedure followed the classification of TMJ disorders according to Mark Piper [16]. Other parameters such as Integral < 300 (the integrated intensity of just frequencies below 300 Hz), Peak Amplitude (the absolute intensity of the peak frequency), Peak Frequency (the frequency with the highest intensity) and Median Frequency (a centroid of the integrated intensity of the frequency distribution) were not taken into account when dividing joints into the 4 groups (Fig.1).
Distribution of subjects by group according to the Piper classification
Statistical analysis was performed using nonparametric tests, because the distribution of individual parameters differed from a normal distribution (Shapiro-Wilk test). The following values were given in quantitative variables: mean, median and standard deviation. The comparison of various quantitative characteristics in all patients was performed using the Mann-Whitney U test. The analysis was performed using Statistica 10.0 (StatSoft Inc., USA) and Prism. Alpha was selected at 0.05.
Results
The most common findings of the masticatory system in patients without complaints were presented in Table 1. It is worthy to point out that some symptoms of temporomandibular disorders were found during clinical examination even if not reported when the dental history had been collected.
The summary of the most common findings of the stomatognathic system in patients without initial symptoms of masticatory system dysfunction.
| Description of symptoms in the study group | Number | % |
|---|---|---|
| Headaches | 43 | 23 |
| Pain during wide-open mouth, biting off or yawning | 28 | 15 |
| Muscle aches | 26 | 14 |
| Acoustic phenomena in the temporomandibular joints | 22 | 11.8 |
| Gnashing or clenching teeth | 19 | 10.2 |
| Tooth hypersensitivity | 18 | 9.6 |
| Pain in the temporomandibular joints | 17 | 9.1 |
| Pain in the head, neck or neck | 15 | 8.0 |
Table 2 is a summary of the BioJVA analysis parameters in groups divided based on the Mark Piper classification. Statistical analysis using a multiple comparison test revealed differences in the parameters between groups. It confirmed the correct assignment to each group based on the vibration parameters.
The summary of BioJVA analysis parameters in this clinically healthy group subdivided based upon the Mark Piper classifications.
| All Integrals have units expressed in Pascals x Hertz (PaHz) | Group 1; n=193 | Group 2; n=19 | Group 3; n=125 | Group 4; n=31 | ||||
|---|---|---|---|---|---|---|---|---|
| Mean Piper 1 standard deviation | Median | Mean Piper 3b standard deviation | Median | Mean Piper 3a standard deviation | Median | Mean Eminence click standard deviation | Median | |
| Total Integral | 10.11 ±5.04 | 9.60 | 14.67 ±3.54 | 16.10 | 36.71 ±14.66 | 32.60 | 142.62 ±56.71 | 121.60 |
| Integral < 300 Hz | 9.00 ±4.82 | 8.40 | 10.10 ±3.15 | 10.20 | 33.55 ±13.65 | 30.10 | 132.70 ±52.51 | 113.70 |
| Integral > 300 Hz | 1.11 ±0.69 | 0.90 | 4.58 ±1.71 | 3.90 | 3.15 ±2.74 | 2.30 | 9.91 ±10.69 | 4.90 |
| Ratio: > 300 Hz to < 300 Hz | 0.16 ±0.11 | 0.13 | 0.50 ±0.25 | 0.42 | 0.10 ±0.09 | 0.07 | 0.07 ±0.07 | 0.05 |
| Peak Amplitude | 1.36 ±1.00 | 1.10 | 0.86 ±0.43 | 0.80 | 4.83 ±2.82 | 3.90 | 17.60 ±8.16 | 16.20 |
| Peak Frequency | 35.90 ±21.53 | 29.00 | 120.89 ±169.04 | 41.00 | 44.50 ±33.19 | 29.00 | 50.68 ±31.25 | 33.00 |
| Median Frequency | 83.15 ±40.26 | 72.00 | 189.79 ±61.49 | 173.00 | 83.30 ±42.72 | 68.00 | 82.16 ±29.41 | 80.00 |
The total integral differed significantly between all pairs of groups, except for Group 1 (healthy joints) compared to Group 2 (a group of people with only pre-clinical signs of TMJ dysfunction, but without symptoms). All of the p values were < 0.05 except for between groups 1 & 2.
All TMJs were divided based on the ranges of vibrational energy. The TMJs were qualified to the groups 1 and 2 based on recorded vibratory Total Integral of 0-20 PaHz following the vibrational energy classification scheme by Mark Piper. Other criteria included the remaining parameters of the vibrational energy. Statistical analysis results confirm the correct assignment of Total Integral to each group. The distribution of the parameters is shown in Fig. 1.
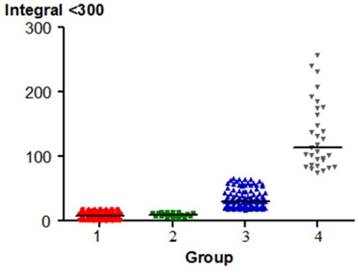
Integral < 300 Hz varied significantly between pairs of groups, except for Group 1 (healthy joints) and Group 2 (a group of people with only pre-clinical signs of TMJ dysfunction). In group 4 (TMJ subluxation) the parameter was highest. The p value was < 0.05 (except 1 & 2).
The distribution of the parameter is shown in Fig. 2.
The distribution of Total Integral in each group (p < 0.05) except for 1 & 2.
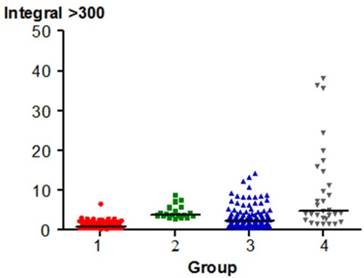
Integral > 300 varied significantly between pairs of groups, with the exception of group 1, 2 and 3 (a group of people with only pre-clinical signs of TMJ dysfunction) and 4 (TMJ subluxation). The p value was < 0.05 except for the relationship between groups 2 & 4.
The distribution of the parameter is shown in Fig. 3.
The distribution of Integral < 300 Hz between each group (p < 0.05) except 1 & 2.
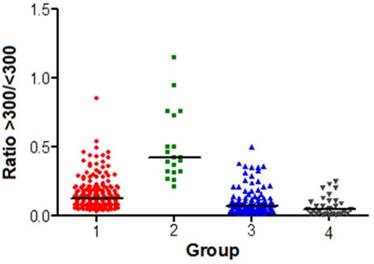
The Ratio: > 300 Hz / < 300 Hz varied significantly between pairs of groups, except for the comparison between Groups 3 and 4. The p value was < 0.05.The distribution of the parameter is shown in Fig. 4.
The distribution of the Integral > 300 Hz in each group
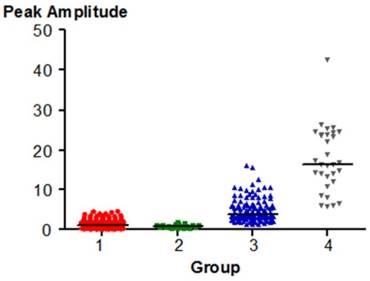
Peak Amplitude varied significantly between pairs of groups, except for Group 1 (healthy joints) and 2 (the group of people with only pre-clinical signs of TMJ dysfunction). The p value was < 0.05. Higher Peak Amplitude values are typical of Groups 3 and 4. The distribution of the parameter is shown in Fig. 5
The distribution of the Ratio > 300 Hz / < 300 Hz in each group
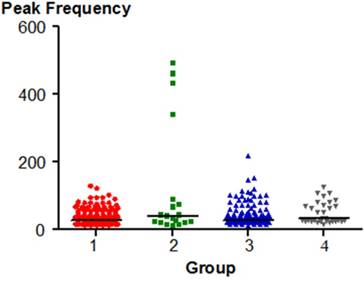
Peak Frequency significantly differed between the group 1 (healthy joints) and the group 4 (TMJ subluxation). The p value was < 0.05. The distribution of the parameter is shown in Fig. 6.
The distribution of Peak Amplitude in each group.
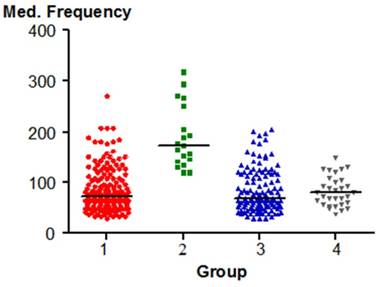
Median Frequency is significantly different between the group 2 (a group of people with only pre-clinical signs of TMJ dysfunction) and other groups (1, 3, 4). The p value was < 0.05. This parameter of vibrational energy may be a characteristic of the joints qualified to the group 2.
The distribution of the parameter in shown in Fig.7
Peak Frequency distribution in each group.
Distribution of the studied parameters between women and men are shown in Table 3. Maximal range of opening for women was registered between 37-64 mm but for men it was between 38-70 mm. The mean differences between sexes were 3.24 mm and they were statisticaly significant (p=.000). Any other joint vibration analysis parameters did not statistically differ between sexes.
The summary of BioJVA analysis parameters in women and men.
| All Integrals have units expressed in Pascals x Hertz (PaHz) | Women (98) | Men (88) | |||
|---|---|---|---|---|---|
| Mean standard deviation | Median | Mean standard deviation | Median | ||
| Max opening (mm) | 52.48 ± 6.10* | 53,00 | 55.72 ± 6.31 | 55.00 | |
| Total Integral | 39.02 ± 63.97 | 16.35 | 39.02 ±67.92 | 19.45 | |
| Integral < 300 Hz | 31.33 ±54.83 | 14.15 | 35.86 ± 63.41 | 18.05 | |
| Integral > 300 Hz | 3.77 ±10.75 | 1.40 | 3.17 ±6.17 | 1.40 | |
| Ratio: > 300 Hz to < 300 Hz | 0.16 ±0.15 | 0.11 | 0.14 ± 0.14 | 0.09 | |
| Peak Amplitude | 3.96 ±5.82 | 2.00 | 4.85 ±7.53 | 2.30 | |
| Peak Frequency | 47.24 ± 56.65 | 29.00 | 42.31 ± 40.23 | 33.00 | |
| Median Frequency | 91.98 ± 50.18 | 76.00 | 86.06 ± 44.83 | 72.00 | |
* statistically important difference between women and men, p<0.05
The distribution of Median Frequency in the individual groups.
Discussion
According to the assumptions of the study, the examination on a group of 186 students was performed among school students aged 18-21. The students were generally healthy, with full dental arches and normal appearing occlusal conditions. The inclusion and exclusion criteria were defined so that, as much as possible, they excluded any influence by local factors (e.g. the lack of teeth, occlusion disorders, etc.) or systemic disease that could affect the function of the stomatognathic system.
Numerous clinical studies have shown that developing a diagnosis utilizing BioJVA allows for detection of the locomotor masticatory system dysfunction, even in patients in whom a medical examination does not indicate any signs and the patient has no symptoms [8-13]. By using parameters of TMJ vibration energy analysis, a separation may be made between patients with normal joint anatomy and internal derangement [11, 16]. This fact was the main reason for choosing the present research methods.
The examinations reported loose joint ligaments in 33.4%. The ligaments are made up of collagen fibres of the predetermined length, so they are not elastic, and therefore they are not amenable to physiological stretching and then contracting. If high forces are exerted on the joint structures once or for a long time, the ligaments become permanently extended and damaged. This condition can lead to changes in the function of the joint and cause pathological processes to occur [17]. Subluxation was found in 8.28% of all joints. It is frequently described in the literature as hypermobility of the joints. Even if, subluxation can be diagnosed clinically based on history with a validity of 0.98 sensitivity and 1.00 specificity all the subjects were diagnosed by electrovibratography, so we received additional confirmation of the clinical findings [18]. There were no other problems of the locomotor masticatory system in these subjects. In subluxation, during the opening of the mouth near wide opening, there is an erratic motion with a slight displacement of the condyle just before full opening of the jaws. Typically, the range of opening motion is extended. The joints have a specific structure, which is characterized by the presence of the articular eminence with a short and steep posterior slope and the long frontal slope [17]. It is the condyle passing beyond the eminence that produces the subluxation. In 5.08%, that initial symptom of the joint dysfunction was present and disc displacement with reduction occurred in 1.6% of TMJs.
All the groups were first divided based on the value of Total Integral. Given that this parameter was a major characteristic distinguishing various groups, with the exception of the group with normal joints (group 1) and a group of subjects with only early signs of dysfunction (group 2), there were statistically significant differences (p < 0.05) among all other comparisons of groups. This suggests the correct division of patients into groups.
Integral of all frequencies below 300 Hz was significantly different (p < 0.05) between pairs of groups, except for Group 1 and Group 2. In Group 1, this parameter reached the lowest value averaging 9.0 PaHz, with only a small difference compared to Group 2, wherein the mean value was 10.1 PaHz. The parameter reached higher values in patients with loose ligaments and averaged 33.6 PaHz. In the group of patients with subluxation, the parameter reached the highest values, averaging 132.7 PaHz. The literature contains reports that the high value of Integral < 300 may be associated with an increased mobility of the joint as a result of loose and stretched joint ligaments, which allows hypermobility of the articular disc [19-27]. In asymptomatic women, Gupta et al observed the vibration energy < 300 Hz at a level of 9.2 PaHz [26]. This value is similar to that recorded in the group of healthy subjects in this study. The same author, however, registered a significantly lower amount of energy < 300 Hz in asymptomatic men (7.2 Hz), which supports the concept of a greater mobility of the articular discs, loosening of the TMJ joint capsule and generally less durable articular ligaments in women. Large amounts of vibrations in < 300 Hz integral were also noticed in numerous studies in patients with reducing displacements of the articular disc [20, 22, 25, 27]. In partial displacement of the articular disc without locking, (Group 3), this parameter achieved values between 20 - 70 PaHz, and in complete displacement of the articular disc with reduction, (Group 5), 80 - 500 PaHz [27].
The Integral value > 300 was significantly different (p < 0.05) between pairs of the groups, except for Groups 3 (partial TMJ dislocations) and 2 (a group of subjects with early signs of dysfunction). In the group of healthy individuals (Group 1), this parameter reached the lowest mean of 1.11 PaHz. In the group of patients with loose articular ligaments and the initial TMJ dysfunction, the mean values were similar and amounted to 3.15 PaHz and 4.58 PaHz (p > 0.05). The greatest intensity of vibrations > 300 Hz was found in the group with subluxation, (Group 4), where the mean values amounted to 9.91 PaHz. The large amount of vibrations above 300 Hz can be linked by numerous authors to the presence of degenerative changes within the TMJ [12, 19- 21, 24, 27]. The values recorded in the studies are not large and suggest that only slight degenerative TMJ changes were present when joints with mild disabilities were tested. Higher values of > 300 Hz in patients with subluxation can be explained by additional harmonic content of the high amplitude impact vibrations that occurred as the condyle passed under the eminence.
In all of the JVA recordings, the patients had a smaller amount of vibrations > 300 Hz, than below 300 Hz. The presence of small vibrations of low intensity suggests only minor disturbances within the TMJ. Similar results were obtained by Olivieri and Garcia in the study of 29 students without symptoms of TMJ dysfunction [23].
The ratio of the vibrations > 300 Hz compared to the vibrations < 300 Hz (Ratio: >300Hz / <300Hz) differed significantly between pairs of the groups (p < 0.05), except for the group with loose articular ligaments or subluxation (Groups 3 & 4), where the parameter mean values were 0.10 and 0.07. The highest ratio was recorded in patients with initial signs in the TMJ dysfunction (group 2), where the mean value of the ratio was 0.50. This confirms in this group the presence of vibrations with higher frequencies, a suggestion of some very slight degeneration. The ratio was at 0.16 in the group of totally healthy subjects.
The peak amplitude is the value in Pascals (Pa) of the highest intensity anywhere within the distribution of vibration frequencies from the recorded TMJ. The mean value obtained in studies of the healthy controls (Group 1) was 1.36. Similar values of peak amplitude in people without TMJ symptoms can be found in the literature of other authors [28-31]. Examining young patients, Kecik et al. received a value of 0.1 to 1.5 Pa [30]. Slightly lower values were reported by Rodrigues et al. [31] who registered in healthy subjects the range from 0.38 to 1.06 Pa. Christensen recorded values reaching 1 Pa [29]. Garcia et al. recorded in their studies the smaller range from 0.22 to 0.51 Pa [32]. The value was 0.86 Pa in patients with mild TMJ disorders, it was 4.83 Pa in subjects with loose ligaments, while in patients with subluxation the values were the greatest and averaged 17.60 Pa. Statistically significant differences (p < 0.05) were observed between all groups, except for the group of healthy patients (Group 1) and those with mild TMD (Group 2), where the values were small. In the literature, in patients with TMJ dysfunction symptoms the peak amplitude was up to 8.4 Pa and in TMJ inflammation, these values ranged from 0.35 to 3.96 Pa [30]. Rodrigues et al., who studied patients with TMJ diseases, obtained the level from 1.97 to 3.71 Pa [31].
Peak frequency of the vibratory wave is used to evaluate the frequency with the largest amount of vibration energy. It is measured in units of Hertz. Peak frequency significantly differs (p = 0.008) between the joints of healthy persons and a group with subluxation. In the group of healthy individuals, this parameter reached the lowest average value of 35.90 Hz. In the group of people with loose ligaments and subluxation, it amounted to an average of 44.50 and 50.68 Hz. The highest values of the peak frequency were observed in patients with mild TMJ disorders, and reached an average of 120.89 Hz. In the literature, in patients without TMJ disturbances, the value reached about 37.5 Hz [30] similar to the results of this study.
Other authors analyzed vibrations using the SonoPak device in healthy patients asymptomatic with respect to TMJ dysfunctions and found median frequencies between 56 and 99 Hz [23]. In other reports, the values reach 71 Hz during the movement of opening and 59.5 Hz during the closing movement in healthy people [31]. In young patients aged 9-12 years without TMJ dysfunction and Angle's Class I occlusion, Kecik et al., measured values from 35.7 to 122 Hz [30]. In patients with reducing displacements of the disc, the values recorded during opening were 64.2 Hz and 58.6 Hz during closure. The values in patients with a displacement of the disc with locking (non-reducing) during opening and closing were 55.5 Hz and 31.0, respectively [33]. People with TMJ disorders also had high values reaching 131.3 Hz during opening and 68.5Hz during closing [34]. In patients with inflammation of the TMJ, the values were between 83.2 and 120.2 Hz [33]. In the study conducted by Rodrigues et al., this parameter in patients with impaired TMJs ranged from 39.14 Hz to 71.31 Hz [31]. These values are in agreement with those calculated in patients with abnormalities detected in this study.
In the vibration analysis it is very important to accurately determine Peak amplitude and the frequency of vibrations. In healthy TMJs, during mandibular movements, vibrations of low frequency and amplitude are generated. High frequency and amplitude of the vibrations may indicate degenerative changes [23]. Sometimes, as a result of the pathological changes we note a decrease in the amplitude of vibration, but with higher frequencies [23, 29]. These results were also obtained in this study of patients with mild TMJ disorders, where the mean peak amplitude was 0.86 Pa, while the mean peak frequency was 120.89 Hz. Low values of the peak amplitude in subjects with internal TMJ disorders may be associated with inflammatory lesions [32]. This may explain the low peak amplitude in people with mild TMJ disorders, which was recorded in this study.
Median Frequency significantly differs (p < 0.05) between Group 2 (the group of people with initial minor signs of TMJ dysfunction) and other groups (1, 3, 4). Therefore, the parameter of vibration energy seems to be important in the diagnosis of TMJ disorders. Similar results were registered by Christensen et al. who stated that compared to healthy subjects the parameter of Median Frequency is increased up to 79% in patients with true TMJ disorders [29].
Based on the results obtained, we could conclude that women had a smaller range of maximal opening than men. It might be caused by the differences in the body and facial skeleton sizes between men and women. The studies of numerous authors indicated that the range of motion could be affected by the height and the weight of the patient which were both typically smaller in women [35]. The smaller range of maximal opening and maximum condylar movement of the mandible in women were reported by Fukui [36] and Balos-Tuncer [37] who also found a difference in the condylar range of movement between men and women. Comparing any other parameters of joint vibration analysis significant differences between men and women were not found. It was evident that vibrations generated by temporomandibular joints were not dependant on sex.
The limitation of the study is that electrovibratography should be used like a screening tool (its diagnostic sensitivity for the abnormal joints is around 82%, and 98.3% for the asymptomatic volunteers with bilateral normal TMJ) [13]. It should be also emphasised that any limitation in maximum unassisted wide opening may affect the results obtained from joint vibration analysis and in such cases the method may be less valuable. Should clinical TMD become apparent during orthodontic treatment, the patient might attribute it to the therapy, rather than to the subclinical disorder at baseline. It thus makes therapeutic and forensic sense to carry out systematic TMJ-screening in all adult patients prior to orthodontic treatment, in order to identify patients at risk [2]. It is without doubt that clinical examination is essential for diagnosing patients with any signs and symptoms of TMD and any abnormality should be deeply diagnosed according to commonly used methods.
Assuming, the study allowed us to draw the following:
1) In a group of healthy young people with full natural dentition, the majority of examined joints generated small vibrations. However, some apparently healthy individuals had vibrations indicating early stages of dysfunction of the temporomandibular joints.
2) Median Frequency appears to be an important parameter in reporting the initial symptoms.
3) Peak Frequency seems to be an important characteristic parameter in TMJ subluxation.
4) Temporomandibular join vibrations were not dependant on sex.
Vibration analysis using BioJVA allows to detect of early or latent dysfunction of the temporomandibular joint.
Competing Interests
The authors have declared that no competing interest exists.
References
1. Upadhyaya C, Humagain M. The pattern of tooth loss due to dental caries and periodontal disease among patients attending dental department (OPD), Dhulikhel Hospital, Kathmandu University Teaching Hospital (KUTH), Nepal. Kathmandu Univ Med J (KUMJ). 2009;7:59-52
2. Jensen U, Ruf S. Longitudinal changes in temporomandibular disorders in young adults: indication for systematic temporomandibular joint screening. J Orofac Orthop. 2007;68:501-509
3. Bumann A, Lotzmann U. Color atlas of dental medicine. TMJ disorders and orofacial pain. Thieme, New York. 2003
4. McNeill C. Management of temporomandibular disorders: Concepts and controversies. J Prosthet Dent. 1997;77:510-522
5. Hassel AJ, Rammelsberg P, Schmitter M. Inter-examiner reliability in the clinical examination of temporomandibular disorders: influence of age. Community Dent Oral Epidemiol. 2006;34:41-46
6. Hirsch C, John MT, Lautenschlager C, List T. Mandibular jaw movement capacity in 10-17-yr-old children and adolescents: normative values and the influence of gender age and temporomandibular disorders. Eur J Oral Sci. 2006;114:465-470
7. Brown DT, Cox LK, Hafez AA, Cox CF. " True normal" TMD control subjects: a rare clinical finding. Cranio. 1998;16:84-89
8. Ishigaki S, Bessette RW, Maruyama T. The distribution of internal derangement in patients with temporomandibular joint dysfunction: prevalence, diagnosis and treatments. Cranio. 1992;10:289-286
9. Ishigaki S, Bessette RW, Maruyama T. Vibration analysis of the temporomandibular joints with meniscal displacement with and without reduction. Cranio. 1993;11:192-201
10. Ishigaki S. A clinical study on the deviation of the mandible in maximal opening and closing movements. Osaka Daigaku Shiqaku Zasshi. 1988;33:168-175
11. Ishigaki S, Bessette RW, Maruyama T. A clinical study of temporomandibular joint (TMJ) vibrations in TMJ dysfunction patients. Cranio. 1993;11:7-13
12. Ishigaki S, Bessette RW, Maruyama T. Vibration analysis of the temporomandibular joints with degenerative joint disease. Cranio. 1993;11:276-283
13. Ishigaki S, Bessette RW, Maruyama T. Vibration of the temporomandibular joints with normal radiographic imagins- comparison between asymptomatic volunteers and symptomatic patients. Cranio. 1993;11:88-94
14. Ishigaki S, Bessette RW, Maruyama T. Diagnostic accuracy of TMJ vibration analysis for internal derangement and/or degenerative joint disease. Cranio. 1994;12:241-245
15. Dworkin SF, LeResche L. Research diagnostic criteria for temporomandibular disorders: criteria, examinations and specifications, critique. J Craniomandib Disord. 1992;6:301-355
16. Droter JR. An orthopaedic approach to the diagnosis and treatment of disorders of the temporomandibular joint. Dent Today. 2005;24:84-88
17. Okeson JP. Management of Temporomandibular Disorders and Occlusion. 7th Edition. Elsevier. 2013
18. Schiffman E. et al. Diagnostic Criteria for Temporomandibular Disorders (DC/TMD) for Clinical and Research Applications: recommendations of the International RDC/TMD Consortium Network and Orofacial Pain Special Interest Group. J Oral Facial Pain Headache. 2014;28:6-27
19. Goiato MC, Garcia AR, dos Santos DM, Pesqueira AA. TMJ Vibrations in Asymptomatic Patients Using Old and New Complete Dentures. J Prosthodont. 2010;19:438-442
20. Huang ZS, Lin XF, Li XL. Characteristics of temporomandibular Joint vibrations in anterior disk displacement with reduction in adults. Cranio. 2011;29:276-283
21. Hutta JL, Morris TW, Katzberg RW, Tallents RH, Espeland MA. Separation of internal derangements of the temporomandibular joint using sound analysis. Oral Surg Oral Med Oral Pathol. 1987;63:151-157
22. Mazzetto MO, Hotta TH, Carrasco TG, Mazzetto RG. Characteristics of TMD noise analyzed by electrovibratography. Cranio. 2008;26:222-228
23. Olivieri KA, Garcia AR, Paiva G, Stevens C. Joint vibration analysis in asymptomatic volunteers and symptomatic patients. Cranio. 1999;17:176-183
24. Paiva G, Paiva PF, de Oliveira ON. Vibrations in the temporomandibular joints in patients examined and treated in a private clinic. Cranio. 1993;11:202-205
25. Radke J, Garcia RJr, Ketcham R. Wavelet transforms of TM joint vibrations: a feature extraction tool for detecting reducing displaced disks. Cranio. 2001;19:84-90
26. Gupta B, Thumati P, Radke J. Temporomandibular joint vibrations from totally asymptomatic subjects. Cranio. 2015;29:1-7
27. Radke JC, Kull RS. Distribution of temporomandibular joint vibration transfer to the opposite side. Cranio. 2012;30:194-200
28. Hwang IT, Jung DU, Lee JH, Kang D.W. Evaluation of TMJ sound on the subject with TMJ disorder by joint vibration analysis. J Adv Prosthodont. 2009;1:26-30
29. Christensen LV, Orloff J. Reproducibility of temporomandibular joint vibrations (electrovibratography). J Oral Rehabil. 1992;19:253-263
30. Kecik D, Kocadereli I, Saatci I. Condylar disc relationships and vibration energy in asymptomatic class I 9- to 12-year olds. Angle Orthod. 2005;75:54-62
31. Rodrigues CA, Magri LV, Melchior MO, Hotta TH, Mazzetto MO. Joint sounds analysis and its relationship with the temporomandibular disorders severity. J Dent Oral Disord Ther. 2014;2:7
32. Garcia AR, Madeira MC, Paiva G, Olivieri KA. Joint vibration analysis in patients with articular inflammation. Cranio. 2000;18:272-279
33. Tallents RH, Hatala M. Temporomandibular joint sounds in asymptomatic volunteers. J Prosthet Dent. 1993;69:298-304
34. Toolson GA, Sadowsky C. An evaluation of the relationship between temporomandibular joint sounds and mandibular movements. J Craniomandib Disord. 1991;5:187-196
35. Abou-Atme YS, Chedid N, Melis M, Zawawi KH. Clinical measurement of normal maximum mouth opening in children. Cranio. 2008;26:191-6
36. Fukui T, Tsuruta M, Murata K, Wakimoto Y, Tokiwa H, Kuwahara Y. Correlation between facial morphology, mouth opening ability, and condylar movement during opening-closing jaw movements in female adults with normal occlusion. Eur J Orthod. 2002;24:327-36
37. Balos Tuncer B, Ozoğul B, Akkaya S. Differences in opening and protrusive mandibular movements between Class I and II malocclusions in healthy adolescents. Korean J Orthod. 2011;41:127-37
Author contact
![]() Corresponding author: Teresa Sierpinska M.D., PhD, Department of Prosthetic Dentistry, Medical University of Bialystok, M. Sklodowska-Curie Str. 24a, 15-276 Bialystok, Poland Tel. 0488574645858, Fax 048857447030 e-mail: teresasierpinskacom
Corresponding author: Teresa Sierpinska M.D., PhD, Department of Prosthetic Dentistry, Medical University of Bialystok, M. Sklodowska-Curie Str. 24a, 15-276 Bialystok, Poland Tel. 0488574645858, Fax 048857447030 e-mail: teresasierpinskacom