Impact Factor ISSN: 1449-1907

 Global reach, higher impact
Int J Med Sci 2017; 14(3):257-267. doi:10.7150/ijms.17792 This issue Cite
Research Paper
Characterization of the serum and liver proteomes in gut-microbiota-lacking mice
Yu-Tang Tung1*, Ying-Ju Chen2*, Hsiao-Li Chuang3, Wen-Ching Huang1, Chun-Tsung Lo4, Chen-Chung Liao4 ![]() , Chi-Chang Huang1
, Chi-Chang Huang1 ![]()
1. Graduate Institute of Sports Science, College of Exercise and Health Sciences, National Taiwan Sport University, Taoyuan 33301, Taiwan;
2. Department of Food and Nutrition, Providence University, Taichung City 43301, Taiwan;
3. National Laboratory Animal Center, National Applied Research Laboratories, Taipei 11529, Taiwan;
4. Proteomics Research Center, National Yang-Ming University, Taipei 112, Taiwan.
* These authors collaborated equally to this work.
Received 2016-10-2; Accepted 2017-1-14; Published 2017-2-23
Abstract
Current nutrition research is focusing on health promotion, disease prevention, and performance improvement for individuals and communities around the world. The humans with required nutritional ingredients depend on both how well the individual is provided with balanced foods and what state of gut microbiota the host has. Studying the mutually beneficial relationships between gut microbiome and host is an increasing attention in biomedical science. The purpose of this study is to understand the role of gut microbiota and to study interactions between gut microbiota and host. In this study, we used a shotgun proteomic approach to reveal the serum and liver proteomes in gut-microbiota-lacking mice. For serum, 15 and 8 proteins were uniquely detected in specific-pathogen-free (SPF) and germ-free (GF) mice, respectively, as well as the 3 and 20 proteins were significantly increased and decreased, respectively, in GF mice compared to SPF mice. Among the proteins of the serum, major urinary protein 1 (MUP-1) of GF mice was significantly decreased compared to SPF mice. In addition, MUP-1 expression is primarily regulated by testosterone. Lacking in gut flora has been implicated in many adverse effects, and now we have found its pathogenic root maybe gut bacteria can regulate the sex-hormone testosterone levels. In the liver, 8 and 22 proteins were uniquely detected in GF mice and SPF mice, respectively, as well as the 14 and 30 proteins were significantly increased and decreased, respectively, in GF mice compared to SPF mice. Furthermore, ingenuity pathway analysis (IPA) indicated that gut microbiota influence the host in cancer, organismal injury and abnormalities, respiratory disease; cell cycle, cellular movement and tissue development; cardiovascular disease, reproductive system disease; and lipid metabolism, molecular transport and small molecule biochemistry. Our findings provide more detailed information of the role of gut microbiota and will be useful to help study gut bacteria and disease prevention.
Keywords: Gut flora, Germ-free, Endurance swimming, Exercise, Metabolism, Biomarker
Background
The gut microbiota contains an enormous variety and diversity of microorganisms. Among them, the human gastrointestinal tract is mainly managed by 500∼1000 species anaerobic bacteria [1, 2]. It is a complex and dynamic ecosystem that gut microbes can affect both sides of the energy balance equation. One is that influences the harvest of energy from components of the diet. One is that affects host genes which regulate how energy is expended and stored [3]. Recent studies showed that the composition of bacteria and function of gut microbiota in the digestive tract have been related to host metabolism [1, 4]. The gut microbiota of diet-induced obese mice is transplanted to gut-microbiota-lacking mice that led to weight gain, insulin resistance and obesity in gut-microbiota-lacking mice [5-8]. Bäckhed et al. indicated that gut microbiota have important functions related to host metabolism including modulating lipid metabolism and regulating fat storage [9]. The reason may be due to microbiota can induce the hepatic lipogenesis, regulate the circulating lipoprotein lipase inhibitor, as well as promote the storage of triglycerides in adipocytes [9, 10]. Bäckhed et al. showed that gut-microbiota-lacking mice have protection against the diet-induced obesity and decrease adiposity and hepatic triglycerides in the body by an increase in fatty acid metabolism via two complementary but independent mechanisms [3].
As the liver plays the central organ of metabolism and biosynthesis, a comparative proteomic analysis of the hepatic response in gut-microbiota-lacking mice will help to illustrate the interactions between gut microbiota and host metabolism. Proteomics is a large-scale comprehensive study of proteins including information on protein abundances and modification along with their interacting networks [11]. Proteomic analysis is defined as the powerful tool in studying the changes in protein expression and the identification of biomarkers for pathogenic processes [12-14]. To our knowledge, no precise mechanism has been identified to explain the relationship between gut-microbiota-lacking and host. The aim of this study was to explore the impact of the gut-microbiota-lacking mice by shotgun proteomic analysis. We hypothesized that a set of differentially expressed proteins will be identified as the molecular marker for gut-microbiota.
Methods
Animals and experiment design
Male GF (Germ-free) and SPF (Specific-pathogen-free) C57BL/6JNarl mice (n=12, respectively), 5 weeks old (National Laboratory Animal Center, Taipei), were maintained in a vinyl isolator in a room kept at a constant temperature (22±2°C) and humidity (55±5%). Mice were fed a commercial diet (5010 LabDiet, Purina Mills, St. Louis, MO, USA) and sterile water ad libitum. GF status was confirmed on a monthly basis by culturing feces, bedding and drinking water in thioglycollate medium (DIFCO, Camarillo, CA, USA). All animal experiments adhered to the guidelines of the Institutional Animal Care and Use Committee (IACUC) of the National Taiwan Sport University (NTSU). The IACUC ethics committee approved this study under the protocol IACUC-10118. Before being sacrificed, animals were deprived of food for 6 h and sacrificed after anesthetization with 95% CO2. The liver, lung, kidney, epididymal fat pad (EFP), muscle and brown adipose tissue (BAT) were removed and weighed. Blood samples were collected by cardiac puncture for metabolomics. Livers were excised for metabolomics.
Exercise performance test
The mice were placed individually in a columnar swimming pool (65 cm and radius of 20 cm) with 40 cm water depth maintained at 28ºC. A weight equivalent to 5% of body weight was attached to the root of the tail and the swimming times were recorded from beginning to exhaustion for each mouse in groups. Exhaustion was determined by observing failure to swim and the swimming period was regarded as the time spent by the mouse floating in the water, struggling and making necessary movements until strength exhaustion and drowning. When the mice were unable to remain on the water surface the mice were assessed to be exhausted. The swimming time from beginning to exhaustion was used to evaluate the endurance performance. Animals were deprived of after anesthetization with 95% CO2. Blood samples were collected by cardiac puncture for clinical biochemistry analysis.
Blood biochemical assessments
At the end of the experiments, all mice were killed by 95% CO2 asphyxiation, and blood was withdrawn by cardiac puncture after 6-h fast. Serum was collected by centrifugation at 1500×g, 4ºC for 15 min, and levels of glucose, triacylglycerol (TG), glycogen, aspartate aminotransferase (AST), alanine aminotransferase (ALT), CK, phosphatase (ALP) and testosterone were assessed by use of an auto-analyzer (Hitachi 7060, Hitachi, Tokyo, Japan).
Protein sample preparation
Each liver samples (100 mg) was placed in a 2 mL sample tube contain ceramic beads (0.2 g, 1 mm diameter) and homogenized in cold 50 mM Tris buffer (pH 6.8) containing 1% SDS, 1X protease inhibitor (Complete, Roche, USA), and 2X PI2 (PhosSTOP, Roche, USA) with a Precellys® 24 grinder (Bertin technologies, France). The tissue debris was removed by centrifugation at 15,000 rpm for 10 min at 4°C, then transferred the supernatant to the new eppendorf. Protein concentration was measured using BCA protein assay kit (Thermo Fisher Scientific, Rockford, IL, USA).
SDS-PAGE and in-gel digestion
The protein samples of three independent mice were resolved by 10% SDS-PAGE. Briefly, a total of 50 μg of each protein sample was applied to the gel, and the sizes of proteins were visualized by staining with Coomassie Brilliant Blue G-250 (Bio-Rad, Hercules, CA, USA) after electrophoresis. The gel lanes were split up into ten equal fractions, and the slices were destained by repeatedly washing in a solution of 25 mM ammonium bicarbonate and 50% (V/V) acetonitrile (1:1) until the protein bands were invisible. After completely being dried with a Speed-Vac (Thermo Electron, Waltham, Massachusetts, USA), proteins in the gel fragments were then subjected to the reduction and cysteine alkylation reactions for irreversibly breaking disulfide bridges in the proteins. For the reduction, each gel piece was rehydrated with 2% (V/V) β-mercaptoethanol in 25 mM ammonium bicarbonate and incubated at room temperature for 20 min in the dark. Cysteine alkylation was performed by adding an equal volume of 10% (V/V) 4-vinylpyridine in 25 mM ammonium bicarbonate and 50% (V/V) acetonitrile for 20 min. The samples were than washed by soaking in 1 mL of 25 mM ammonium bicarbonate for 10 min. Following Speed-Vac drying for 20 min, in-gel trypsin digestion was carried out by incubating the samples with 100 ng of modified trypsin (Promega, Mannheim, Germany) in 25 mM ammonium bicarbonate at 37°C overnight. The supernatant of the tryptic digest was transferred to an Eppendorf tube. Extraction of the remaining peptides from the gel was performed by adding 25 mM ammonium bicarbonate in 50% (V/V) acetonitrile, and then collected the solution after incubation for 10 min. The resulting digests were dried in a Speed-Vac and stored at -20°C until further analysis.
Nanoflow ultra high-performance liquid chromatography-mass spectrometry (LC-MS)
All mass spectrometric analyses were performed according to our previous report by using an LTQ-Orbitrap (Discovery) hybrid mass spectrometer with a nanoelectrospray ionization source (ThermoElectron, San Jose, CA, USA) coupled to a nano-flow high-performance liquid chromatography (HPLC) system (Agilent Technologies 1200 series, Germany) [15]. An Agilent C18 column (100 × 0.075 mm, 3.5 µm particle diameter) with mobile phases of A (0.1% formic acid in water) and B (0.1% formic acid in acetonitrile) was used. The pump flow rate was set at 0.5 µL/min, and peptide elution was achieved using a linear gradient of 5%-35% B for the first 30 min followed by a rapid increase to 95% B over the next 10 min. The conventional MS spectra (Survey Scan) were acquired at high resolution (M/ΔM, 60,000 full width half maximum) over the acquisition range of m/z 200-2000 and a series of precursor ions were selected for the MS/MS scan. The former examined the accurate mass and the charge state of the selected precursor ion, while the latter acquired the spectrum (CID spectrum or MS/MS spectrum) for the fragment ions generated by collision-induced dissociation.
Protein tryptic digests were fractionated on a BioBasic C18 300 Å Packed PicoFrit Column (75 μm i.d. × 10 cm, New Objective, Woburn, MA, USA) using Finnigan Surveyor high-performance liquid chromatography (Thermo Finnigan Scientific, Bremen, Germany). The sample was loaded with 100% buffer A (5% acetonitrile/0.1% formic acid) to 10% buffer B (80% acetonitrile/0.1% formic acid) for 2 min. Peptides were eluted using the following gradients: 90% buffer A to 60% buffer B for 38 min, which was followed by raising to 100% buffer B within 1 min. Within the subsequent 9 min, the buffer condition changed to 100% buffer A and was held for another 20 min. The flow rate was set at 200 nL/min. An LTQ/Orbitrap hybrid mass spectrometer with high-resolution isolation capability (Thermo Fisher Scientific) that was equipped with an electrospray ionization source was operated in the positive ionization mode with a spray voltage of 1.8 kV. The scan range of each full MS scan was m/z 350-2000. LC-MS data were acquired in the Orbitrap, with resolution of 30 000 (at m/z 400).
Conversion of Thermo Xcalibur .raw files to mzXML using ReAdW and peak finding using msInspect
Thermo Xcalibur native acquisition files (.raw files) were converted to the open file format mzXML via ReAdW.exe, which is available in the Trans-Proteomic Pipeline (TPP) platform (http://tools.proteomecenter.org/software.php). An open-source computer program, msInspect, was utilized to locate isotopes in the LC-MS data and assemble the isotopes into peptides. The msInspect software is distributed freely under an Apache 2.0 license and is available at http://proteomics.fhcrc.org/. LC-MS data files that were represented in the standard mzXML data format were accepted as input data. The data files encoding peak information were saved as .tsv files.
Liquid chromatography-tandem mass spectrometry (LC-MS/MS) and database search
Both of the direct LC-MS/MS analysis and the LC-MS/MS analysis in our strategy were performed on LTQ linear ion trap (LTQ, Thermo Fisher Scientific) with single injection. The reverse phase separation was performed using a linear acetonitrile gradient, which was identical to the one described in the LC-MS analysis section. Each cycle of one full scan mass spectrum (m/z 350-2000) was followed by three data-dependent tandem mass spectra with the collision energy set at 35%. In our strategy, the m/z values of the mass list generated from LC-MS (LTQ-Orbitrap) and selected by DeltaFinder was set in an inclusion list for phosphopeptide identification.
Bioworks Browser 3.1 was utilized to convert the Xcalibur binary (RAW) files into peak list (DTA) files. The parameters for DTA creation were set as follows: precursor mass tolerance, 1.4 Da; maximum number of intermediate MS/MS scans, 25 between spectra that have the same precursor masses; minimum peaks, 12 per MS/MS spectrum; minimum scans per group, 1; and automatic precursor charge selection. To concatenate the generated DTA files, merge.pl, which is a Perl script that is provided on the Matrix Science Web site, was used. The resulting peak lists were searched against the Swiss-Prot database via a Mascot search engine (http://www.matrixscience.com, Matrix Science Ltd., U.K.). The search parameters were set as follows: peptide mass tolerance, 1 Da; MS/MS ion mass tolerance, 1 Da; enzyme set as trypsin and allowance of up to two missed cleavages.
Ingenuity pathway analysis
The state-of-the-art pathway knowledge bases-Ingenuity® Systems, Ingenuity Pathway Analysis (IPA) was applied to infer global network functions of all differentially expressed proteins by gut microbiota. Accession numbers and expression fold change of the proteins were uploads into the IPA (Ingenuity Pathway Analysis) software (Ingenuity® system, Redwood City, CA, USA) for grouping the interaction networks and the biological functions of differential expression proteins. The significance (p value of overlap) was calculated by the Fisher's extract test.
Sodium dodecyl sulfate-polyacrylamide gel electrophoresis (SDS-PAGE) and Western blot analysis
To ensure equal loading of serum protein, SDS-PAGE was carried out in 12% gel and all blots were stained with coomassie blue. The mice serum MUP-1 was resolved by 12% Bis-Tris SDS-PAGE followed by electrophoretic transfer to a nitrocellulose membrane (Invitrogen, Carlsbad, CA, USA). The resulting blots were then probed with antibody against mouse MUP-1 (ab25124; Abcam, Cambridge, MA, USA) at 4ºC overnight. After incubation with rabbit anti mouse IgG-HRP antibody, the protein was visualized with chemiluminescence reagent (Millipore, Billerica, MA, USA).
Statistical analysis
Data are expressed as mean ± SEM (n=12). Statistical differences were analyzed by one-way ANOVA with Duncan's test. Results were considered significant at p < 0.05.
Results and Comments
Effects of SPF and GF mice on body and tissue weights
In addition, the effects of SPF and GF mice on final body weights, and the indices of liver, lung, kidney, muscle, EFP and BAT were shown in Table 1. Before the experiment, we confirmed that the SPF and GF groups had equal daily dietary intake and water consumption. However, except for BAT index, GF group significantly decreased the indices of liver, lung, kidney, muscle and EFP than the SPF group. Basso et al. demonstrated the gut microbiota can increase body fat [16]. D'Aversa et al. also showed that the gut microbiota not only promotes lipogenesis and VLDL production, it also facilitates storage in adipose tissue by increasing LPL activity [17]. Bäckhed et al. showed that the lean phenotype of germ-free mice is associated with increased levels of phosphorylated AMP-activated protein kinase, and its downstream molecular targets involved in fatty acid oxidation in skeletal muscle and liver [3]. In this study, we found that the lack of the gut microflora has large effects on liver, lung, kidney, muscle and EFP. Among them, liver is involved in the metabolism and synthesis of the body. Thus, hepatic proteomics is an important parameter for this study of physiological metabolisms.
The body weight and the weights and indices of tissues in SPF and GF mice.
| SPF | GF | |
|---|---|---|
| BW (g) | 24.2±0.5 | 25.0±0.4 |
| Liver (g) | 1.23±0.04 | 0.84±0.04* |
| Lung (g) | 0.15±0.02 | 0.12±0.01 |
| Kidney (g) | 0.28±0.01 | 0.27±0.01 |
| EFP (g) | 0.35±0.02 | 0.23±0.01* |
| Muscle (g) | 0.29±0.01 | 0.23±0.01* |
| BAT (g) | 0.06±0.01 | 0.05±0.01 |
| Liver index (%) | 5.04±0.10 | 3.35±0.17* |
| Lung index (%) | 0.58±0.03 | 0.48±0.04* |
| Kidney index (%) | 1.16±0.03 | 1.09±0.02* |
| EFP index (%) | 1.43±0.08 | 0.92±0.06* |
| Muscle index (%) | 1.18±0.05 | 0.93±0.04* |
| BAT index (%) | 0.26±0.03 | 0.21±0.02 |
Values are means ± SEM for n = 12 mice per group. *p<0.05 compared with the SPF group. Skeletal muscle mass contains both gastrocnemius and soleus muscles in the back part of the lower legs. BW, Body weight; EFP, epididymal fat pad; BAT, brown adipose tissue; liver index (%) = liver weight/BW×100; lung index (%) = lung weight/ BW×100; kidney index (%) = kidney weight/ BW×100; EFP index (%) = EFP weight/ BW×100; muscle index (%) = muscle weight BW×100; BAT index (%) = BAT weight BW×100.
Effects of SPF and GF mice on exercise performance
The exhaustive swimming time of the GF mice was significantly lower (61%) than the SPF mice (p < 0.05), as shown in Fig. 1A. We found that the association of gut microbiota and exercise performance in SPF and GF mice. Sato et al. suggested that intestinal microbiota may be an important environmental factor associated with host metabolism, physiology, and antioxidant endogenous defense [18]. Therefore, the antioxidant enzyme system helps protect against intense exercise-induced oxidative damage. Thus, gut microbial status could be crucial for exercise performance and its potential action linked with the antioxidant enzyme system.
Effects of SPF and GF mice on the (A) exhaustive swimming time of exercise performance, and serum levels of the (B) glucose, (B) TG, (D) glycogen, (E) AST, (F) ALT, (G) CK, and (E) ALP after an acute exercise challenge. Data were mean ± SEM (n = 12). Different letters indicated significant difference at p < 0.05 by one-way ANOVA.
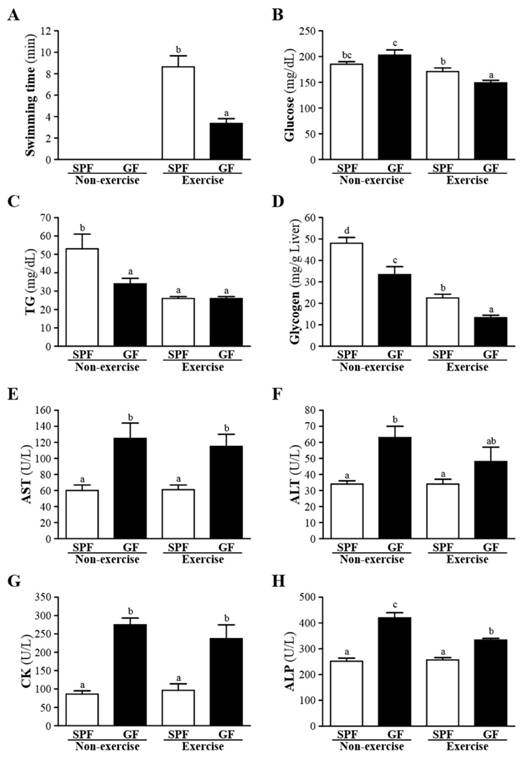
Effects of SPF and GF mice on biochemical variables
Effects of SPF and GF mice on glucose, TG, glycogen, AST, ALT, CK and ALP were shown in Fig. 1B-H. Whether non-exercise or exercise, gut-microbiota significantly decreased the serum levels of AST, ALT, CK and ALP, and increased the serum level of glycogen compared to germ-free mice. In addition, GF mice of exercise exhibited a significant decrease in the serum glucose, and GF mice of non-exercise exhibited a significant decrease in the serum TG, respectively, compared with SPF mice. In the present investigation, we observed that gut-microbiota could improve the liver function test as the serum concentration of AST, ALT and ALP significantly increased in SPF group compared to GF group. In addition, our data strongly supported that improvement of hepatic insulin sensitivity leads to an increase in liver glycogen storage. Bäckhed et al. showed that GF mice have lower hepatic TG [9].
Effects of SPF and GF mice on serum proteomic analysis
The serum protein profiles of SPF and GF mice were analyzed for the first time by LC-MS/MS. The spectra generated were analyzed by TurboSequest to identify the peptide sequences against mouse database in UniProt. The results of analysis were scored using Xcorr. The proteins were regarded as serum proteins if more than two peptides from a single protein met the threshold of Xcorr score. The Venn diagram in Fig. 2A summarizes the common, only detected, or overlapped in significant regulated proteins for serum from SPF mice and GF mice. The total number of proteins from the combined list is 511 for SPF mice and 504 for GF mice with an overlap of 23 as shown in Fig. 2A. There were 91% common and 9% significant regulated proteins between two groups. When the 91% un-changed proteins were removed and the other significant regulated proteins were normalized to 100%, there was an 17.4% unique proteins in GF mice, an 32.6% unique proteins in SPF mice and an 50% overlap in significant regulated proteins between SPF mice and GF mice (Figure 2A). The 15 and 8 proteins were uniquely detected in SPF mice and GF mice, respectively (Fig. 2B and Fig. 2C). In addition, the 3 and 20 proteins were significantly increased and decreased, respectively, in GF mice compared to SPF mice (Fig. 2D and Fig. 2E).
Venn diagrams comparing the common, only detected, or overlap in significant regulated proteins for serum samples from SPF and GF mice. (A) There was a 91% common and a 9% significant regulated proteins between two groups. When the 91% un-changed proteins were removed and the other significant regulated proteins were normalized to 100%, there was a 17.4% unique proteins in GF mice, a 32.6% unique proteins in SPF mice, and an 50% overlap in significant regulated proteins between SPF mice and GF mice. (B) The percent distributions for the 8 proteins were only detected in GF mice. (C) The percent distributions for the 15 proteins were only detected in SPF mice. (D) The percent distributions for the 3 proteins were significantly increased in GF mice compared to SPF mice. (E) The percent distributions for the 20 proteins were significantly decreased in GF mice compared to SPF mice.
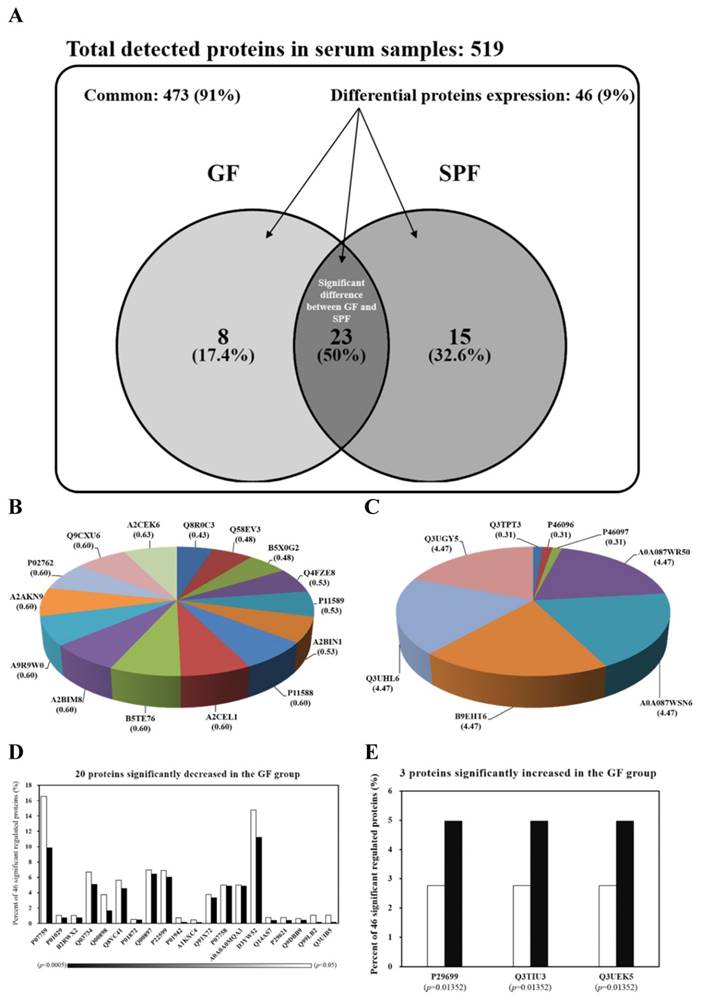
15 proteins were uniquely detected in the SPF mice, including Q8R0C3, Q58EV3, B5X0G2, Q4FZE8, P11589, A2BIN1, P11588, A2CEL1, B5TE76, A2BIM8, A9R9W0, A2AKN9, P02762, Q9CXU6 and A2CEK6. In addition, 8 proteins were uniquely detected in the GF mice, including Q3TPT3, P46096, P46097, A0A087WR50, A0A087WSN6, B9EHT6, Q3UHL6 and Q3UGY5. It is interesting that many MUP-1 isoforms (Q58EV3, Q4FZE8, P11588 and A2CEL1) were only detected in SPF mice, but not in GF mice. Further Western blotting analysis was carried out to confirm the expression of MUP-1, as shown in Fig. 3A. The MUP-1 protein expression was significantly decreased in GF mice compared to SPF mice. In addition, MUP-1 is mainly produced by the liver, and MUP-1 expression is primarily regulated by testosterone. Actually, in this study the testosterone level was significantly decreased in GF mice compared to SPF mice (Fig. 3B). Markle et al. have pointed out the connection between the microbiome and autoimmune disorders [19], and now they have found its pathogenic root was gut bacteria can regulate the sex-hormone testosterone. Reduced circulating testosterone levels have been implicated in many adverse effects including reduced spermatogenesis, libido and sexual function, decreased muscle and bone mass, low energy levels, fatigue, poor physical performance, depressed mood, and impaired cognitive dysfunction [20-23]. Mup gene expression is thought to be subjected to hormonal control, including testosterone, thereby explaining the higher MUP-1 levels found in males [24]. A variety of hormones, including testosterone, have been described as regulating MUPs and as impacting on MUP expression patterns [25]. Most insights come from studies on MUP-1 that appears to be involved in increasing energy expenditure, core body temperature, glucose tolerance and insulin sensitivity in mice [26]. In mice with genetic- or diet-induced diabetes, serum and urine concentrations of MUP-1 were markedly decreased and contrarily elevated MUP-1 levels exerted beneficial metabolic effects, and these findings suggest a function of MUP-1 in the signaling pathways could regulate glucose and lipid metabolism [27]. Therefore, we assume that MUP-1 may act as a molecular switch linking nutritional status to disease prevention.
Effects of SPF and GF mice on MUP-1 protein expression and testosterone level. (A) Protein expression of MUP-1 in the serum of SPF and GF mice as measured by western blot. (B) Testosterone expression in the serum of SPF and GF mice as measured by an automatic analyzer (Hitachi 7060, Hitachi, Tokyo, Japan).

Effects of SPF and GF mice on liver proteomic analysis
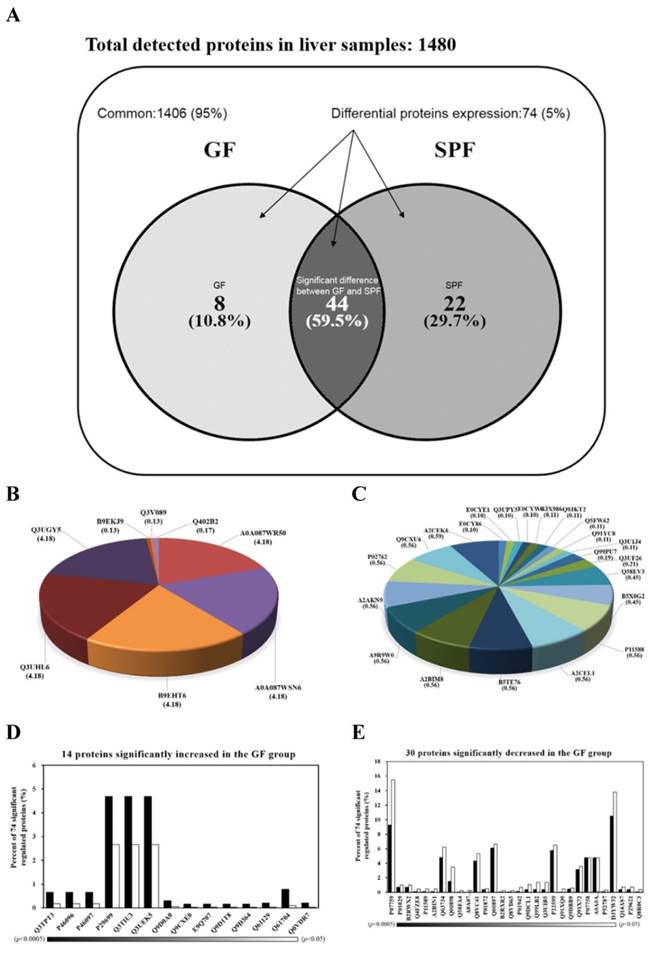
Hepatic proteins were separated by electrophoresis and digested by trypsin before being analyzed by tandem mass spectrometry. The Venn diagram in Fig. 4A summarizes the common, only detected, or overlapped in significant regulated proteins for liver tissues from SPF mice and GF mice. The total number of proteins from the combined list is 1472 for SPF mice and 1458 for GF mice with an overlap of 44 as shown in Fig. 4A. There were 95% common and 5% significant regulated proteins between two groups. When the 95% un-changed proteins were removed and the other significant regulated proteins were normalized to 100%, there was an 10.8% unique proteins in GF mice, an 29.7% unique proteins in SPF mice, and an 59.9% overlap in significant regulated proteins between SPF mice and GF mice (Figure 4A). The 8 and 22 proteins were uniquely detected in GF mice and SPF mice, respectively (Fig. 4B and Fig. 4C). In addition, the 14 and 30 proteins were significantly increased and decreased, respectively, in GF mice compared to SPF mice (Fig. 4D and Fig. 4E).
Venn diagrams comparing the common, only detected, or overlap in significant regulated proteins for liver samples from SPF and GF mice. (A) There was a 95% common and a 5% significant regulated proteins between two groups. When the 95% un-changed proteins were removed and the other significant regulated proteins were normalized to 100%, there was a 10.8% unique proteins in GF mice, a 29.7% unique proteins in SPF mice, and an 59.9% overlap in significant regulated proteins between SPF mice and GF mice. (B) The percent distributions for the 8 proteins were only detected in GF mice. (C) The percent distributions for the 22 proteins were only detected in SPF mice. (D) The percent distributions for the 14 proteins were significantly increased in GF mice compared to SPF mice. (E) The percent distributions for the 30 proteins were significantly decreased in GF mice compared to SPF mice.
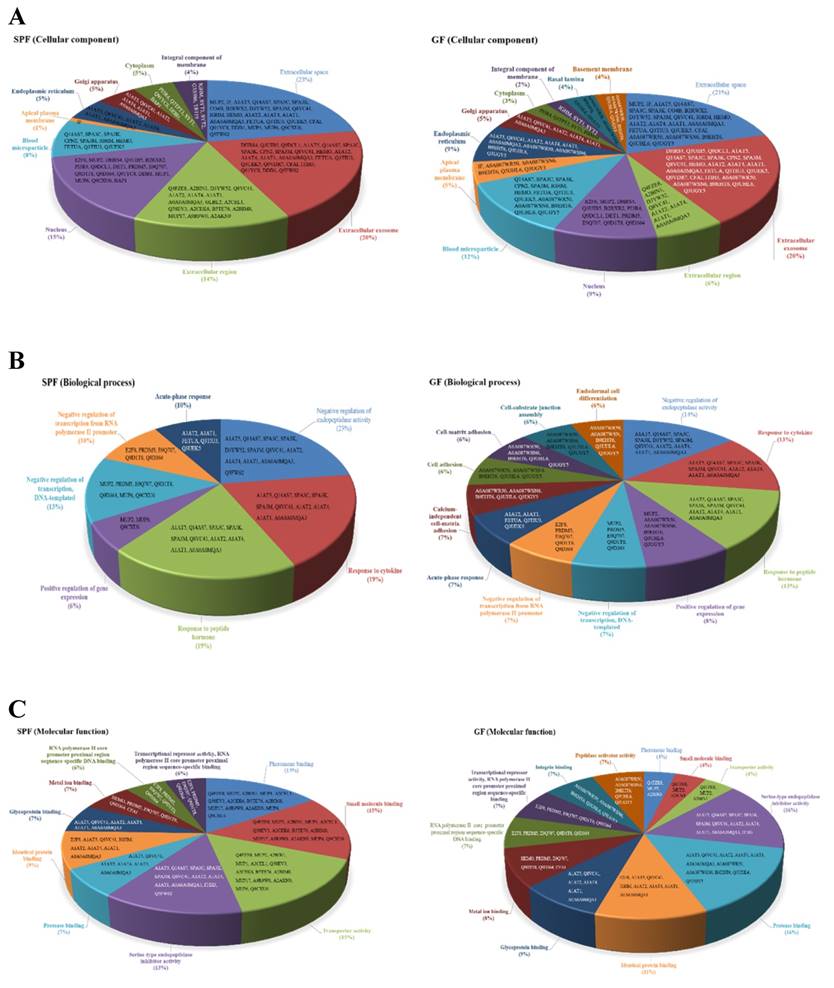
In addition, the cellular locations of the identified differential proteins of GF mice and SPF mice were shown in Fig. 5A. The cellular distributions for the GF mice and SPF mice were both major in extracellular space (21%, GF mice; 23%, SPF mice) and extracellular exosome (20%, GF mice; 20%, SPF mice). The biological process for the GF mice and SPF mice were both major in negative regulation of endopeptidase activity (14%, GF mice; 23%, SPF mice), response to cytokine (13%, GF mice; 19%, SPF mice), and response to peptide hormone (13%, GF mice; 19%, SPF mice), as shown in Fig. 5B. The molecular function for the GF mice was major in serine-type endopeptidase inhibitor activity (16%), protease binding (16%), identical protein binding (11%) and glycoprotein binding (9%), as well as for the SPF mice was major in pheromone binding (15%), small molecule binding (15%), transporter activity (15%) and serine-type endopeptidase inhibitor activity (13%), as shown in Fig. 5C.
Classification of the differentially expressed proteins in liver tissues were identified from SPF and GF mice. (A) Pie charts representing the distribution of the differential proteins in SPF (left panel) and GF (right panel) mice according to their cellular component. (B) Pie charts representing the distribution of the differential proteins in SPF (left panel) and GF (right panel) mice according to their biological process. (C) Pie charts representing the distribution of the differential proteins in SPF (left panel) and GF (right panel) mice according to their molecular function.
Effects of SPF and GF mice on Ingenuity Pathways Analysis (IPA)
The hepatic proteins with changes in regulation due to germ-free can be classified into following groups: proteins implicated in canonical signaling pathways, proteins implicated in BioFunctions and proteins implicated in Toxfunctions. These 3 major pathways between GF mice and SPF mice were generated by IPA with the threshold of p-value < 0.05. The length of the bar only indicates that the differentially expressed proteins are related to this pathway, but is by no means indicative of the pathway being either up- or down-regulated.
The proteins regulated in lacking gut microflora were involved in the following canonical signaling pathways: acute phase response signaling, LXR/RXR activation, FXR/RXR activation, coagulation system and complement system. The major 10 functions of Biofunctions in the lacking gut microflora-regulated hepatic proteins were: organismal injury and abnormalities, renal and urological disease, neurological disease, cardiovascular disease, connective tissue disorders, cell-to-cell signaling and interaction, cell morphology, cell death and survival, cell cycle and cellular assembly, and organization. The Toxfunctions of the lacking gut microflora-regulated hepatic proteins are cardiotoxicity (cardiac infarction, congenital heart anomaly, cardiac fibrosis, cardiac inflammation and cardiac hypertrophy), hepatotoxicity (liver cirrhosis, liver inflammation/hepatitis, liver hyperbilirubinemia, liver damage and liver fibrosis) and nephrotoxicity (renal damage, glomerular injury, renal tubule injury, renal inflammation and renal nephritis).
Major functions of the gut microflora include 1) cancer, organismal injury and abnormalities, respiratory disease, 2) cell cycle, cellular movement and tissue development, 3) cardiovascular disease, reproductive system disease, and 4) lipid metabolism, molecular transport and small molecule biochemistry. Markle et al. showed that by transferring bacteria from one mouse to another, they can control this regulation and protect mice at high-risk for disease [19]. Thus, gut microbiota play an important role in disease prevention.
Conclusions
To better understand and characterize the function of gut microbiota, we compared the proteomic profiles of SPF and GF mice by LC-MS/MS and IPA analysis. We identified 23 uniquely detected proteins (15 proteins uniquely detected in the SPF mice and 8 proteins uniquely detected in the GF mice) of serum. The MUP-1 isoforms were significantly affected in GF mice, and MUP-1 expression is primarily regulated by testosterone. In addition, 1) cancer, organismal injury and abnormalities, respiratory disease, 2) cell cycle, cellular movement and tissue development, 3) cardiovascular disease, reproductive system disease, and 4) lipid metabolism, molecular transport and small molecule biochemistry were involved in the gut microflora. Thus, the study provides the discovery of a relationship between gut-microbiota and MUP-1. Our findings shed light on a new perspective of the role of gut microbiota in testosterone and will be useful to help gut microbiota and disease prevention.
Acknowledgements
The authors thank the Germfree & Gnotobiotic Section, Technical Services Division, National Laboratory Animal Center, National Applied Research Laboratories, for providing the GF mice. This study was supported by the Ministry of Science and Technology of Taiwan (grant no. MOST-102-2628-B179-001-MY3 and MOST-104-2628-H-179-MY3 to Chi-Chang Huang).
Authors' contributions
Chen-Chung Liao and Chi-Chang Huang conceived of the study and supervised the study design. Hsiao-Li Chuang, Chun-Tsung Lo, Wen-Ching Huang, Chen-Chung Liao and Chi-Chang Huang carried out the laboratory experiments. Yu-Tang Tung, Ying-Ju Chen, Chen-Chung Liao and Chi-Chang Huang analyzed the data, interpreted the results, prepared figures, edited and revised manuscript. Ying-Ju Chen, Chen-Chung Liao and Chi-Chang Huang contributed reagents, materials, analysis tools. All authors discussed the results and implications on the manuscript at all stages. All authors read and approved the final manuscript.
Competing Interests
The authors have declared that no competing interest exists.
References
1. Chuang H.L, Huang Y.T, Chiu C.C, Liao CD Hsu, F.L Huang, C.C Hou, C.C. Metabolomics characterization of energy metabolism reveals glycogen accumulation in gut-microbiota-lacking mice. J Nutr Biochem. 2012;23:752-58
2. Xu J, Gordon J.I. Honor thy symbionts. Proc Natl Acad Sci U S A. 2003;100:10452-9
3. Bäckhed F, Manchester J.K, Semenkovich C.F, Gordon J.I. Mechanisms underlying the resistance to diet-induced obesity in germ-free mice. Proc Natl Acad Sci U S A. 2007;104:979-84
4. Hsu Y.J, Chiu C.C, Li Y.P, Huang W.C, Huang Y.T, Huang C.C, Chuang H.L. Effect of intestinal microbiota on exercise performance in mice. J Strength Cond Res. 2015;29:552-8
5. Turnbaugh P.J, Bäckhed F, Fulton L, Gordon J.I. Diet-induced obesity is linked to marked but reversible alterations in the mouse distal gut microbiome. Cell Host Microbe. 2008;3:213-23
6. Spor A, Koren O, Ley R. Unravelling the effects of the environment and host genotype on the gut microbiome. Nat Rev Microbiol. 2011;9:279-90
7. Cani P.D, Amar J, Iglesias M.A, Poggi M, Knauf C, Bastelica D, Neyrinck A.M, Fava F, Tuohy K.M, Chabo C, Waget A, Delmée E, Cousin B, Sulpice T, Chamontin B, Ferrières J, Tanti J.F, Gibson G.R, Casteilla L, Delzenne N.M, Alessi M.C, Burcelin R. Metabolic endotoxemia initiates obesity and insulin resistance. Diabetes. 2007;56:1761-72
8. Cani P.D, Bibiloni R, Knauf C, Waget A, Neyrinck A.M, Delzenne N.M, Burcelin R. Changes in gut microbiota control metabolic endotoxemia-induced inflammation in high-fat diet-induced obesity and diabetes in mice. Diabetes. 2008;57:1470-81
9. Bäckhed F, Ding H, Wang T, Hooper L.V, Koh G.Y, Nagy A, Semenkovich C.F, Gordon J.I. The gut microbiota as an environmental factor that regulates fat storage. Proc Natl Acad Sci U S A. 2004;101:15718-23
10. Velagapudi V.R, Hezaveh R, Reigstad C.S, Gopalacharyulu P, Yetukuri L, Islam S, Felin J, Perkins R, Borén J, Oresic M, Bäckhed F. The gut microbiota modulates host energy and lipid metabolism in mice. J Lipid Res. 2010;51:1101-12
11. Liao C.C, Chiu Y.S, Chiu W.C, Tung Y.T, Chuang H.L, Wu J.H, Huang C.C. Proteomics Analysis to Identify and Characterize the Molecular Signatures of Hepatic Steatosis in Ovariectomized Rats as a Model of Postmenopausal Status. Nutrients. 2015;7:8752-66
12. Rahim M.A, Rahim Z.H, Ahmad W.A, Hashim O.H. Can Saliva Proteins Be Used to Predict the Onset of Acute Myocardial Infarction among High-Risk Patients? Int J Med Sci. 2015;12:329-35
13. Li X, Li S, Lu M, Yang G, Shen Y, Zhou X. Proteomic Profiling of Iron Overload-Induced Human Hepatic Cells Reveals Activation of TLR2-Mediated Inflammatory Response. Molecules. 2016;21:322
14. Hussey S.E, Sharoff C.G, Garnham A, Yi Z, Bowen B.P, Mandarino L.J, Hargreaves M. Effect of exercise on the skeletal muscle proteome in patients with type 2 diabetes. Med Sci Sports Exerc. 2013;45:1069-76
15. Liao C.C, Chou P.L, Cheng C.W, Chang Y.S, Chi W.M, Tsai K.L, Chen W.J, Kung T.S, Tai C.C, Lee K.W, Chen Y.C, Lin C.Y. Comparative analysis of novel autoantibody isotypes against citrullinated-inter-alpha-trypsin inhibitor heavy chain 3 (ITIH3)(542-556) peptide in serum from Taiwanese females with rheumatoid arthritis, primary Sjögren's syndrome and secondary Sjögren's syndrome in rheumatoid arthritis. J Proteomics. 2016;141:1-11
16. Basso N, Soricelli E, Castagneto-Gissey L, Casella G, Albanese D, Fava F, Donati C, Tuohy K, Angelini G, La Neve F, Severino A, Kamvissi-Lorenz V, Birkenfeld A.L, Bornstein S, Manco M, Mingrone G. Insulin Resistance, Microbiota, and Fat Distribution Changes by a New Model of Vertical Sleeve Gastrectomy in Obese Rats. Diabetes. 2016;65:2990-3001
17. D'Aversa F, Tortora A, Ianiro G, Ponziani F.R, Annicchiarico B.E, Gasbarrini A. Gut microbiota and metabolic syndrome. Intern Emerg Med. 2013;1:S11-5
18. Sato T, Imanaka H, Rashid N, Fukui T, Atomi H, Imanaka T. Genetic evidence identifying the true gluconeogenic fructose-1,6-bisphosphatase in Thermococcus kodakaraensis and other hyperthermophiles. J Bacteriol. 2004;186:5799-807
19. Markle J.G, Frank D.N, Mortin-Toth S, Robertson C.E, Feazel L.M, Rolle-Kampczyk U, von Bergen M, McCoy K.D, Macpherson A.J, Danska J.S. Sex differences in the gut microbiome drive hormone-dependent regulation of autoimmunity. Science. 2013;339:1084-8
20. Matsumoto A.M. Andropause: clinical implications of the decline in serum testosterone levels with aging in men. J Gerontol A Biol Sci Med Sci. 2002;57:M76-99
21. Stanworth R.D, Jones T.H. Testosterone for the aging male; current evidence and recommended practice. Clin Interv Aging. 2008;3:25-44
22. Bassil N, Morley J.E. Late-life onset hypogonadism: a review. Clin Geriatr Med. 2010;26:197-222
23. Baer J.T. Testosterone replacement therapy to improve health in older males. Nurse Pract. 2012;37:39-44
24. Knopf J.L, Gallagher J.F, Held W.A. Differential, multihormonal regulation of the mouse major urinary protein gene family in the liver. Mol Cell Biol. 1983;3:2232-40
25. Cheetham S.A, Smith A.L, Armstrong S.D, Beynon R.J, Hurst J.L. Limited variation in the major urinary proteins of laboratory mice. Physiol Behav. 2008;96:53-261
26. Hui X, Zhu W, Wang Y, Lam K.S, Zhang J, Wu D, Kraegen E.W, Li Y, Xu A. Major urinary protein-1 increases energy expenditure and improves glucose intolerance through enhancing mitochondrial function in skeletal muscle of diabeticmice. J Biol Chem. 2009;284:14050-57
27. Zhou Y, Rui L. Major urinary protein regulation of chemical communication and nutrient metabolism. Vitam Horm. 2010;83:151-64
Author contact
![]() Corresponding authors: Chen-Chung Liao, Proteomics Research Center, National Yang-Ming University, No.155, Sec.2, Linong Street, Taipei, 11221, Taiwan Tel.: +886-2-2826-7382 E-Mail: ccliaoedu.tw; Chi-Chang Huang, Graduate Institute of Sports Science, National Taiwan Sport University, No. 250, Wenhua 1st Rd., Guishan Township, Taoyuan County 33301, Taiwan Tel.: +886-3-328-3201 (ext. 2619) E-Mail: john5523edu.tw
Corresponding authors: Chen-Chung Liao, Proteomics Research Center, National Yang-Ming University, No.155, Sec.2, Linong Street, Taipei, 11221, Taiwan Tel.: +886-2-2826-7382 E-Mail: ccliaoedu.tw; Chi-Chang Huang, Graduate Institute of Sports Science, National Taiwan Sport University, No. 250, Wenhua 1st Rd., Guishan Township, Taoyuan County 33301, Taiwan Tel.: +886-3-328-3201 (ext. 2619) E-Mail: john5523edu.tw