Impact Factor ISSN: 1449-1907

 Global reach, higher impact
Int J Med Sci 2017; 14(1):75-85. doi:10.7150/ijms.17145 This issue Cite
Research Paper
Predictors of Left Ventricle Remodeling: Combined Plasma B-type Natriuretic Peptide Decreasing Ratio and Peak Creatine Kinase-MB
Jen-Te Hsu1, Chang-Min Chung1, Chi-Ming Chu2, Yu-Shen Lin1, Kuo-Li Pan1, Jung-Jung Chang1, Po-Chang Wang1, Shih-Tai Chang1, Teng-Yao Yang1, Shih-Jung Jang3, Tsung-Han Yang4, Ju-Feng Hsiao1 ![]()
1. The Department of Cardiology, Chiayi Chang Gung Memorial Hospital, Chang Gung University College of Medicine, Taiwan.
2. Section of Health Informatics, Institute of Public Health, National Defense Medical Center and University, Taiwan.
3. The Department of Cardiology, Taipei Tzu Chi General Hospital, Taiwan.
4. Department of Laboratory Medicine, Chang-Gung Medical Foundation.
Received 2016-8-9; Accepted 2016-11-24; Published 2017-1-15
Abstract
Background: Previous studies reported that patients who had an acute myocardial infarction (AMI) have found that measuring B-type natriuretic peptide (BNP) during the subacute phase of left ventricular (LV) remodeling can predict the possible course of LV remodeling. This study assessed the use of serial BNP serum levels combined with early creatine kinase-MB (CK-MB) to predict the development of significant LV remodeling in AMI patients.
Methods: Nighty-seven patients with new onset AMI were assessed using serial echocardiographic studies and serial measurements of BNP levels, both performed on day-2 (BNP1), day-7 (BNP2), day-90 (BNP3), and day-180 (BNP4) after admission. LV remodeling was defined as >20% increase in biplane LV end-diastolic volume on day-180 compared to baseline (day-2).
Results: Patients were divided into LV remodeling [LVR(+)] and non LV remodeling [LVR(-)] groups. No first-week BNP level was found to predict remodeling. However, the two groups had significantly different day-90 BNP level (208.1 ± 263.7 pg/ml vs. 82.4 ± 153.7 pg/ml, P = 0.039) and significantly different 3-month BNP decrease ratios (RBNP13) (14.4 ± 92.2% vs. 69.4 ± 25.9%, P < 0.001). The appropriate cut-off value for RBNP13 was 53.2% (AUC = 0.764, P < 0.001). Early peak CK-MB (cut-off 48.2 ng/ml; AUC = 0.672; P = 0.014) was another independent predictor of remodeling. Additionally, combining peak CK-MB and RBNP13 offered an excellent discrimination for half-year remodeling when assessed by ROC curve (AUC = 0.818, P < 0.001).
Conclusion: RBNP13 is a significant independent predictor of 6-month LV remodeling. The early peak CK-MB additionally offered an incremental power to the predictions derived from serial BNP examinations.
Keywords: B-type Natriuretic Peptide (BNP), left ventricular remodeling, acute myocardial infarction (AMI), BNP decrease ratio, peak creatine kinase-MB.
Introduction
Left ventricle (LV) remodeling is a complex pathologic process of progressive dilatation, leading to dysfunction and heart failure in patients having had an acute myocardial infarction (AMI). [1] Previous studies have shown B-type natriuretic peptide (BNP) levels can be used for prognostic purposes when measured in the subacute phase of LV remodeling in AMI patients. [2]
This study assessed value of serial measurements of BNP serum levels in predicting LV function. To do this, we performed a series of four blood samplings and echocardiographic studies over a six-month period in AMI patients undergoing revascularization.
Methods
Patients
The protocol for this study was approved by the ethics committee of the Chiayi Chang Gung Memorial Hospital, and written informed consent was obtained from each patient prior to participation in the study.
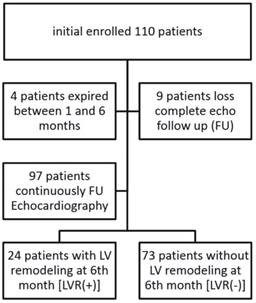
This study assessed all patients with new onset AMI admitted to Chiayi Chang Gung Memorial Hospital, Taiwan, between March 2010 and December 2014. We enrolled 110 patients, 97 of whom completed a 6-month echocardiographic follow-up (Fig. 1). Patients with significant mitral regurgitation (MR) secondary to papillary muscle rupture, recent acute coronary syndrome (< 3 months), cognitive disorders, or coexisting terminal illness were excluded. Serum concentrations of BNP were measured on day-2 (BNP1), day-7 (BNP2), day-90 (BNP3), and day-180 (BNP4) after admission. Serial echocardiographic studies were also performed four times following the same schedule as BNP sampling.
Study flow chart. Ninety-seven patients received 6-month echocardiography and were divided into 2 groups based on presence of LV remodeling (LVR) at 6-month follow-up.
Additional laboratory parameters monitored at first 3 days during hospitalization included lipid profile, liver function panel, serum creatinine level, creatine kinase-MB (CK-MB) and high-sensitivity C-reactive protein (hs-CRP). These parameters were again measured on day-180.
Angioplasty protocol
Once AMI was diagnosed, percutaneous coronary intervention (PCI) was completed as soon as possible. Patients were classified into two groups: one group with ST-segment elevation myocardial infarction (STEMI, defined as ST elevation >1 mm in 2 limb leads or >2 mm in leads V1-V6 or new left bundle branch block) and the other group with Non ST-segment elevation myocardial infarction (NSTEMI, defined as no ST-elevation on electrocardiogram (ECG) despite elevated troponin-I > 0.06 ng/ml). For STEMI patients, door-to-balloon time was reduced to less than 90 minutes. For NSTEMI patients, PCI was performed as soon as possible and the goal was to reduce door-to-balloon time to less than 48 hours. PCI was considered successful if the residual stenosis was < 30% and the flow in the involved vessel after the PCI was better than thrombolysis in myocardial infarction (TIMI) grade 2. All patients received dual antiplatelet therapy with a loading dose of aspirin 100 mg and clopidogrel 300 mg and a maintenance dose of aspirin 100 mg and clopidogrel 75 mg per day. When admitted, each patient was prescribed traditional heparin or low molecular weight heparin (enoxaprine) for 2 to 5 days. Heparin treatment was stopped depending upon PCI results and patient symptomatology.
Echocardiographic evaluation
Echocardiographic examinations (Philip iE33 Ultrasound System) were performed at the same times that blood samples were taken for the measurement of serum BNP. LV systolic function and LV volume were assessed quantitatively to calculate LV ejection fraction (LVEF) using the modified biplane Simpson's method.
LV remodeling was defined as >20% increase in biplane LV end-diastolic volume (LVEDV) on day-180 compared to baseline day-2. Patients were divided into a LV remodeling group [LVR (+)] and a LV non-remodeling group [LVR (-)] based on the 6-month changes in LVEDV. Both clinical and laboratory data were compared.
Statistical analysis
All results were expressed as mean ± SD. Univariate analysis was performed using the Student's t-test. Categorical data were compared against a chi-squared distribution. Spearman's rank correlation coefficients were calculated in order to test the association between variables. Binary logistic regression analysis was used to determine independent variables for LV remodeling. The predictive value of parameters for detecting LV remodeling was assessed using receiver-operating characteristic (ROC) analysis, identifying the cut-point value that maximized sensitivity and specificity. Serial changes in BNP, LVEDV, and LVEF were calculated for the two groups and compared using repeated measures ANOVA. A P value < 0.05 was considered significant.
Results
A total of 110 patients were initially enrolled. Four died before the 6-month echocardiography evaluation could be completed. Three of these patients had a cardiac death, one on day-38, another on day-92 and the other day-152. The fourth one had a non-cardiac death on day-79. Nine patients did no complete clinical follow-up. Thus, we were left with 97 patients who completed the half year study and received all clinical, laboratory, and echocardiographic assessments. Based on their 6-month echocardiographic findings, these patients were divided into either a LV remodeling group [LVR(+), n = 24] or a LV non-remodeling group [LVR(-), n = 73] (Fig. 1).
As can be seen in Table 1, a summary of clinical characteristics of the between LVR(+) and LVR(-) groups at baseline, there were significant differences in age, door-to-balloon time, symptom-to-balloon time, and STEMI prevalence between the two groups. The LVR(+) group was older than the LVR(-) group (65.5 ± 12.0 vs. 59.8 ± 12.4, P = 0.05). The two groups also had significantly different door-to-balloon (D-to-B) times in hours (7.8 ± 18.1 vs. 20.4 ± 30.6, P = 0.018) and symptom onset-to-balloon (S-to-B) times in hours (13.6 ± 22.3 vs. 29.1 ± 35.0, P = 0.015).
Baseline characteristics in LV remodeling and non LV remodeling groups.
| Variables | LVR(+), n = 24 | LVR(-), n = 73 | P |
|---|---|---|---|
| Age Male | 65.5 ± 12.0 19 (79.2%) | 59.8 ± 12.4 67 (91.8%) | 0.050 0.091 |
| Body surface area (m2) | 1.7 ± 0.2 | 1.8 ± 0.2 | 0.501 |
| Body mass index (kg/m2) | 24.7 ± 3.9 | 25.2 ± 3.7 | 0.602 |
| Systolic blood pressure (mmHg) | 153.5± 26.8 | 157.3± 29.9 | 0.577 |
| Heart rate (bpm) | 74.8 ± 19.4 | 73.9 ± 16.1 | 0.814 |
| D-to-B (hour) | 7.8 ± 18.1 | 20.4 ± 30.6 | 0.018 |
| S-to-B (hour) | 13.6 ± 22.3 | 29.1 ± 35.0 | 0.015 |
| STEMI | 17 (70.8%) | 42 (57.5%) | 0.247 |
| Hypertension | 14 (58.3%) | 43 (58.9%) | 0.961 |
| Diabetes mellitus | 7 (29.2%) | 21 (28.8%) | 0.970 |
| Smoking | 12 (50.0%) | 43 (58.9%) | 0.445 |
| Coronary artery disease history | 0 (0%) | 6 (8.2%) | 0.147 |
| Chronic obstructive pulmonary disease | 0 (0%) | 3 (4.1%) | 0.313 |
| Peripheral vascular disease | 1 (4.2%) | 1 (1.4%) | 0.403 |
| Old stroke | 0 (0%) | 4 (5.5%) | 0.242 |
| Hyperlipidemia | 8 (33.3%) | 25 (34.2%) | 0.935 |
| Renal insufficiency | 2 (8.3%) | 4 (5.5%) | 0.615 |
| Moderate-to-severe MR | 0 (0 %) | 2 (2.9%) | 0.445 |
| Medication | |||
| ACEI or ARB | 9 (37.5%) | 33 (45.2%) | 0.509 |
| Beta-blocker | 15 (62.5%) | 37 (50.7%) | 0.314 |
| Statin | 16 (66.7%) | 52 (71.2%) | 0.672 |
| Diuretic | 0 (0%) | 0 (0%) | NA |
| Aldactone | 0 (0%) | 0 (0%) | NA |
D-to-B: door-to-balloon time; S-to-B: symptom-onset-to-balloon time; STEMI: ST-segment elevation myocardial infarction; ACEI: angiotensin converting enzyme inhibitor; ARB: angiotensin receptor blocker; MR: mitral regurgitation; NA: non-assessment.
Table 2 summarizes the coronary artery characteristics and PCI characteristics of the two groups. More bare-metal stents and less drug-eluting stents were deployed among those in the LVR(+) group than among those in the LVR(-) group (P = 0.012). Procedural success rate was 100%. Patients in both groups had similar angiographic characteristics, syntax score and stent sizes. There was no significant difference in clinical severity (Killip class) between the two groups.
Characteristics of coronary artery and percutaneous coronary interventions.
| Variable s | LVR(+), n = 24 | LVR(-), n = 73 | P |
|---|---|---|---|
| Target Vessel LM | 0 (0%) | 1 (1.4%) | 0.296 |
| LAD | 8 (33.3%) | 39 (53.4%) | |
| LCX | 3 (12.5%) | 8 (11.0%) | |
| RCA | 13 (54.2%) | 25 (34.2%) | |
| TV characteristics | 0.403 | ||
| A or B1 | 1 (4.2 %) | 1 (1.4%) | |
| B2 or C | 23 (95.8%) | 72 (98.6%) | |
| Coronary artery disease | 0.925 | ||
| 1 vessel disease | 7 (29.2%) | 24 (32.9%) | |
| 2 vessel disease | 11 (45.8%) | 33 (45.2%) | |
| 3 vessel disease | 6 (25.0%) | 16 (21.9%) | |
| Syntax score | 21.7 ± 11.0 | 19.5 ± 10.2 | 0.357 |
| TV stent type* | 0.012 | ||
| BMS | 22 (91.7%) | 43 (58.9%) | |
| DES | 2 (8.3%) | 29 (39.7%) | |
| TV stent size (mm) | 3.3 ± 0.5 | 3.3 ± 0.6 | 0.605 |
| TV stent length | 34.0 ± 13 | 33.5 ± 16.1 | 0.882 |
| Killip Class | 0.867 | ||
| I | 17 (70.8%) | 53 (72.6%) | |
| II | 2 (8.3%) | 7 (9.6%) | |
| III | 1 (4.2 %) | 5 (6.8%) | |
| IV | 4 (16.7%) | 8 (11.0%) |
LM: left main; LAD: left anterior descending artery; LCX: left circumflex artery; RCA: right coronary artery. TV: target vessel; BMS: bare metal stent; DES: drug-eluting stent
* One patient did not accept stent implantation at LVR(-) group.
Laboratory parameters, including BNP, BNP decrease difference (∆BNP), BNP decrease ratio (RBNP), uric acid, peak creatine kinase-MB fraction (CK-MB) level, and peak troponin I level are summarized in Table 3. There was no significant difference in baseline first-week BNP measurements (day-2 and day-7 BNP) between the two groups. However, there was a significant difference in day-90 BNP levels between LVR(+) group and LVR(-) group (208.1 ± 263.7 vs. 82.4 ± 153.7 P = 0.039). Another significant difference was found in peak CK-MB (LVR(+) group 158.8 ± 156.0 vs. LVR(-) group 75.8 ± 98.6, P = 0.023).
Laboratory data including plasma B-type natriuretic peptide (BNP).
| LVR(+), n = 24 | LVR(-), n = 73 | P* | |
|---|---|---|---|
| BNP1 (day 2) (pg/ml) | 342.1 ± 369.5 | 322.0 ± 440.2 | 0.841 |
| BNP2 (day 7) (pg/ml) | 327.8 ± 256.1 | 224.7 ± 305.7 | 0.148 |
| BNP3 (day 90) (pg/ml) | 208.1 ± 263.7 | 82.4 ± 153.7 | 0.039 |
| BNP4 (day 180) (pg/ml) | 200.2 ± 335.1 | 76.6 ± 155.3 | 0.124 |
| ∆BNP12 (pg/ml) | -8.9 ± 248.0 | 90.3 ± 248.7 | 0.099 |
| RBNP12 (%) | -40.5 ± 109.6 | -14.7 ± 179.5 | 0.518 |
| ∆BNP13 (pg/ml) | 110.8 ± 324.3 | 246.7 ± 376.9 | 0.125 |
| RBNP13 (%) | 14.4 ± 92.2 | 69.4 ± 25.9 | <0.001 |
| ∆BNP14 (pg/ml) | 103.9 ± 298.3 | 253.6 ± 420.4 | 0.141 |
| RBNP14 (%) | 18.3 ± 103.2 | 69.3 ± 38.9 | 0.042 |
| Uric acid (mg/dl) | 9.2 ± 15.0 | 6.0 ± 1.4 | 0.296 |
| Peak CK-MB (ng/ml) | 158.8 ± 156.0 | 75.8 ± 98.6 | 0.023 |
| Peak Troponin I (ng/ml) | 12.7 ± 24.5 | 7.1 ± 19.8 | 0.258 |
| hs-CRP (mg/L) | 37.5 ± 44.2 | 33.3 ± 36.2 | 0.662 |
| hs-CRP (6th month) (mg/L) | 4.5 ± 12.3 | 3.9 ± 7.0 | 0.782 |
∆BNP12= BNP1-BNP2: one week BNP decrease difference;
RBNP12=(BNP1-BNP2) x 100/BNP1(%): one week BNP decrease ratio
∆BNP13= BNP1-BNP3: 3-month BNP decrease difference;
RBNP13= (BNP1-BNP3) x 100/BNP1(%): 3-month BNP decrease ratio;
∆BNP14= BNP1-BNP4: 6-month BNP decrease difference;
RBNP14= (BNP1-BNP4) x 100/BNP1(%): 6-month BNP decrease ratio;
CK-MB: creatine kinase-MB; hs-CRP: high-sensitivity C-reactive protein
*P < 0.05 was considered statistically significant.
We calculated the ∆BNP and RBNP. ∆BNP1f was defined as baseline BNP1 - follow-up BNP; RBNP1f (%) was defined as 100 x (baseline BNP1- follow-up BNP)/baseline BNP. The LVR(+) and LVR(-) groups had significant differences in RBNP13 (14.4 ± 92.2 vs. 69.4 ± 25.9, P < 0.001) and RBNP14 (18.3 ± 103.2 vs. 69.3 ± 38.9, P = 0.042), but no significant differences in other laboratory parameters, including ∆BNP12, ∆BNP13, ∆BNP14, RBNP12, uric acid, troponin-I and hs-CRP.
In this study which aimed to identify independent predisposing factors that might predict half-year remodeling, we excluded the half-year exam or its related parameters ∆BNP14 and RBNP14. Prior to multivariate analysis, we studied the correlation between RBNP13 and other variables so that we could eliminate any strongly correlated factors that might mask predicting power of RBNP13. Table 4 shows the correlations between RBNP13 and other BNP variables. RBNP13 significantly correlated with BNP3, ∆BNP12, ∆BNP13 and RBNP12. Therefore, it was chosen over BNP1, BNP2, BNP3 and ∆BNP12 to test the ability of BNP to predict LV remodeling.
Correlation between 3-month plasma B-type natriuretic peptide (BNP) decrease ratio (RBNP13) and single BNP level or derived parameters (Pearson's correlation coefficient).
| BNP1 | BNP2 | BNP3 | ∆BNP12 | RBNP12 | ∆BNP13 | |
|---|---|---|---|---|---|---|
| Pearson's correlation coefficient (ρ) | 0.122 | -0.100 | -0.575* | 0.346* | 0.206* | 0.477* |
| P | 0.228 | 0.325 | <0.001 | <0.001 | 0.041 | <0.001 |
BNP1: day 2 BNP concentration; BNP2: day 7 BNP concentration; BNP3: day 90 BNP concentration; ∆BNP12: one week BNP decrease difference; RBNP12: one week BNP decrease ratio; ∆BNP13: 3-month BNP decrease difference.
* P < 0.05 was considered statistically significant.
Multivariate analysis was used to evaluate all significantly correlated parameters with a P value ≤ 0.05 considered significant. These parameters included age, D-to-B time, S-to-B time, target vessel stent type, peak CK-MB and RBNP13. Two independent predictors of LV remodeling were found: RBNP13 (odds ratio = 0.972 [0.954 - 0.990]; P < 0.001) and peak CK-MB (odds ratio = 1.006 [1.001 - 1.011]; P = 0.015) (Table 5).
Results of multivariate analysis for half year left ventricle remodeling.
| OR | 90% CI | P* | ||
|---|---|---|---|---|
| Age | 1.052 | 0.988-1.121 | 0.112 | |
| D-to-B (hour) | 0.969 | 0.912-1.029 | 0.307 | |
| S-to-B (hour) | 1.019 | 0.973-1.066 | 0.429 | |
| TV stent type (DES vs. BMS) | 4.392 | 0.624-30.915 | 1.000 | |
| Peak CK-MB (ng/ml) | 1.006 | 1.001-1.011 | 0.015 | |
| RBNP13 | 0.970 | 0.954-0.987 | <0.001 | |
OR: odds ratio; CI: confidence interval; S-to-B: symptom-onset-to-balloon time; TV: target vessel; BMS: bare-metal stent; DES: drug-eluting stent; NSTEMI: Non ST-segment elevation myocardial infarction; STEMI: ST-segment elevation myocardial infarction.
* P < 0.05 was considered significant.
Table 6 showed the serial measurement of echocardiographic parameters including LVEDV, end-systolic volume (ESV) and EF. Because the cut-off value of two LV remodeling groups was defined by the serial change of LVEDV, the multivariate analysis did not include these parameters even with significant differences by independent T test. The different presentation of echocardiographic measurement was shown both on the table and following figures. Most patients had preserved EF (EF ≥ 40%) and only 3 patients had impaired EF (EF < 40%) at baseline measurement.
Serial measurements of echocardiographic parameters during half year.
| Variables | LVR(+), n = 24 | LVR(-), n = 73 | P |
|---|---|---|---|
| Ejection fraction (%) | |||
| Baseline | 55.7 ± 10.1 | 58.1 ± 9.1 | 0.279 |
| One week | 55.1 ± 9.3 | 60.6 ± 8.3 | 0.014 |
| Day 90 | 57.6 ± 9.9 | 62.7 ± 8.2 | 0.014 |
| Day 180 | 55.9 ± 8.5 | 62.8 ± 8.4 | 0.002 |
| Left ventricular end-diastolic volume (ml) | |||
| Baseline | 86.1 ± 21.4 | 109.5 ± 28.0 | < 0.001 |
| One week | 103.6 ± 26.1 | 108.0 ± 26.8 | 0.488 |
| Day 90 | 115.0 ± 30.7 | 105.5 ± 27.0 | 0.153 |
| Day 180 | 126.5 ± 35.4 | 103.5 ± 26.8 | 0.001 |
| Left ventricular end-systolic volume (ml) | |||
| Baseline | 38.8 ± 14.7 | 46.1 ± 16.3 | 0.053 |
| One week | 46.9 ± 19.4 | 43.0 ± 16.9 | 0.352 |
| Day 90 | 49.5 ± 21.2 | 40.4 ± 17.3 | 0.034 |
| Day 180 | 57.7 ± 27.5 | 39.0 ± 14.5 | < 0.001 |
Repeated-measures analyses of variance (ANOVA) were used to examine patterns of serial plasma B-type natriuretic peptide (BNP) change over the half year (Fig. 2). Pair comparisons revealed significant within-subject effects with regard to BNP 1 vs. BNP3 (P < 0.001) and BNP 1 vs. BNP4 (P < 0.001). In our comparison of BNP changes between the LVR(+) and LVR(-) groups, we found a significant difference at day 90 (P < 0.001) and day 180 (P =0.002), though we found no interaction and significant between-subjects effects (P = 0.105) among the members of these two groups.
Serial plasma B-type natriuretic peptide (BNP) change in the LV remodeling [LVR(+)] and non LV remodeling [LVR(-)] groups. (A) Pair comparisons showed significant difference between BNP1 vs. BNP3 and BNP4, respectively. (B) The BNP level of the two groups showed significant between-subject differences on day 90 and day 180. The serial BNPs were presented as mean ± standard error. *p < 0.05 between remodeling and no-remodeling group.
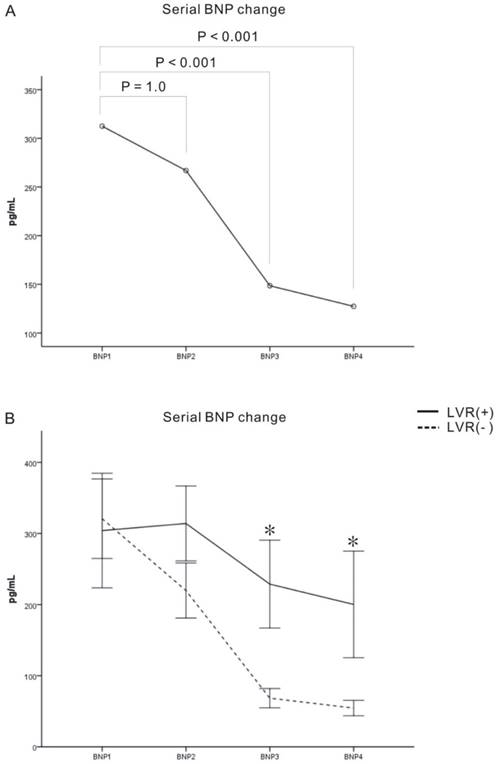
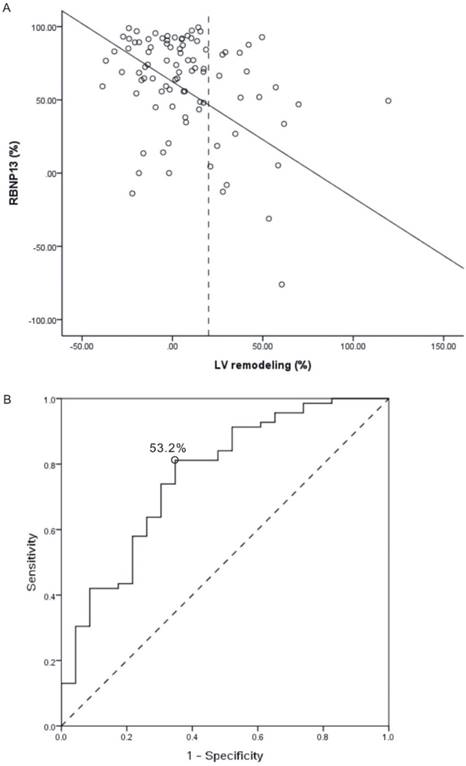
Figure 3 shows the correlation between change in 6-month LVEDV dilatation ratio [LV remodeling (%)] and RBNP13 in all 97 patients (Fig. 3A: P < 0.001; R2 = 0.150). The ROC method was used to determine the appropriate cut-off point of RBNP13 (53.2%) (Fig. 3B: area under the curve [AUC] = 0.764; P < 0.001). Those patients with RBNP13 more than 53.2% had low risk for developing half-year LV remodeling, otherwise patients with RBNP13 less than 53.2% had potential risk of half-year LV remodeling. The sensitivity of this cut-off value was 81.2% and the specificity was 60.9%. The positive predictive value was 53.6% and negative predictive value 87.5%.
(A) Relationship between 6-month left ventricular (LV) dilatation ratio [LV remodeling (%)] and 3-month plasma B-type natriuretic peptide (BNP) decrease ratio [RBNP13 (%)] in patients with AMI (P < 0.001, R2 = 0.219, decrease in RBNP13 = 57.64-1.01 x LV remodeling). The intersection of LV dilatation ratio at 20% defines a cut-point for LV remodeling. (B) Receiver operating characteristics curve to predict development of half-year LV remodeling by RBNP13 (Cut-off value of RBNP13 = 53.2%, AUC = 0.764, P < 0.001). AUC: area under the curve.
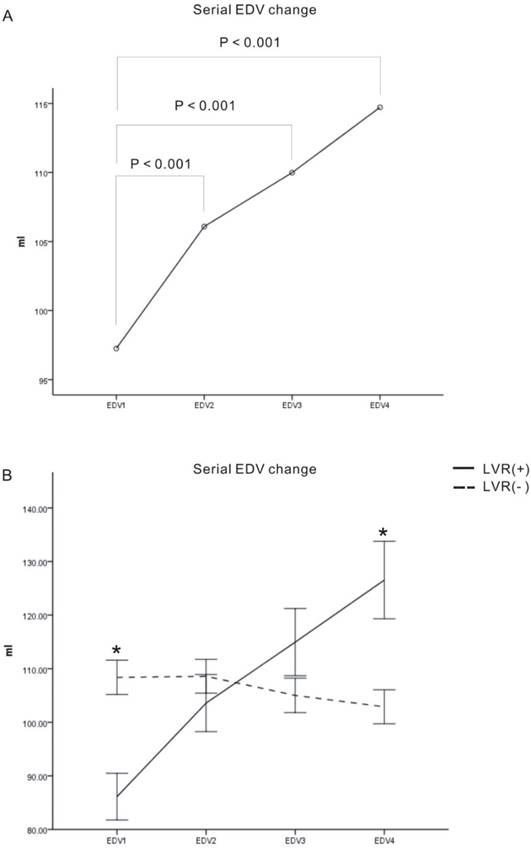
LVEDVs and LVEFs were calculated on the same days as that samples were taken for BNP measurements. Repeated-measures ANOVA revealed significant within-subject effects for EDV (EDV1 vs. EDV2, EDV1 vs. EDV3, and EDV1 vs. EDV4, all P<0.001) (Fig. 4A). The serial change in EDV significantly interacted with LV remodeling (Fig. 4B, P < 0.001), though we found no significant between-subject effect verification (Fig. 4B, P = 0.786). The LVR(+) group had a lower initial EDV and a higher half-year EDV than LVR(-) group (P < 0.001 and P = 0.001, respectively).
Serial changes in end diastolic volume (EDV). (A) Serial levels of EDV on day-2 (EDV1), day-7 (EDV2), day-90 (EDV3), and day-180 (EDV4) (unit: ml). Pair comparisons showed significant difference between EDV1 vs. EDV2, EDV3 and EDV4, respectively. (B) The LVR(+) group had a lower initial EDV (EDV1) and a higher half-year EDV (EDV4) than the LVR(-) group. The serial EDVs were presented as mean ± standard error. *p < 0.05 between remodeling and no-remodeling group.
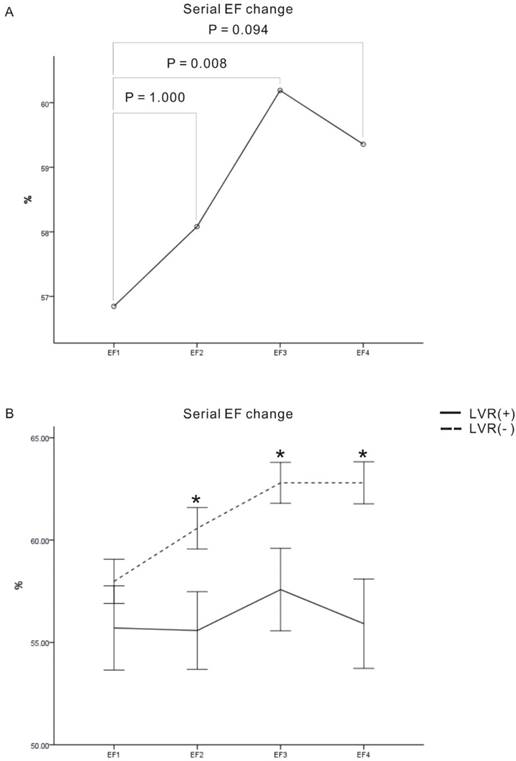
Serial LVEFs comparisons revealed a significant within-subject difference between EF1 and EF3 (Fig 5A: P = 0.008) and a significant between-subject difference when comparing the LVR(+) and LVR(-) groups (Fig 5B, P = 0.007). The LVR (-) group had a better EF than LVR(+) group over the half year follow-up period (EF2: P = 0.017, EF3: P = 0.013, EF4: P = 0.002, respectively). There was no significant interaction between serial LVEF change and LV remodeling.
Serial changes in left ventricle ejection fraction (EF). (A) Serial levels of EF on day-2 (EF1), day-7 (EF2), day-90 (EF3), and day-180 (EF4) (unit: %). Pair comparisons showed significant difference among EF1 and EF3. (B) There were significant between-subject differences in EF2, EF3 and EF4. The serial EFs were presented as mean ± standard error. *p < 0.05 between remodeling and no-remodeling group.
Early parameter analysis during the first week
In an attempt to identify an early prognostic marker the first week after AMI, we performed multivariate analysis of age, D-to-B time, S-to-B time, target vessel stent type and peak CK-MB. Only the peak CK-MB time was found to be an independent predictor for half year LV remodeling (P = 0.015). The ROC method was used to determine the appropriate peak CK-MB cut-off point, which was 48.2 ng/ml (Fig. 6A: AUC = 0.672, P = 0.014). No other parameters were found to have a significant influence in our group comparisons.
(A). Receiver operating characteristics curve to predict development of half-year LV remodeling by peak CK-MB: Cut-off value of peak CK-MB = 48.2 (AUC = 0.672, P = 0.014) and combined probability derived from peak CK-MB and 3-month plasma B-type natriuretic peptide decrease ratio (RBNP13) (AUC = 0.818, P < 0.001). (B). Peak CK-MB offers additional information over RBNP13. AUC: area under the curve.
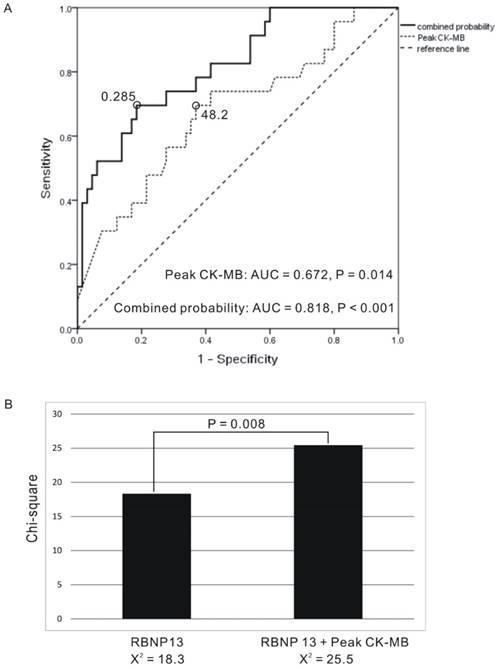
In our logistic regression analysis, we combine RBNP13 and peak CK-MB and calculated risk of LV remodeling risk as follows: Exp (- 0.155) + 0.006 × peak CKMB - 0.03 × RBNP13. This risk equation provided excellent discrimination for half-year LV remodeling and the appropriate cut-off value was 0.285 (Fig. 6A: AUC = 0.818, P < 0.001). Those patients with calculated combined result more than 0.285 had low risk for developing half-year LV remodeling, and patients with calculated result less than 0.285 had high risk of half-year LV remodeling. The positive predictive value was 57.1% and negative predictive value was 88.3%. The initial peak CK-MB level had incremental predicting power (Fig. 6B: P = 0.008).
Discussion
This study discovered that the RBNP13 derived from serial BNP measurements can be used as an independent predictor for half year LV remodeling, supporting the use of serial BNP measurements for dynamic risk stratification for all AMI patients. It also found that peak CK-MB had incremental power to these predictions and thus should be routinely monitored in AMI patients.
Progressive ventricular dilation after acute myocardial infarction can be a main determinant of a patient's prognosis. While previous studies have suggested that early plasma BNP levels can predict short- and long-term prognosis of patients with AMI. [2-6], most of those studies have focused on the anterior wall MI, [3, 4] or studied this relationship in STEMI patients only. [2, 5, 6]
Previous studies have also found that natriuretic peptide values provide information related to outcomes. [7-9] One study suggested that an additional BNP level drawn at 7 weeks post-acute coronary syndrome improved risk stratification. [7] In that study, patients with persistently elevated BNP levels ( > 80pg/ml ) had a 4-fold increased risk for developing cardiovascular events at 10 months compared to those with persistently low BNP levels.
This study found RBNP13 to have good differential power in predicting half year remodeling even in our small subgroup populations. If the enrolled patients were further subdivided into STEMI and NSTEMI subgroups, the RBNP13 was found to be a significant predictor of LV remodeling in both the STEMI subgroup (P = 0.015) and the NSTEMI subgroup (P = 0.003).
Studies using cardiac magnetic resonance imaging have reported peak CK-MB to be an independent predictor for infarct size, LV dysfunction and 1-year clinical outcomes. [10, 11], though one study in which all patients received primary coronary interventions found that peak CK-MB could independently predict LV remodeling. [12] The current study found that the peak CK-MB values could independently but not strongly predict half year LV remodeling. In our subgroup analysis, peak CK-MB was found to acceptably discriminate remodeling LV from non-remodeling LV in non-STEMI patients (P = 0.022) but not in STEMI patients (P = 0.142). However, this parameter enhanced the predictive power of serial BNP examination incrementally. The ROC curve of combined RBNP13 and peak CK-MB has excellent discrimination for half year remodeling.
Reduction in door-to-balloon time has been shown to be positive prognostic indicator. [13] Both animal studies [14] and clinical studies [15-17] suggest that shortening the duration of arterial occlusion caused by infarcts can reduce can infarct sizes and lower cardiac mortality. Time from symptom onset to reperfusion has been documented as an independent predictor of LV functional recovery. [17] However, although both door-to-balloon times and symptom-to-balloon times were significantly different between LVR(+) and LVR(-) group, there parameters were not found in our multivariate analysis to have independent significant predictive power for LV remodeling.
Limitations
Our study has several limitations. Unlike previous studies [2, 5], we did not find that early first-week BNP concentrations (BNP1 and BNP2) to be prognostic indicators. This difference may have been due to the fact that all AMI patients of our study (including STEMI and NSTEMI) were analyzed together. In addition, our patient population was small (97 patients including both STEMI and NSTEMI patients) and thus it might not have been able to demonstrate prognostic significance in the early single BNP blood tests and the S-to-B time, both considered important initial parameters [2, 5, 16]. Another limitation is that, although 110 patients were initially enrolled in this study, nine of our patients died before the 6-month echocardiography evaluation and thus we could not determine predictors of mortality. Nighty-four patients had preserved EF (EF ≥ 40%) and only 3 patients had impaired EF (EF < 40%) at baseline measurement. It means that the study did not enrolled patient with severe heart failure and it could only offered the evidence for patients with EF more than 40%. Future studies with longer evaluation times and larger patient populations are, therefore, needed to demonstrate the effects of BNP levels, S-to-B times, and other parameters on mortality due to AMI.
Conclusions
In this study, after multivariate adjustment of clinical, laboratory, and angiographic variables, RBNP13 remained a significant independent predictor of 6-month LV remodeling (odds ratio = 0.967, P = 0.003). The appropriate cut-off value of RBNP13 was 53.2% (AUC = 0.764, P < 0.001). If the RBNP13 was less than 53.2%, the risk of half year LV remodeling increased. In contrast, the risk of half year remodeling decreased if the RBNP13 was more than 53.2%. It has high negative predictive value of 87.5% and moderate positive predictive value of 53.6%. The early peak CK-MB offered an incremental predictive power to serial BNP examination. By combing these two parameters, The ROC curve offered a good discrimination for half-year remodeling (AUC = 0.818, P < 0.001).
Acknowledgements
This study was supported by grant CMPG6A0141-43 from Chang Gung Memorial Hospital.
Competing Interests
The authors have declared that no competing interest exists.
References
1. Sutton MGSJ, Sharpe N. Left Ventricular Remodeling After Myocardial Infarction: Pathophysiology and Therapy. Circulation. 2000;101(25):2981-8 doi: 10.1161/01.cir.101.25.2981
2. Nagaya N, Nishikimi T, Goto Y, Miyao Y, Kobayashi Y, Morii I. et al. Plasma brain natriuretic peptide is a biochemical marker for the prediction of progressive ventricular remodeling after acute myocardial infarction. American heart journal. 1998;135(1):21-8
3. White M, Rouleau JL, Hall C, Arnold M, Harel F, Sirois P. et al. Changes in vasoconstrictive hormones, natriuretic peptides, and left ventricular remodeling soon after anterior myocardial infarction. American heart journal. 2001;142(6):1056-64 doi: 10.1067/mhj.2001.119612. PubMed PMID: 11717612
4. Shuichi T, Satoru S, Takeshi B, Hiroshi T, Naohiko A, Yoshio Y. et al. Predictors of left ventricular remodeling in patients with acute myocardial infarction participating in cardiac rehabilitation. Circulation journal: official journal of the Japanese Circulation Society. 2004;68(3):214-9
5. Garcia-Alvarez A, Sitges M, Delgado V, Ortiz J, Vidal B, Poyatos S. et al. Relation of plasma brain natriuretic peptide levels on admission for ST-elevation myocardial infarction to left ventricular end-diastolic volume six months later measured by both echocardiography and cardiac magnetic resonance. The American journal of cardiology. 2009;104(7):878-82 doi: 10.1016/j.amjcard.2009.05.025. PubMed PMID: 19766750
6. Dorobantu M, Fruntelata A-G, Scafa-Udriste A, Tautu O-F. B-type natriuretic peptide (BNP) and left ventricular (LV) function in patients with ST-segment elevation myocardial infarction (STEMI). Mædica. 2010;5(4):243
7. Ang DS, Kong CF, Kao MP, Struthers AD. Serial bedside B-type natriuretic peptide strongly predicts prognosis in acute coronary syndrome independent of echocardiographic abnormalities. American heart journal. 2009;158(1):133-40 doi: 10.1016/j.ahj.2009.04.024. PubMed PMID: 19540403
8. Kubánek M, Goode KM, Lánská V, Clark AL, Cleland JG. The prognostic value of repeated measurement of N-terminal pro-B-type natriuretic peptide in patients with chronic heart failure due to left ventricular systolic dysfunction. European journal of heart failure. 2009;11(4):367-77
9. Januzzi JL, Rehman SU, Mohammed AA, Bhardwaj A, Barajas L, Barajas J. et al. Use of amino-terminal pro-B-type natriuretic peptide to guide outpatient therapy of patients with chronic left ventricular systolic dysfunction. Journal of the American College of Cardiology. 2011;58(18):1881-9
10. Dohi T, Maehara A, Brener SJ, Généreux P, Gershlick AH, Mehran R. et al. Utility of peak creatine kinase-MB measurements in predicting myocardial infarct size, left ventricular dysfunction, and outcome after first anterior wall acute myocardial infarction (from the INFUSE-AMI trial). The American journal of cardiology. 2015;115(5):563-70
11. Mayr A, Mair J, Klug G, Schocke M, Pedarnig K, Trieb T. et al. Cardiac troponin T and creatine kinase predict mid-term infarct size and left ventricular function after acute myocardial infarction: a cardiac MR study. Journal of Magnetic Resonance Imaging. 2011;33(4):847-54
12. Petronio AS, De Carlo M, Ciabatti N, Amoroso G, Limbruno U, Palagi C. et al. Left ventricular remodeling after primary coronary angioplasty in patients treated with abciximab or intracoronary adenosine. American heart journal. 2005;150(5):1015.1 e9
13. Cannon CP, Gibson CM, Lambrew CT, Shoultz DA, Levy D, French WJ. et al. Relationship of symptom-onset-to-balloon time and door-to-balloon time with mortality in patients undergoing angioplasty for acute myocardial infarction. JAMA: the journal of the American Medical Association. 2000;283(22):2941-7
14. Reimer KA, Lowe J, Rasmussen M, Jennings R. The wavefront phenomenon of ischemic cell death. 1. Myocardial infarct size vs duration of coronary occlusion in dogs. Circulation. 1977;56(5):786-94
15. Sheiban I, Fragasso G, Rosano GM, Dharmadhikari A, Tzifos V, Pagnotta P. et al. Time course and determinants of left ventricular function recovery after primary angioplasty in patients with acute myocardial infarction. Journal of the American College of Cardiology. 2001;38(2):464-71
16. De Luca G, Suryapranata H, Zijlstra F, van't Hof AWJ, Hoorntje JCA, Gosselink ATM. et al. Symptom-onset-to-balloon time and mortality in patients with acute myocardial infarction treated by primary angioplasty. Journal of the American College of Cardiology. 2003;42(6):991-7 doi: 10.1016/s0735-1097(03)00919-7
17. Parodi G, Memisha G, Carrabba N, Signorini U, Migliorini A, Cerisano G. et al. Prevalence, predictors, time course, and long-term clinical implications of left ventricular functional recovery after mechanical reperfusion for acute myocardial infarction. The American journal of cardiology. 2007;100(12):1718-22 doi: 10.1016/j.amjcard.2007.07.022. PubMed PMID: 18082514
Author contact
![]() Corresponding author: Ju-Feng Hsiao, MD. Department of Cardiology, Chiayi Chang Gung Memorial Hospital, Address: 6, Sec. West Chai-Pu Road, Pu-Tz City, Chai Yi Hsien, Taiwan. Tel: 886-5-3621000 Ext 2854; FAX: 886-5-3623005; E-mail: likeandwindcom.
Corresponding author: Ju-Feng Hsiao, MD. Department of Cardiology, Chiayi Chang Gung Memorial Hospital, Address: 6, Sec. West Chai-Pu Road, Pu-Tz City, Chai Yi Hsien, Taiwan. Tel: 886-5-3621000 Ext 2854; FAX: 886-5-3623005; E-mail: likeandwindcom.