Impact Factor ISSN: 1449-1907
- Issue 8; 2026
- Issue 7; 2026
- Issue 6; 2026
- Issue 5; 2026
- Issue 4; 2026
- Volume 23; 2026
- Past Issues
- Editorial Board
- Cover Images
- Index & Coverage
- Cover Suggestion
- Special Issues
Introduction
Materials and methods
Results
Discussion
Conclusions
Abbreviations
Acknowledgements
References

 Global reach, higher impact
Int J Med Sci 2016; 13(5):395-402. doi:10.7150/ijms.14259 This issue Cite
Research Paper
Glycated Albumin Predicts Long-term Survival in Patients Undergoing Hemodialysis
Chien-Lin Lu1,2,*, Wen-Ya Ma2, Yuh-Feng Lin1,3, Jia-Fwu Shyu4, Yuan-Hung Wang1,5, Yueh-Min Liu2, Chia-Chao Wu6,*, Kuo-Cheng Lu2,6 ![]()
1. Graduate Institute of Clinical Medicine, College of Medicine, Taipei Medical University, Taipei, Taiwan.
2. Department of Medicine, Cardinal Tien Hospital, School of Medicine, Fu Jen Catholic University, New Taipei City, Taiwan.
3. Division of Nephrology, Department of Internal Medicine, Shuang Ho Hospital, Taipei Medical University, Taiwan
4. Department of Biology and Anatomy, National Defense Medical Center, Taipei, Taiwan
5. Department of Medical Research, Shuang Ho Hospital, New Taipei City, Taiwan
6. Division of Nephrology, Department of Medicine, Tri-Service General Hospital, National Defense Medical Center, Taipei, Taiwan.
* These authors have contributed equally to this work.
Received 2015-10-29; Accepted 2016-4-21; Published 2016-5-10
Abstract
Background: In patients with advanced renal dysfunction undergoing maintenance hemodialysis, glycated albumin (GA) levels may be more representative of blood glucose levels than hemoglobin A1C levels. The aim of this study was to determine the predictive power of GA levels on long-term survival in hemodialysis patients.
Methods: A total of 176 patients with a mean age of 68.2 years were enrolled. The median duration of follow-up was 51.0 months. Receiver-operating characteristic curve analysis was utilized to determine the optimal cutoff value. We examined the cumulative survival rate by Kaplan-Meier estimates and the influence of known survival factors with the multivariate Cox proportional-hazard regression model.
Results: In the whole patient group, cumulative survival in the low GA group was better than in the high GA group (p=0.030), with more prominence in those aged <70 years (p=0.029). In subgroup analysis, both diabetic (DM) and non-DM patients with low GA had a better cumulative survival compared with those with high GA. The risk of mortality increased by 3.0% for each 1% increase in serum GA level in all patients undergoing hemodialysis.
Conclusions: In addition to serving as a glycemic control marker, GA levels may be useful for evaluating the risk of death in both DM and non-DM patients on hemodialysis.
Keywords: Glycated albumin, hemodialysis, mortality
Introduction
Diabetes mellitus (DM) is the leading cause of chronic kidney disease (CKD) in Taiwan and is highly associated with cardiovascular morbidity and mortality. Strict glycemic control is beneficial in preventing complications such as diabetic nephropathy and mortality in patients without kidney disease, but it is unclear whether these benefits extend to patients with advanced CKD. Currently, there are no specific guidelines for direct glycemic therapy in these patients. Levels of hemoglobin A1C (HbA1C) have been used instead of blood glucose levels to screen for DM in the general population because it is an easily measured, long-term glycemic concentration marker that is associated with clinical outcome. However, in the CKD population, HbA1C is a less predictable marker because of the shorter red blood cell lifespan, use of erythropoietin injections and vitamins C and E, and presence of hypertriglyceridemia [1]. Previous studies revealed that HbA1C levels tend to be lower in patients with CKD; thus, glycated albumin (GA) levels may be more representative of blood glucose levels in patients with advanced renal dysfunction [2, 3].
GA is a ketamine-formed substance that is nonenzymatically produced from the reaction of albumin with glucose by means of an Amadori rearrangement [4]. It reflects the mean blood glucose level of the previous 2-3 weeks [5] and is not influenced by short-term fluctuations in blood glucose levels, erythrocyte lifespan, or erythropoietin therapy. GA is considered an intermediate-term index of glycemic control. We previously reported that increased GA concentrations are independently associated with renal dysfunction in non-DM patients with CKD, which suggests that the inflammatory status present in patients with CKD may play an important role in determining serum GA levels [6]. When patients with CKD enter into dialysis therapy, which is associated with increased oxidative stress, this oxidative stress is further complicated by dialysis, which activates phagocytes, releases oxygen radicals, causes peroxidation of lipids, and ultimately depletes patient's protections against antioxidants [4, 6].
Our objective was to explore the association between glycemic indices and clinical outcome in patients undergoing hemodialysis. To do so, we measured GA levels in patients undergoing chronic dialysis and examined the predictive ability of GA levels on long-term mortality.
Materials and methods
Patients
From May 2009 to September 2014, 176 patients undergoing maintenance hemodialysis for >3 months at Cardinal Tien Hospital (Taiwan) were enrolled in our study. The enrolled participants comprised 81 men and 95 women. The median duration of follow-up was 51.0 months (mean 45.3 ± 17.8 months, range 2-61.8 months). The duration of hemodialysis was 8.86 ± 4.5 (range 4-24) years. We excluded patients who had a history of chronic liver disease and hypothyroidism had previously undergone a renal transplant, and those who had switched to peritoneal dialysis (PD).
Clinical and laboratory parameters
Clinical and demographic characteristics of the patients including age, gender, and duration of hemodialysis were obtained from medical records. Each patient was interviewed face-to-face at the time of enrollment about cigarette smoking status and alcohol consumption. Individuals who had not smoked more than 100 cigarettes in their lifetime were classified as never-smokers based on common conventions in epidemiologic research. The pattern of alcohol consumption, including the frequency of drinking days and number of drinks consumed in a day, was recorded. Patients who drank a bottle of alcoholic beverages (including beer, rice beer, and sorghum liquor) or more per month for at least 1 year were defined as ever drinkers. Current and former smokers were grouped together in the smoker's group, and their data were compared with those of individuals in the never-smoker's group. The ever drinker's group was compared with individuals in the nondrinker group.
Body weight was used to calculate body mass index (BMI). All of the participants with DM met the diagnostic criteria set forth by the American Diabetes Association; that is, patients with fasting glucose levels ≥ 126 mg/dL (7.0 mmol/L) or 2-h plasma glucose ≥ 200 mg/dL (11.1 mmol/L) after a 75-g oral glucose loading test or a patient with HbA1C ≥ 6.5%. Systolic blood pressure and diastolic blood pressure were measured while the patient was in the supine position after a 10-15 minute rest. The definition of hypertension was based on the Seventh Joint National Committee as systolic blood pressure before dialysis of ≥ 140 mmHg. The GA sample was collected on 3 occasions from May to November 2009 and the 3-month average values were used for each patient, which may reflect the short-term glucose control on the prediction of long-term clinical outcome. Blood samples were collected after overnight fasting and stored at -20 °C until analysis. Concentrations of plasma glucose, serum albumin, blood urea nitrogen (BUN), creatinine, total cholesterol, triglycerides, glutamic-oxaloacetic transaminase, glutamic-pyruvic transaminase, and hemoglobin were measured with an automatic chemistry analyzer (Synchron LXi-725; Beckman Coulter Inc., Brea, CA, USA). The Kt/Vurea value was calculated with the Daugirdas equation: [-ln(Ratio-(0.03)] + [(4-(3.5 * Ratio)] × (ultrafiltrate volume/weight), where the ratio represents post-/pre-dialysis BUN value. The serum GA measurement was described previously [6].
Statistical analysis
Continuous variables are expressed as means and standard deviation. Normal distribution was evaluated by the Kolmogorov-Smirnov test and Shapiro-Wilk test. Means and standard deviations are presented for normally-distributed data, and medians are presented for non-normally-distributed data. For continuous variables, the Student's t-test was used for independent samples with normally-distributed values and the Mann-Whitney U-test was performed for values without normal distribution. For categorical variables, chi-square test and Fisher's exact test were used.
Survival curves were obtained using the Kaplan-Meier estimation method and compared by log-rank test. Cox proportional hazard models for censored survival data were used to assess the association between various clinical data and time of death. Confounding factors were included in multivariate models if they showed significant associations in univariate analysis or there was clinical evidence of a relationship with the risk of mortality. A two-tailed p value of <0.05 was considered statistically significant. All analyses were performed with IBM SPSS Statistics version 20.0 (SPSS Inc., Chicago, Ill., USA) and Stata/SE 10.0 (StataCorp LP, College Station TX) for Windows.
Ethics statement
This study was approved by the Human Ethical Committees of Cardinal Tien Hospital. The approval number was CTH-97-3-5-059. Written informed consent was obtained from all patients.
Results
Of the 176 patients originally enrolled in the study, 109 (61.9%) died. The patients who died were older and had a short duration of hemodialysis, low serum albumin levels, low dialysis efficiency (Kt/Vurea), and high GA levels (Table 1). Compared to the non-DM group, patients with DM had longer duration of hemodialysis, higher incidence of acute myocardial infarction and systolic blood pressure events before dialysis, lower serum albumin levels, and higher blood glucose and GA levels (Table 2). All patients on hemodialysis were divided into two groups according to their median GA level at the time of enrollment; low (GA ≥ 16.4%) or high (GA < 16.4%). The characteristics of these two groups are summarized in Table 3. In patients with a higher level of glycation, hemodialysis duration was shorter and both the pre-dialysis systolic blood pressure and dialysis efficiency were higher. The strength of this study was the 100% follow-up rate. Additionally, the survival status in these hemodialysis patients was checked through the “TSN KiDiT (Taiwan Society of Nephrology; Kidney Dialysis, Transplantation)” registration system.
Clinical characteristics of hemodialysis patients stratified by survival status.
| Characteristics | Survival (n = 67) | Mortality (n = 109) | p value |
|---|---|---|---|
| Age (years) | 62.61 ± 14.06 | 71.67 ± 15.45 | <0.01‡* |
| Age < 70 | 49 (73.1%) | 46 (42.2%) | 0.06# |
| Male | 28 (44.4%) | 51 (46.8%) | 0.77# |
| BMI (kg/m2) | 22.34 ± 3.42 | 22.11 ± 4.27 | 0.70† |
| HD duration (years) | 9.93 ± 5.15 | 8.20 ± 3.96 | 0.02‡* |
| Current smoking | 12 (17.9%) | 17 (15.6%) | 0.69# |
| Ever drinking | 6 (9.0%) | 2 (1.8%) | 0.06! |
| DM | 31 (46.3%) | 63 (57.8%) | 0.13# |
| Hypertension | 56 (83.6%) | 96 (88.1%) | 0.40# |
| Stroke | 51 (76.1%) | 93 (85.3%) | 0.12# |
| AMI | 6 (9.0%) | 9 (8.3%) | 0.87# |
| Pre-dialysis SBP (mmHg) | 148.06 ± 27.05 | 145.27 ± 24.57 | 0.17† |
| GA (%) | 16.85 ± 4.63 | 19.14 ± 6.63 | 0.01‡* |
| Total protein (g/dL) | 6.75 ± 0.61 | 6.67 ± 0.82 | 0.23‡ |
| Albumin (g/dL) | 3.81 ± 0.49 | 3.60 ± 0.56 | < 0.01‡* |
| BUN (mg/dL) | 67.79 ± 16.46 | 65.92 ± 18.23 | 0.49† |
| Creatinine (mg/dL) | 10.25 ± 2.57 | 9.49 ± 2.47 | 0.06‡ |
| Kt/Vurea | 1.57 ± 0.46 | 1.43 ± 0.31 | 0.03‡* |
| Triglyceride (mg/dL) | 137.15 ± 81.72 | 141.19 ± 92.73 | 0.77‡ |
| Total cholesterol (mg/dL) | 176.98 ± 39.23 | 161.51 ± 37.65 | 0.02‡* |
| Blood glucose (mg/dL) | 126.17 ± 52.90 | 136.61 ± 67.22 | 0.29† |
| Hb (g/dL) | 10.10 ± 1.36 | 9.75 ± 1.48 | 0.13† |
| GOT(U/L) | 10.10 ± 1.36 | 9.75 ± 1.48 | 0.15‡ |
| GPT (U/L) | 10.10 ± 1.36 | 9.75 ± 1.48 | 0.51‡ |
| Uric acid (mg/dL) | 6.88 ± 1.09 | 6.78 ± 1.28 | 0.59† |
Values are mean ± standard deviation.
Abbreviations: BMI, body mass index; HD, hemodialysis; DM, diabetes mellitus; AMI, acute myocardial infarction; SBP, systolic blood pressure; GA, glycated albumin; BUN, blood urea nitrogen; Kt/Vurea, dialysis efficiency; Hb, hemoglobin; GOT, glutamic-oxaloacetic transaminase; GPT, glutamic-pyruvic transaminase.
† Student's t-test, ‡ Mann-Whitney U test, # Chi-square test, ! Fisher's exact test *p<0.05
Clinical characteristics of hemodialysis patients stratified by DM and non-DM.
| Characteristics | DM (n = 94) | Non-DM (n = 82) | p value |
|---|---|---|---|
| Age (years) | 69.23 ± 13.10 | 67.06 ± 17.93 | 0.36† |
| Men | 44 (46.8%) | 37 (45.1%) | 0.82# |
| BMI (kg/m2) | 22.55 ± 3.77 | 21.79 ± 4.15 | 0.20† |
| HD duration (years) | 7.18 ± 2.87 | 10.78 ± 5.25 | <0.01‡* |
| Current smoking | 15 (16%) | 14 (17.1%) | 0.84# |
| Ever drinking | 3 (3.2%) | 5 (6.1%) | 0.36! |
| Hypertension | 84 (89.4%) | 68 (82.9%) | 0.22# |
| Stroke | 76 (80.9%) | 68 (82.9%) | 0.72# |
| AMI | 12 (12.8%) | 3 (3.7%) | 0.03!* |
| Pre-dialysis SBP (mmHg) | 152.12 ± 25.76 | 139.68 ± 23.64 | <0.01‡ * |
| GA (%) | 21.40 ± 6.60 | 14.67 ± 2.08 | <0.01‡* |
| Total protein (g/dL) | 6.85 ± 0.68 | 6.54 ± 0.79 | <0.01‡* |
| Albumin (g/dL) | 3.58 ± 0.56 | 3.79 ± 0.50 | 0.02‡* |
| BUN (mg/dL) | 67.26 ± 18.07 | 65.91 ± 17.03 | 0.61‡ |
| Creatinine (mg/dL) | 9.68 ± 2.11 | 9.91 ± 2.93 | 0.86‡ |
| Kt/Vurea | 1.44 ± 0.42 | 1.53 ± 0.32 | 0.02‡* |
| Triglyceride (mg/dL) | 151.89 ± 95.45 | 125.62 ± 77.98 | 0.06‡ |
| Total cholesterol (mg/dL) | 165.06 ± 41.18 | 170.86 ± 36.32 | 0.35† |
| Blood glucose (mg/dL) | 156.78 ± 71.04 | 103.29 ± 29.64 | < 0.01‡* |
| Hb (g/dL) | 9.89 ± 1.38 | 9.88 ± 1.52 | 0.69† |
| GOT (U/L) | 24.73 ± 30.58 | 21.67 ± 13.94 | 0.91‡ |
| GPT (U/L) | 16.59 ± 12.56 | 21.20 ± 30.84 | 0.26‡ |
| Uric acid (mg/dL) | 6.76 ± 1.16 | 6.88 ± 1.27 | 0.80‡ |
Values are mean ± standard deviation.
Abbreviations: BMI, body mass index; HD, hemodialysis; DM, diabetes mellitus; AMI, acute myocardial infarction; SBP, systolic blood pressure; GA, glycated albumin; BUN, blood urea nitrogen; Kt/Vurea, dialysis efficiency; Hb, hemoglobin; GOT, glutamic-oxaloacetic transaminase; GPT, glutamic-pyruvic transaminase.
† Student's t-test, ‡ Mann-Whitney U test, # Chi-square test, ! Fisher's exact test
*p<0.05
Clinical characteristics of hemodialysis patients stratified by median glycated albumin (GA).
| Characteristics | Low-GA (n=88) | High-GA (n = 88) | p value |
|---|---|---|---|
| Age (years) | 66.64 ± 17.96 | 62.61 ± 14.06 | 0.18† |
| Male | 43 (49%) | 38 (43%) | 0.45‡ |
| BMI (kg/m2) | 22.03 ± 4.26 | 22.34 ± 3.42 | 0.58† |
| HD duration (years) | 10.41 ± 5.33 | 9.93 ± 5.15 | <0.01‡* |
| Current smoking | 15 (17%) | 14 (16%) | 0.84# |
| Ever drinking | 5 (6%) | 3 (3%) | 0.72! |
| DM | 19 (22%) | 75 (85%) | <0.01#* |
| Hypertension | 72 (82%) | 80 (91%) | 0.08# |
| Stroke | 74 (84%) | 70 (80%) | 0.43# |
| AMI | 6 (7%) | 9 (10%) | 0.42# |
| Pre-dialysis SBP (mmHg) | 139.85 ± 22.21 | 148.06 ± 27.05 | <0.01‡* |
| GA (%) | 14.24 ± 1.36 | 16.85 ± 4.63 | <0.01‡* |
| Total protein (g/dL) | 6.56 ± 0.80 | 6.75 ± 0.61 | 0.03‡* |
| Albumin (g/dL) | 3.70 ± 0.55 | 3.81 ± 0.49 | 0.54† |
| BUN (mg/dL) | 65.20 ± 16.24 | 67.79 ± 16.46 | 0.23‡ |
| Creatinine (mg/dL) | 10.15 ± 2.87 | 10.25 ± 2.57 | 0.09‡ |
| Kt/Vurea | 1.52 ± 0.29 | 1.57 ± 0.46 | 0.05‡* |
| Triglyceride (mg/dL) | 131.27 ± 80.54 | 137.15 ± 81.72 | 0.27‡ |
| Total cholesterol(mg/dL) | 170.08 ± 37.09 | 176.98 ± 39.23 | 0.26† |
| Blood glucose (mg/dL) | 106.16 ± 32.18 | 126.17 ± 52.90 | <0.01‡* |
| Hb (g/dL) | 9.92 ± 1.57 | 10.10 ± 1.36 | 0.75† |
| GOT(U/L) | 21.18 ± 13.52 | 19.91 ± 12.86 | 0.53‡ |
| GPT (U/L) | 19.74 ± 29.55 | 20.19 ± 32.85 | 0.96‡ |
| Uric acid (mg/dL) | 6.80 ± 1.31 | 6.88 ± 1.09 | 0.79‡ |
Values are mean ± standard deviation.
Abbreviations: BMI, body mass index; HD, hemodialysis; DM, diabetes mellitus; AMI, acute myocardial infarction; SBP, systolic blood pressure; GA, glycated albumin; BUN, blood urea nitrogen; Kt/Vurea, dialysis efficiency; Hb, hemoglobin; GOT, glutamic-oxaloacetic transaminase; GPT, glutamic-pyruvic transaminase.
† Student's t-test, ‡ Mann-Whitney U test, # Chi-square test, ! Fisher's exact test *p<0.05
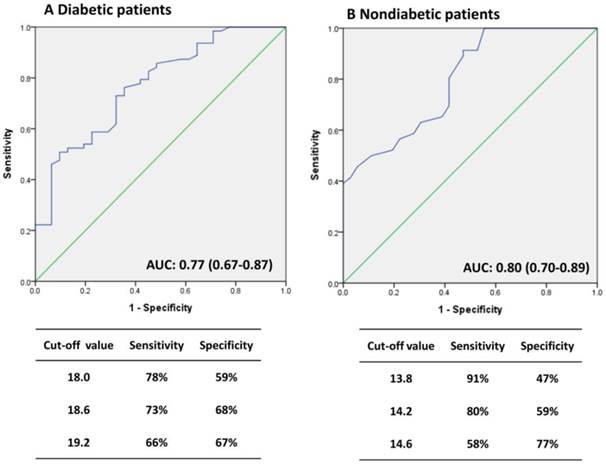
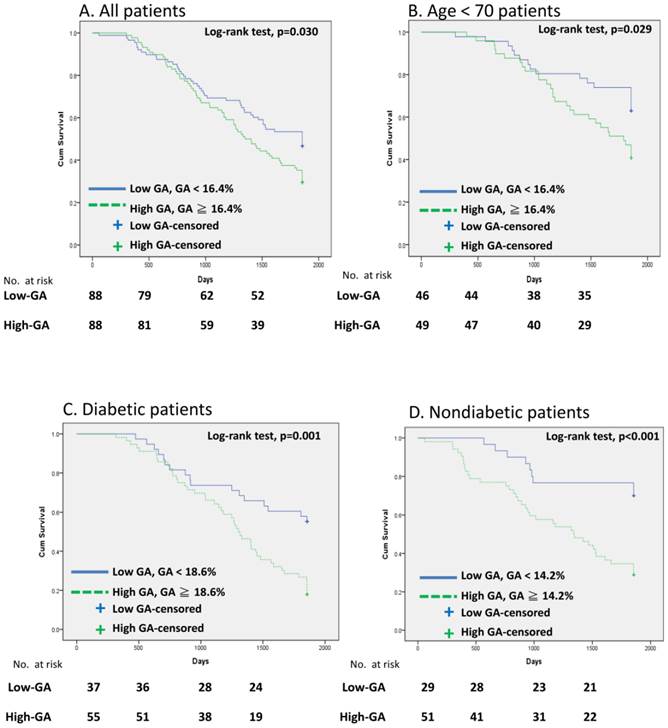
In general, most patients with DM were in the high-GA group and the non-DM patients were in the low-GA group. Therefore, we utilized receiver-operating characteristic curve (ROC) analysis to determining the optimal cutoff value for predicting patient survival (Fig. 1). GA levels of 18.6% and 14.2 % were viewed as optimal cutoff values to maximize the power of GA to predict mortality in the DM and non-DM subgroups, respectively (area under the curve = 0.77, Fig. 1A; and 0.80, Fig. 1B). Fig. 2 shows the Kaplan-Meier survival curves for mortality according to the median GA level in all patient groups and the calculated optimal cutoff value in the DM and non-DM groups. Cumulative survival was significantly greater in the low-GA group than in the high-GA group (p = 0.030, log-rank test; Fig. 2A). The 1-, 3-, and 5-year cumulative survival rates for the low-GA group were 96.6%, 69.3%, and 53.4%, respectively. In the high-GA group, the 1-, 3-, and 5-year cumulative survival rates were 96.6%, 64.8%, and 34.1%, respectively. This significance was more prominent in patients undergoing hemodialysis who were aged < 70 years (p = 0.029, log-rank test; Fig. 2B). In subgroup analysis, both patients with and without DM who had low GA levels had a better cumulative survival compared to those with high GA levels (DM, p= 0.001, log-rank test, Fig. 2C; non-DM, p < 0.001, log-rank test, Fig. 2D).
Receiver operating characteristic (ROC) curves for GA to predict the risk of mortality. (A) DM patients, (B) Non-DM patients.
Cumulative survival curves for HD patients. (A) All patients, (B) Patients with age <70, (C) DM group, and (D) non-DM group.
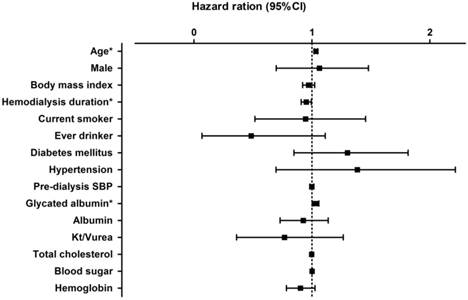
The association between GA levels and patient survival according to the univariate Cox regression model is shown in Fig. 3. In a model using the forced-entry method, age and GA level were associated with a significant increase in the risk of death (age, HR 1.034 [95%CI, 1.02-1.05], p<0.01; GA, HR 1.030 [95%CI, 1.002-1.06], p = 0.038). However, the variable hemodialysis duration was also a significant predictor of survival in all patients on hemodialysis (hemodialysis duration, HR = 0.951 [95% CI: 0.909-0.995], p=0.03).
Hazard ratio for various factors for patient survival in all hemodialysis patients.
Multivariate analysis was conducted in all patients on hemodialysis (Table 4), with GA as an objective variable and age and gender as mainly explanatory variables. GA independently predicted mortality after adjusting for age and gender. In this model, the risk of mortality increased by 3.3% for each 1% rise in GA in all patients on hemodialysis. After adjusting for age and gender, pre-dialysis systolic blood pressure, and blood sugar and dialysis efficiency (Kt/Vurea), the variable GA was still an independent predictor of survival in all hemodialysis patients. The Harrell's C index of concordance statistics for models 1 and 5 were 0.6604 and 0.6151 respectively.
Hazard ratio (95%CI) of risk factors in all hemodialysis patients, as determined by multivariate Cox's proportional regression hazard models.
| Model 1 | Model 2 | Model 3 | Model 4 | Model 5 | |
|---|---|---|---|---|---|
| Harrell's Concordance | 0.6604 | 0.6595 | 0.6597 | 0.6549 | 0.6515 |
| Glycated albumin | 1.033* (1.002 - 1.065) | 1.033* (1.002 - 1.065) | 1.045* (1.010 - 1.081) | 1.024 (0.992 - 1.057) | 1.039* (1.003 - 1.076) |
| Age | 1.036* (1.021 - 1.051) | 1.036* (1.020 - 1.051) | 1.036* (1.020 - 1.052) | 1.038* (1.023 - 1.054) | 1.038* (1.022 - 1.055) |
| Male | 0.896 (0.612 - 1.311) | 0.895 (0.610 - 1.314) | 0.923 (0.624 - 1.366) | 1.064 (0.708 - 1.599) | 1.072 (0.702 - 1.638) |
| Pre-dialysis SBP | 0.997 (0.990 - 1.005) | 0.996 (0.988 - 1.004) | |||
| Blood glucose | 0.998 (0.995 - 1.001) | 0.998 (0.995 - 1.001) | |||
| Dialysis efficiency (Kt/Vurea) | 0.472* (0.238 - 0.935) | 0.540 (0.272 - 1.075) |
*p<0.05, p value was calculated using the Cox-proportional hazard model.
Discussion
We evaluated the relationship between GA level and survival in patients who were undergoing hemodialysis. Compared to previous studies [7, 8], this study had a longer follow-up period (median, 51.0 months; mean 45.3 months), which allowed us to clarify the association between GA levels and survival. To our knowledge, this is the first article to discuss the relationship between GA and long-term survival in patients undergoing hemodialysis, with particular emphasis on the impact of GA in the non-DM group undergoing hemodialysis.
The benefits of strict blood glucose control with respect to survival had been proven in studies of patients with diabetic microangiopathy [9]. However, only 30-40% of diabetic patients routinely self-monitor their blood glucose [10]. Thus, it is important to identify suitable markers for glycemic control, whether in patients with normal renal function or in those with end-stage renal disease (ESRD). It has long been questioned whether HbA1C levels correlate well with average serum glucose concentrations in ESRD patients. Kalantar-Zadeh et al. showed that higher HbA1C levels are associated with an increased risk of death in patients on maintenance hemodialysis [11]. By contrast, Williams et al. concluded that HbA1c had only a weak correlation with mean blood glucose values and that there was no correlation between HbA1c levels and survival at the 12-month follow-up in patients with DM undergoing dialysis [12]. Thus, HbA1C levels do not appear to be an ideal predictive index of survival in patients with DM undergoing hemodialysis.
Serum GA level could potentially be used to measure dysglycemia in research and clinical settings and it may detect blood glucose fluctuations earlier than HbA1C levels [13]. Serum GA reflects the blood glucose status more rapidly than HbA1C (2-3 weeks vs. 2-3 months) because of the different half-lives of the protein-binding forms. Hwang et al. showed that a GA level of >14.3% is optimal for the diagnosis of diabetes in Korean adults and that measurement of GA can detect diabetes earlier than fasting plasma glucose and HbA1C levels [14]. In addition, GA has a stronger relationship than HbA1C with the glycemic gradient and glycemic excursions [15]. Consequently, GA may reflect not only short-term average glucose concentrations, but also fluctuations in glucose levels [16]. However, misleadingly low GA levels may occur in the presence of heavy proteinuria and increased serum albumin catabolism in patients with diabetic nephropathy stage III. These low GA levels may rise if anuria, with consequent cessation of proteinuria, occurs in end-stage diabetic nephropathy. The loss of albumin in PD dialysate can also falsely decrease the GA level, leading to underestimation of glycemic control in PD patients. Thus, GA may be an acceptable indicator of glycemic control only in patients with normal serum albumin and low protein loss in the urine and dialysate [17]. In addition, in non-DM patients with overt hypothyroidism, GA levels may be misleadingly increased because hypothyroidism prolongs albumin metabolism. Albumin metabolism returns to normal after thyroid hormone replacement [18]. In chronic liver disease, GA values became abnormally high because of the prolonged lifespan of albumin in patients with impaired albumin synthesis [19].
Although hemodialysis duration, dialysis efficiency, and pre-dialysis systolic blood pressure may have contributed to differences in the prognosis between the high- and low-GA groups (Table 3), it is notable that the cumulative survival curve in the high-GA group (GA ≥ 16.4%) predicted poor survival in patients undergoing hemodialysis. Shafi et al. showed that high GA levels are a risk factor for mortality and morbidity in hemodialysis patients [7]. Numerous studies have suggested that GA levels, with a cutoff value of 17.1% [20], 25% [3], or 29% [8] in Chinese populations, may provide information about survival in patients with DM who are undergoing hemodialysis. Additionally, the log-rank test statistic of GA in our study was higher in patients aged < 70 years compared with those aged ≥ 70 years. This trend may be of particular importance because this group is closer to the average age at which patients initiate hemodialysis.
Consensus on the predictive power of GA in clinical practice has not yet been reached. Several studies suggested that GA levels can accurately predict the risk of death in patients undergoing hemodialysis in the presence or absence of DM [3, 7, 8]. However, Okada et al concluded that neither HbA1C nor GA predicted mortality in patients with DM undergoing hemodialysis [21]. All these published studies enrolled fewer than 100 patients on hemodialysis who were followed for only about 3 years. In contrast, we enrolled 176 patients and the duration of follow-up was up to 5 years. After our long observation period, the role of GA levels in predicting long-term survival in both the DM and non-DM subgroups undergoing hemodialysis was established.
Our previous study showed a statistically significant negative correlation between estimated glomerular filtration rate and GA concentrations in patients without DM who had mild to advanced CKD, which suggests that CKD-associated inflammatory status may play an important role in determining serum GA levels [6]. In the country, peptide-bound derivatives and carbonyl glycated compounds such as GA represent an important class of uremic toxins with pro-inflammatory and pro-oxidant properties that activate the inflammatory loop of ESRD [22]. When patients with CKD enter into dialysis, which is associated with increased oxidative stress, it causes further activation of phagocytes, release of oxygen radicals, peroxidation of lipids, and ultimately depletes the patient's protection against antioxidants [23]. The increased GA levels are associated with increased oxidative stress, impaired endothelial function, and pro-inflammatory responses suggesting that GA may play a role in the pathogenesis of vascular complications [4]. This study underlines that GA may be a valuable inflammatory marker and indicates that highly glycated products may increase the risk of death in patients without DM undergoing hemodialysis.
Survival associated with glycemic control has been studied in patients undergoing dialysis [11, 12, 24, 25]. Studies of the association between HbA1c levels and patient survival in patients undergoing dialysis are lacking. This is explained by several competing risk factors related to malnutrition, wasting, and anemia, which may confound the association between glycemic control and survival in patients with DM undergoing hemodialysis [26]. The development of cardiovascular disease is associated with poor glycemic control as reflected by the high GA level [21]. Our study showed that age and GA level were strongly associated with long-term mortality in patients undergoing hemodialysis in the unadjusted analysis. After multivariate adjustment, high GA level (≥ 16.4%) was a significant predictor of mortality as reported previously [3, 7, 8].
This study has several limitations. The sample size was small, the duration of follow up was short, and the study took place at a single center. Moreover, the confounding factors in patients undergoing hemodialysis are complicated. Harrell's concordance index was not adequate to indicate good predictability in each model. Finally, we did not consider the albumin catabolism rate. To confirm the utility of GA level for predicting mortality, a multicenter interventional study with a larger number of patients from multiple dialysis centers is necessary.
Conclusions
In addition to serving as a glucose control index, GA is also a good predictor of long-term survival in patients undergoing hemodialysis. High GA levels were associated with poor outcomes in all studied patients. Serum GA level was a strong predictor of the risk of death in not only patients with DM undergoing hemodialysis, but also in those without DM.
Abbreviations
GA: glycated albumin; HbA1C: hemoglobin A1C; CKD: chronic kidney disease; SBP: systolic blood pressure; BUN: Blood urea nitrogen; Kt/Vurea: Dialysis efficiency; GOT: glutamic-oxaloacetic transaminase; GPT: glutamic-pyruvic transaminase; Hb: Hemoglobin.
Acknowledgements
This works was support by grants from the Cardinal Tien Hospital (CTH-99-1-2A06).
Competing Interests
The authors declare that they have no conflicts of interest regarding the publication of this paper.
References
1. Speeckaert M, Van Biesen W, Delanghe J. et al. Are there better alternatives than haemoglobin A1c to estimate glycaemic control in the chronic kidney disease population? Nephrol Dial Transplant. 2014;29(12):2167-77
2. Nagayama H, Inaba M, Okabe R. et al. Glycated albumin as an improved indicator of glycemic control in hemodialysis patients with type 2 diabetes based on fasting plasma glucose and oral glucose tolerance test. Biomed Pharmacother. 2009;63(3):236-40
3. Isshiki K, Nishio T, Isono M. et al. Glycated albumin predicts the risk of mortality in type 2 diabetic patients on hemodialysis: evaluation of a target level for improving survival. Ther Apher Dial. 2014;18(5):434-42
4. Zheng CM, Ma WY, Wu CC. et al. Glycated albumin in diabetic patients with chronic kidney disease. Clin Chim Acta. 2012;413(19-20):1555-61
5. Schleicher ED, Olgemoller B, Wiedenmann E. et al. Specific glycation of albumin depends on its half-life. Clin Chem. 1993;39(4):625-8
6. Ma WY, Wu CC, Pei D. et al. Glycated albumin is independently associated with estimated glomerular filtration rate in nondiabetic patients with chronic kidney disease. Clin Chim Acta. 2011;412(7-8):583-6
7. Shafi T, Sozio SM, Plantinga LC. et al. Serum fructosamine and glycated albumin and risk of mortality and clinical outcomes in hemodialysis patients. Diabetes Care. 2013;36(6):1522-33
8. Fukuoka K, Nakao K, Morimoto H. et al. Glycated albumin levels predict long-term survival in diabetic patients undergoing haemodialysis. Nephrology (Carlton). 2008;13(4):278-83
9. Molyneaux LM, Constantino MI, Mcgill M. et al. Better glycaemic control and risk reduction of diabetic complications in Type 2 diabetes: comparison with the DCCT. Diabetes Res Clin Pract. 1998;42(2):77-83
10. Harris MI, Cowie CC, Howie LJ. Self-monitoring of blood glucose by adults with diabetes in the United States population. Diabetes Care. 1993;16(8):1116-23
11. Kalantar-Zadeh K, Kopple JD, Regidor DL. et al. A1C and survival in maintenance hemodialysis patients. Diabetes Care. 2007;30(5):1049-55
12. Williams ME, Lacson E Jr, Teng M. et al. Hemodialyzed type I and type II diabetic patients in the US: Characteristics, glycemic control, and survival. Kidney Int. 2006;70(8):1503-9
13. Yang C, Li H, Wang Z. et al. Glycated albumin is a potential diagnostic tool for diabetes mellitus. Clin Med. 2012;12(6):568-71
14. Hwang YC, Jung CH, Ahn HY. et al. Optimal glycated albumin cutoff value to diagnose diabetes in Korean adults: a retrospective study based on the oral glucose tolerance test. Clin Chim Acta. 2014;437:1-5
15. Suwa T, Ohta A, Matsui T. et al. Relationship between clinical markers of glycemia and glucose excursion evaluated by continuous glucose monitoring (CGM). Endocr J. 2010;57(2):135-40
16. Koga M. Glycated albumin; clinical usefulness. Clin Chim Acta. 2014;433:96-104
17. Watanabe Y, Ohno Y, Inoue T. et al. Blood glucose levels in peritoneal dialysis are better reflected by HbA1c than by glycated albumin. Adv Perit Dial. 2014;30:75-82
18. Kim MK, Kwon HS, Baek KH. et al. Effects of thyroid hormone on A1C and glycated albumin levels in nondiabetic subjects with overt hypothyroidism. Diabetes Care. 2010;33(12):2546-8
19. Koga M, Kasayama S, Kanehara H. et al. CLD (chronic liver diseases)-HbA1C as a suitable indicator for estimation of mean plasma glucose in patients with chronic liver diseases. Diabetes Res Clin Pract. 2008;81(2):258-62
20. Ma XJ, Pan JM, Bao YQ. et al. Combined assessment of glycated albumin and fasting plasma glucose improves the detection of diabetes in Chinese subjects. Clin Exp Pharmacol Physiol. 2010;37(10):974-9
21. Okada T, Nakao T, Matsumoto H. et al. Association between markers of glycemic control, cardiovascular complications and survival in type 2 diabetic patients with end-stage renal disease. Intern Med. 2007;46(12):807-14
22. Piroddi M, Depunzio I, Calabrese V. et al. Oxidatively-modified and glycated proteins as candidate pro-inflammatory toxins in uremia and dialysis patients. Amino Acids. 2007;32(4):573-92
23. Brahmbhatt A, Remuzzi A, Franzoni M. et al. The molecular mechanisms of hemodialysis vascular access failure. Kidney Int. 2016;89(2):303-16
24. Morioka T, Emoto M, Tabata T. et al. Glycemic control is a predictor of survival for diabetic patients on hemodialysis. Diabetes Care. 2001;24(5):909-13
25. Oomichi T, Emoto M, Tabata T. et al. Impact of glycemic control on survival of diabetic patients on chronic regular hemodialysis: a 7-year observational study. Diabetes Care. 2006;29(7):1496-500
26. Kovesdy CP, Sharma K, Kalantar-Zadeh K, Glycemic control in diabetic CKD patients. where do we stand? Am J Kidney Dis. 2008;52(4):766-77
Author contact
![]() Corresponding author: Dr. Kuo-Cheng Lu, Division of Nephrology, Department of Medicine, Cardinal Tien Hospital, School of Medicine, Fu-Jen Catholic University, No. 510 Zhongzheng Rd , Xinzhuang Dist., New Taipei City, 24205 Taiwan (R.O.C). E-mail: kuochenglucom (K-C. Lu)
Corresponding author: Dr. Kuo-Cheng Lu, Division of Nephrology, Department of Medicine, Cardinal Tien Hospital, School of Medicine, Fu-Jen Catholic University, No. 510 Zhongzheng Rd , Xinzhuang Dist., New Taipei City, 24205 Taiwan (R.O.C). E-mail: kuochenglucom (K-C. Lu)