Impact Factor ISSN: 1449-1907

 Global reach, higher impact
Int J Med Sci 2015; 12(12):968-973. doi:10.7150/ijms.13121 This issue Cite
Research Paper
QT interval Independently Predicts Mortality and Heart Failure in Patients with ST-Elevation Myocardial Infarction
Jeng-Feng Lin1,2, Shun-Yi Hsu1,2, Semon Wu1,3, Ming-Sheng Teng1, Hsin-Hua Chou1, Shih-Tsung Cheng1, Tien-Yu Wu1, Yu-Lin Ko1,2 ![]()
1. Division of Cardiology, Department of Internal Medicine, Taipei Tzu Chi Hospital, Buddhist Tzu Chi Medical Foundation, New Taipei City, Taiwan;
2. School of Medicine, Tzu Chi University, Hualien, Taiwan;
3. Department of Life Science, Chinese Culture University, Taipei, Taiwan.
Received 2015-7-2; Accepted 2015-10-26; Published 2015-11-17
Abstract
Objectives: Heart-rate corrected QT (QTc) interval predicts cardiovascular mortality or all-cause mortality in the general population. Little is known about the best cut-off value of QTc interval for predicting clinical events in patients with ST-elevation myocardial infarction (STEMI).
Methods: We enrolled 264 patients with STEMI who received measurement of QTc intervals at ER (QTc-ER), on day 2 (QTc-D2), and on day 3 (QTc-D3) of hospitalization. Clinical events, including all-cause death and readmission for heart failure, were followed for 2 years.
Results: Prolonged QTc-ER, but not QTc-D2 or QTc-D3, well predicted clinical events with the best cut-off value of 445 ms. Patient with QTc-ER > 445 ms had lower left ventricular ejection fraction at baseline and at 6 months. Kaplan-Meier survival curves showed that the combination of QTc-ER > 445 ms and N-terminal pro-brain natriuretic peptide (NT-pro BNP) > 936 pg/mL was a strong predictor of clinical events (p<0.001). In multivariable Cox regression analysis, the independent predictors of death and heart failure were QTc-ER (p<0.001), log NT-proBNP (p<0.001), diabetes mellitus (p<0.001), history of stroke (p=0.001), and left ventricular end diastolic volume index (p<0.001).
Conclusion: QTc-ER > 445 ms independently predicts clinical events in STEMI, providing incremental prognostic value to established clinical predictors and NT-proBNP.
Keywords: QT interval, brain natriuretic peptide, acute myocardial infarction, left ventricular remodeling.
Introduction
Epidemiological studies have shown the association between heart-rate corrected QT (QTc) interval and cardiovascular mortality or all-cause mortality in the general population [1-3]. Elevated sympathetic tone may be one of the underlying mechanisms that increase the QTc interval and the rate of mortality [4, 5]. QTc interval is found to be prolonged in patients with acute myocardial infarction (AMI) and may help in identifying patients with higher rate of sudden death and mortality in previous studies [6-8]. However, these studies are done before the reperfusion era and may not apply to the patients with ST-elevation myocardial infarction (STEMI) receiving reperfusion therapy. It is also unknown whether the prognostic value of QTc interval is incremental to established biomarkers, e.g. brain natriuretic peptide [9-13]. Furthermore, QTc interval increases gradually during the first week of AMI [7, 14]. Little is known about the best measuring time and the best cut-off value of QTc interval for predicting clinical events in patients with STEMI.
The aim of this study is to investigate the role of QTc interval in predicting the clinical outcomes after STEMI, particularly for left ventricular (LV) remodeling, heart failure, and all-cause death.
Materials and methods
Study Population
The study population was enrolled at Taipei Tzu Chi hospital in Taiwan between December 9, 2007, and April 9, 2013. With institutional ethics committee approval and written informed consent, we enrolled patients who presented to emergency room (ER) with STEMI and received successful primary percutaneous coronary intervention (PCI) within 12 hours of symptom onset. Patients were excluded if there were shock requiring cardiopulmonary support, scheduled coronary bypass graft operation, previous myocardial infarction (MI), cardiac disease states other than ischemic heart disease, a history of active malignancy in past 3 years, significant renal or hepatic dysfunction, chronic bedridden status, or concomitant inflammatory diseases such as infections or autoimmune disorders.
Electrocardiographic Data
Standard 12-lead electrocardiograms (ECG) were recorded using MAC 5500 machines (GE Medical system, Milwaukee, WI, USA). The first ECG at ER (day 1), ECG in the first morning at coronary care unit (day 2), and ECG in the second morning at coronary care unit (day 3) were obtained from electric medical records. With initially visual inspection, recordings with inadequate quality, atrial fibrillation, or bundle branch block were excluded [15]. The MAC 5500 machines measured the QT interval from the onset of QRS complex to the end of T wave in all 12 leads. The averaged QT interval was then corrected for heart rate using the Bazett formula (QTc = QT/√RR). The computerized measurements of QTc intervals on day 1 (QTc-ER), day 2 (QTc-D2), and day 3 (QTc-D3) were used for further analysis.
Laboratory Analysis
Approximately 10 ml of blood from a peripheral vein were collected into a tube containing potassium ethylenediamine tetra-acetic acid (1 mg/ml) at post-MI day 2. The samples were centrifuged at 4°C within 20 minutes. The plasma was separated and subsequently frozen at -80°C until further analysis without undergoing any additional freeze-thaw cycles. Levels of N-terminal pro-brain natriuretic peptide (NT-pro BNP) were measured by commercial enzyme linked fluorescent assay (Vidas system, bioMérieux).
Echocardiographic Analysis
Comprehensive 2D Doppler echocardiographic studies were performed with the patients in the partial left lateral decubitus at baseline (mostly post-MI day 2) and were repeated 6 months later. The equipment used was a Philip SONOS 7500 (Agilent Technologies, Andover, MA) system. All measurements were performed and repeated by the same experienced echocardiologist [16, 17]. The LV end-diastolic volume index (LVEDVI) was measured according to the recommendations of the American Society of Echocardiography [18]. With the use of apical 4- and 2-chamber views, LV ejection fraction (LVEF) was estimated by the modified Simpson's method. The degree of LV dilatation was evaluated by the change in LVEDVI between baseline and 6-month follow-up. Significant LV dilatation was defined as a >20 ml/m2 increase in LVEDVI at 6 months, compared with baseline [19].
Clinical Endpoints
The clinical events, including all-cause death and readmission to hospital for heart failure, were recorded by reviewing electric medical records or contacting patients by telephone. Patients were followed for a maximum of 2 years.
Statistical Analysis
The best cut-off value of QTc-ER, QTc-D2, QTc-D3, and NT-pro BNP for predicting mortality or heart failure was identified by receiver-operating characteristic (ROC) curve. Patients were divided into two groups based on the best cut-off value of QTc interval. Categorical variables were expressed as number (percentage) and compared with chi-square test. All continuous variables were tested for normal distribution by using the Kolmogorov-Smirnov test. Depending on normality, continuous variables were expressed as mean ± SD or median with interquartile range (IQR) and compared with Student's t test or Mann-Whitney U test, respectively. Univariable logistic regression was applied to identify the predictors of significant increase (>20 ml/m2) in LVEDVI. Stepwise multivariable regression (entry threshold, p<0.05; removal threshold, p>0.10) was then performed using significant variables in univariable model. Timing of clinical events was plotted according to the Kaplan-Meier method and compared with log-rank test. We also used Cox regression model to assess whether QTc interval was an independent predictor of clinical events. These statistics were computed using SPSS statistical software (SPSS Inc., Chicago, Illinois). A value of p<0.05 was considered significant.
Results
With initially visual inspection, 16 patients were excluded for atrial fibrillation, 1 patient was excluded for left bundle branch block, and 17 patients were excluded for right bundle branch block. We finally enrolled 264 patients.
QTc Intervals and NT-pro BNP Levels
QTc intervals increased gradually from 439 ± 33 ms at ER on day 1, to 446 ± 38 ms on day 2 (p=0.018 vs. day 1), to 459 ± 42 ms on day 3 (p<0.001 vs. day2). The area under ROC curve for predicting all-cause death and heart failure was 0.848 for QTc-ER, 0.562 for QTc-D2, and 0.507 for QTc-D3. Prolonged QTc-ER, but not QTc-D2 or QTc-D3, well predicted clinical events (Figure 1A).
(a) Receiver operating characteristic (ROC) curves analysis was conducted for discrimination between patients with and without death or heart failure. The area under the curve (AUC) was 0.848 for QTc interval at emergency room (QTc-ER), indicating a good predictive power. In contrast, QTc interval on day 2 (QTc-D2) and day 3 (QTc-D3) had poor predictive power. (b) QTc intervals at emergency room, on day 2, and on day 3, stratified according to patients with or without death or heart failure.
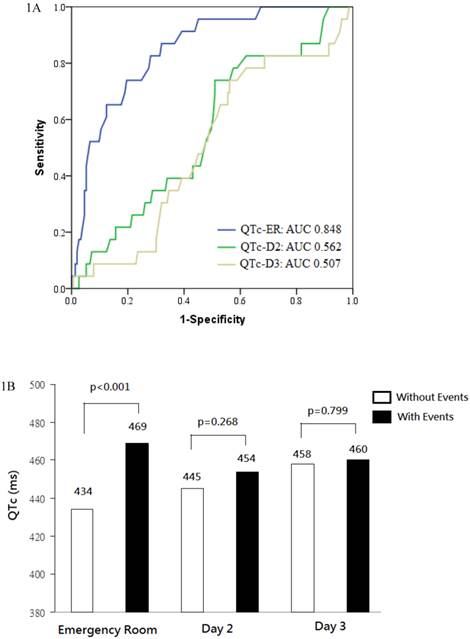
The best prognostic cut-off value of QTc-ER for predicting death or heart failure was 445 ms (sensitivity 86%, specificity 68%). The best cut-off value of NT-pro BNP for predicting death or heart failure was 936 pg/mL (area under ROC curve 0.841, sensitivity 93%, specificity 69%).
Patient Characteristics
Baseline clinical and demographic characteristics, stratified according to QTc-ER greater or lesser than 445 ms, are listed in Table 1. Patients with QTc-ER > 445 ms tended to be older, female in gender, have diabetes mellitus (DM), longer symptom-to-door time, higher Killip class, faster heart rate, anterior wall MI, higher peak creatine kinase (CK), higher NT-proBNP level, lower LVEF, and higher Thrombolysis in Myocardial Infarction (TIMI) risk score for STEMI.
Clinical and demographic characteristics.
| QTc-ER ≦ 445 ms (N=167) | QTc-ER > 445 ms (N=97) | P value | |
|---|---|---|---|
| Age, years | 57.0 ± 10.1 | 61.6 ± 13.8 | .004 |
| Male gender | 156 (93.4%) | 68 (70.1%) | <.001 |
| History | |||
| Current smoker | 103 (61.7%) | 51 (52.6%) | .148 |
| Diabetes mellitus | 37 (22.2%) | 33 (34.0 %) | .035 |
| Hypertension | 91 (54.5%) | 63 (64.9%) | .097 |
| Hypercholesterolemia | 75 (44.9%) | 49 (50.5%) | .379 |
| Coronary heart disease | 19 (11.4%) | 11 (11.3%) | .993 |
| Stroke | 8 (4.8%) | 7 (7.2%) | .412 |
| Presentation | |||
| Symptom-to-door time, min | 72 (41-198) | 138 (50-296) | .012 |
| Door-to-balloon time, min | 76 (60-104) | 78 (66-119) | .252 |
| Killip class > I | 26 (15.6%) | 35 (36.1%) | <0.001 |
| Heart rate, beats/min | 74 ± 18 | 83 ± 21 | <.001 |
| SBP, mmHg | 131 ± 27 | 136 ± 28 | .159 |
| Anterior MI | 60 (43.2%) | 80 (57.6%) | .016 |
| Body mass index, kg/m2 | 25.4 (23.0-27.2) | 25.8 (23.9-28.4) | .300 |
| Peak CK, IU/L | 2061 (1082-3645) | 2602 (1511-4539) | .036 |
| Hemoglobin, g/dL | 15.3 (14.1-16.2) | 14.8 (13.2-15.9) | .052 |
| Creatinine, mg/dL | 1.00 (0.89-1.20) | 1.02 (0.89-1.20) | .832 |
| Potassium, mmol/L | 3.60 (3.31-3.90) | 3.60 (3.30-4.00) | .883 |
| NT-proBNP, pg/mL | 525 (240-1136) | 986 (477-2280) | <.001 |
| LVEF, % | 51.1 ± 11.4 | 46.5 ± 12.0 | .003 |
| LVMI, g/m2 | 122.6 ± 30.1 | 124.4 ± 36.4 | .675 |
| LVEDVI, mL/m2 | 68.2 ± 18.9 | 67.9 ± 2.19 | .909 |
| TIMI risk score | 3.0 ± 1.9 | 4.7 ± 2.4 | <.001 |
Values are expressed as number of patients (%), mean ± SD, or median (25th-75th percentile).
QTc-ER indicates QTc interval at emergency room; SBP, systolic blood pressure; MI, myocardial infarction; CK, creatine kinase; NT-proBNP, N-terminal pro-B-type natriuretic peptide; LVEF, left ventricular ejection fraction; LVMI, left ventricular mass index; LVEDVI, left ventricular end-diastolic volume index; and TIMI risk score, Thrombolysis in Myocardial Infarction risk score for ST-elevation myocardial infarction.
Echocardiographic Analysis
Compared with short QTc-ER group, patients with QTc-ER > 445 ms had lower LVEF at baseline (46.5 ± 12.0% vs. 51.1 ± 11.4%, p=0.003) and lower LVEF at 6 months (53.2 ± 15.7% vs. 58.7 ± 13.3%, p=0.008). The absolute increase in LVEF was similar in both groups (6.2 ± 12.4% vs. 7.4 ± 11.2%, p=0.471).
Compared with short QTc-ER group, patients with QTc-ER > 445 ms had similar LVEDVI at baseline (67.9 ± 21.9 vs. 68.2 ± 18.9, p=0.909) and insignificantly higher LVEDVI at 6 months (77.1 ± 25.9 vs. 71.7 ± 20.6, p=0.080). The absolute change in LVEDVI at 6 months was insignificantly higher in patients with QTc-ER > 445 ms (9.8 ± 24.9 vs. 4.2 ± 18.4, P=0.073).
In logistic regression model, QTc-ER was a predictor of a significant increase (>20 ml/m2) in LVEDVI at 6 months in univariable analysis (B= 1.012, p=0.028) but not a predictor in multivariable analysis. In multivariable logistic regression analysis, the independent predictors of a significant increase in LVEDVI were DM (B= 2.370, p=0.031), log peak CK (B= 10.515, p<0.001), and baseline LVEDVI (B= 0.966, p=0.004; Table 2).
Predictors of a significant increase in LVEDVI (>20 ml/m2) in logistic regression analysis.
| Univariable | Multivariable | |||
|---|---|---|---|---|
| Standardized coefficient | p value | Standardized coefficient | p value | |
| QTc-ER | 1.012 | 0.028 | ||
| Heart rate | 1.018 | 0.034 | ||
| Log CK | 9.966 | <0.001 | 10.515 | <.001 |
| Log NT-proBNP | 2.352 | 0.012 | ||
| WBC | 1.099 | 0.042 | ||
| Hemoglobin | 1.333 | 0.007 | ||
| Diabetes mellitus | 2.502 | 0.006 | 2.370 | .031 |
| LVEF at baseline | 0.961 | 0.005 | ||
| LVEDVI at baseline | 0.966 | 0.001 | .966 | .004 |
| LVMI | 0.986 | 0.022 | ||
CK and NT-proBNP are analyzed as log transformed variables. QTc-ER indicates QTc interval at emergency room; CK, creatine kinase; NT-proBNP, N-terminal pro-B-type natriuretic peptide; WBC white blood cells; LVEF, left ventricular ejection fraction; LVEDVI, left ventricular end-diastolic volume index; and LVMI, left ventricular mass index.
Clinical Endpoints
During follow-up, 12 patients (4.5%) died and 18 patients (6.8%) had been readmitted to the hospital for heart failure. When compared with event-free survivors, patients with clinical events had longer QTc-ER (469 ± 32 vs. 434 ± 29 ms, p<0.001), similar QTc-D2 (454 ± 37 vs. 445 ± 38 ms, p=0.268), and similar QTc-D3 (460 ± 42 vs. 458 ± 43 ms, p=0.799; Figure 1B). In patient with clinical events, QTc interval reached its maximum at ER and was relatively unchanged on day 2 (p=0.050 vs. QTc-ER) and day 3 (p=0.479 vs. QTc-D2). In event-free survivors, QTc interval increased gradually on day 2 (p<0.001 vs. QTc-ER) and day3 (p<0.001 vs. QTc-D2).
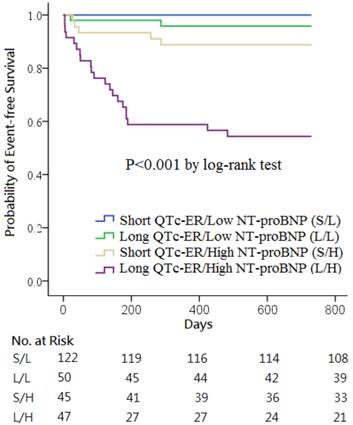
Kaplan-Meier survival curves showed that the combination of QTc-ER > 445 ms and NT-proBNP > 936 pg/mL was a strong predictor of the clinical events (p<0.001; Figure 2). No clinical event occurred in the 122 patients with short QTc-ER & low NT-proBNP. Death or heart failure occurred in 2 patients (4.0%) in long QTc-ER & low NT-proBNP group, 5 patients (11.1%) in short QTc-ER & high NT-proBNP group, and 21 patients (44.7%) in long QTc-ER & high NT-proBNP group.
Kaplan-Meier curves of the cumulative incidence of all-cause death or heart failure stratified according to QTc intervals at emergency room (QTc-ER) above or below 445 ms and N-terminal pro-B-type natriuretic peptide (NT-proBNP) levels above or below 936 pg/mL.
In multivariable Cox regression analysis using significant variables in univariable model, the independent predictors of death and heart failure were QTc-ER (hazard ratio (HR) 1.03, 95% confidence interval (CI) 1.01-1.04, p<0.001), log NT-proBNP (HR 6.30, CI 2.78-14.29, p<0.001), DM (HR 7.23, CI 3.07-17.37, p<0.001), history of stroke (HR 7.31, CI 1.29-24.43, p=0.001) and LVEDVI (HR 1.03, CI 1.02-1.05, p<0.001; Table 3).
Predictors of death and heart failure in Cox regression analysis.
| Univariable | Multivariable | |||
|---|---|---|---|---|
| Hazard ratio (95% CI) | p value | Hazard ratio (95% CI) | p value | |
| QTc-ER, ms | 1.03 (1.02-1.05) | <.001 | 1.03 (1.01-1.04) | <.001 |
| Female | 3.98 (1.86-8.50) | <.001 | ||
| Age, years | 1.08 (1.05-1.11) | <.001 | ||
| Symptom-to-door time, 10 min | 1.02 (1.00-1.04) | .044 | ||
| Killip class > I | 3.10 (1.48-6.52) | .003 | ||
| Log CK, IU/L | 3.35 (1.10-10.23) | .033 | ||
| Log NT-proBNP, pg/mL | 7.93 (4.14-15.20) | <.001 | 6.30 (2.78-14.29) | <.001 |
| Creatinine, mg/dL | 1.36 (1.11-1.66) | .003 | ||
| Hemoglobin, g/dL | 0.70 (0.60-0.81) | <.001 | ||
| Diabetes mellitus | 4.90 (2.30-10.47) | <.001 | 7.23 (3.07-17.37) | <.001 |
| Hypertension | 2.77 (1.12-6.82) | .027 | ||
| Current smoker | 0.38 (0.17-0.82) | .013 | ||
| Stroke history | 3.11 (1.08-8.98) | .035 | 7.31 (2.19-24.43) | .001 |
| LVEF, % | 0.93 (0.90-0.96) | <.001 | ||
| LVEDVI, mL/m2 | 1.02 (1.01-1.04) | .009 | 1.03 (1.02-1.05) | <.001 |
QTc-ER indicates QTc interval at emergency room; CK, creatine kinase; NT-proBNP, N-terminal pro-B-type natriuretic peptide; LVEF, left ventricular ejection fraction; and LVEDVI, left ventricular end-diastolic volume index.
Discussion
Our investigation indicates that, prolonged QTc-ER is a strong and independent predictor of mortality and heart failure in patients with STEMI, providing incremental information to clinical risk factors and NT-proBNP. Prolonged QTc-ER is associated with lower LVEF at baseline and 6 months later. Prolonged QTc-ER is also a predictor of severe LV dilatation in 6 months in univariable analysis, but not in multivariable analysis.
Although some previous studies have shown the association between prolonged QTc interval and cardiovascular mortality or all-cause mortality in the general population [1-3], other studies suggest that the association is not consistent and the risk is likely to be small [20, 21]. There are several possible explanations for the positive association. Prolongation of QTc interval reflects prolonged ventricular repolarization and predisposes to sudden death. Prolonged QTc interval is associated with elevated sympathetic tone which may lead to elevated blood pressure, atherosclerosis, and cardiovascular events [4, 5]. It is less clear why prolonged QTc interval also predicts all-cause mortality. One possible explanation is that prolonged QTc is a marker of other disorders such as DM or neurohormone imbalance which may predispose to increased mortality. In our study, patients with QTc-ER > 445 ms are more likely to be older, female in gender, have DM, higher peak CK, higher NT-proBNP, and higher TIMI risk score for STEMI. However, Cox multivariable regression analysis shows that QTc-ER is still an independent predictor after adjusting the above baseline differences.
QTc interval increases gradually following AMI, with highest value at the end of the first week [7, 14]. In our study, consistent with previous reports, QTc interval increases gradually on day 2 and day 3 in event-free survivors. In contrast, QTc interval reached its maximum at ER and was relatively unchanged on day 2 and day 3 in patients with clinical events. As a result, only QTc-ER, but not QTc-D2 or QTc-D3, can discriminate patients with clinical events from event-free survivals. This interesting serial change of QTc interval in patient with clinical events has never been reported and may need to be confirmed by further studies.
Previous studies evaluating the prognostic value of QTc interval in AMI were mostly done before 1990 [6-8]. Only one study had performed serial ECG follow-up after AMI and showed that QTc interval > 440 ms at hospital discharge had independent value for predicting major cardiac events [7]. ECG data at ER was not analyzed at that study. However, the study was done before the reperfusion era and also included patients with subendocardial infarction. It is possible that the prompt reperfusion therapy in our patients with STEMI will influence the temporal evolution of QTc intervals and the best measuring time of QTc intervals will thus be different. One recent study reported that prolonged QTc interval of first ECG (prehospital or hospital admission) predicted in-hospital mortality in patients with STEMI [22], which is consistent with our findings. Our study is the first study to evaluate the effects of serial QTc interval changes on the long term outcomes in patients with STEMI exclusively receiving primary PCI. It shows that, in the reperfusion era, QTc interval measured before reperfusion strongly predicts mortality and heart failure in 2 years. In contrast, QTc-D2 and QTc-D3 have no prognostic value in predicting clinical events.
One main purpose of our study is to evaluate the process of LV remodeling after STEMI. LVEF and LVEDVI have been proven to be powerful independent predictors of clinical events after MI [23-25]. In our study, patients with QTc-ER > 445 ms have lower LVEF at baseline and at 6 months. However, the correlation between QTc-ER and LVEDVI is somewhat weaker. In logistic regression model, prolonged QTc-ER is a predictor of a significant increase (>20 ml/m2) in LVEDVI at 6 months in univariable analysis but is not a predictor in multivariable analysis. As shown in table 1, prolonged QTc-ER is correlated with DM and higher peak CK, the independent predictors of significant increase in LVEDVI. It is possible that prolonged QTc-ER is just a marker of larger infarct or other underlying disorders, is not independently associated worse LV remodeling, and thus is not included in the final model of multivariable analysis.
The present study has some imitations. First, QTc intervals at discharge and after discharge are not measured and analyzed, it is not known whether they will have better predictive value. However, we think that QTc-ER may be a better predictor than QTc interval at discharge because it does not need additional ECG measurement and can also predict in-hospital mortality. Second, this is a single-center study enrolling patients exclusively reperfused by PCI. It may limit the generalizability of our findings. Third, the number of patients with clinical events is relatively small. Because of relatively low statistical power, some useful predictors of clinical outcomes may become statistically insignificant in our analysis. Fourth, the number of patients in some comparison groups (for example, short QTc-ER & high NT-proBNP group) is small. Incidental clinical events may have the potential to skew the result of survival analysis.
Conclusions
QTc-ER > 445 ms independently predicts all-cause death and heart failure in patients with STEMI, providing additional information to established clinical predictors and NT-proBNP.
Acknowledgements
We thank for the grant support (TCRD-TPE-102-34) from Taipei Tzu Chi Hospital, Buddhist Tzu Chi Medical Foundation.
Grant
TCRD-TPE-102-34 from Taipei Tzu Chi Hospital, Buddhist Tzu Chi Medical Foundation
Competing Interests
The authors have declared that no competing interest exists.
References
1. Straus SM, Kors JA, De Bruin ML. et al. Prolonged QTc interval and risk of sudden cardiac death in a population of older adults. J Am Coll Cardiol. 2006;47:362-7
2. Zhang Y, Post WS, Dalal D. et al. QT-interval duration and mortality rate: results from the Third National Health and Nutrition Examination Survey. Arch Intern Med. 2011;171:1727-33
3. Beinart R, Zhang Y, Lima JA. et al. The QT interval is associated with incident cardiovascular events: the MESA study. J Am Coll Cardiol. 2014;64:2111-9
4. Magnano AR, Holleran S, Ramakrishnan R. et al. Autonomic nervous system influences on QT interval in normal subjects. J Am Coll Cardiol. 2002;39:1820-6
5. Esposito K, Nicoletti G, Marzano S. et al. Autonomic dysfunction associates with prolongation of QT intervals and blunted night BP in obese women with visceral obesity. J Endocrinol Invest. 2002;25:RC32-5
6. Schwartz PJ, Wolf S. QT interval prolongation as predictor of sudden death in patients with myocardial infarction. Circulation. 1978;57:1074-7
7. Ahnve S. QT interval prolongation in acute myocardial infarction. Eur Heart J. 1985;6(Suppl D):85-95
8. Peters RW, Byington RP, Barker A. et al. Prognostic value of prolonged ventricular repolarization following myocardial infarction: the BHAT experience. The BHAT Study Group. J Clin Epidemiol. 1990;43:167-72
9. Stone GW, Grines CL, Browne KF. et al. Predictors of in-hospital and 6-month outcome after acute myocardial infarction in the reperfusion era: the Primary Angioplasty in Myocardial Infarction (PAMI) trail. J Am Coll Cardiol. 1995;25:370-7
10. Lin JF, Wu S, Hsu SY. et al. Growth-differentiation factor-15 and major cardiac events. Am J Med Sci. 2014;347:305-11
11. Rahim MA, Rahim ZH, Ahmad WA. et al. Can Saliva Proteins Be Used to Predict the Onset of Acute Myocardial Infarction among High-Risk Patients? Int J Med Sci. 2015;12:329-35
12. Hung MJ, Hu P, Hung MY. Coronary artery spasm: review and update. Int J Med Sci. 2014;11:1161-71
13. Jensen CJ, Lusebrink S, Wolf A. et al. Reduction of QTD - A Novel Marker of Successful Reperfusion in NSTEMI. Pathophysiologic Insights by CMR. Int J Med Sci. 2015;12:378-86
14. Khambatta RB. The Q-T interval in myocardial infarction. Br Med J. 1953;1:808-11
15. Williams ES, Thomas KL, Broderick S. et al. Race and gender variation in the QT interval and its association with mortality in patients with coronary artery disease: results from the Duke Databank for Cardiovascular Disease (DDCD). Am Heart J. 2012;164:434-41
16. Hsu SY, Lin JF, Chang SH. Right ventricular function in patients with different infarction sites after a first acute myocardial infarction. Am J Med Sci. 2011;342:474-9
17. Hsu SY, Chang SH, Liu CJ. et al. Correlates of impaired global right ventricular function in patients with a reperfused acute myocardial infarction and without right ventricular infarction. J Investig Med. 2013;61:715-21
18. Lang RM, Bierig M, Devereux RB. et al. Recommendations for chamber quantification: a report from the American Society of Echocardiography's Guidelines and Standards Committee and the Chamber Quantification Writing Group, developed in conjunction with the European Association of Echocardiography, a branch of the European Society of Cardiology. J Am Soc Echocardiogr. 2005;18:1440-63
19. Hole T, Hall C, Skaerpe T. N-terminal proatrial natriuretic peptide predicts two-year remodelling in patients with acute transmural myocardial infarction. Eur Heart J. 2004;25:416-23
20. Montanez A, Ruskin JN, Hebert PR. et al. Prolonged QTc interval and risks of total and cardiovascular mortality and sudden death in the general population: a review and qualitative overview of the prospective cohort studies. Arch Intern Med. 2004;164:943-8
21. Goldberg RJ, Bengtson J, Chen ZY. et al. Duration of the QT interval and total and cardiovascular mortality in healthy persons (The Framingham Heart Study experience). Am J Cardiol. 1991;67:55-8
22. Rivera-Fernández R, Arias-Verdú MD, García-Paredes T. et al. Prolonged QT interval in ST-elevation myocardial infarction and mortality: new prognostic scale with QT, Killip and age. J Cardiovasc Med (Hagerstown). 2014 [Epub ahead of print]
23. St John Sutton M, Pfeffer MA, Plappert T. et al. Quantitative two-dimensional echocardiographic measurements are major predictors of adverse cardiovascular events after acute myocardial infarction. The protective effects of captopril. Circulation. 1994;89:68-75
24. Richards AM, Nicholls MG, Espiner EA. et al. B-type natriuretic peptides and ejection fraction for prognosis after myocardial infarction. Circulation. 2003;107:2786-92
25. Wong M, Staszewsky L, Latini R. et al. Severity of left ventricular remodeling defines outcomes and response to therapy in heart failure: Valsartan heart failure trial (Val-HeFT) echocardiographic data. J Am Coll Cardiol. 2004;43:2022-27
Author contact
![]() Corresponding author: Yu-Lin Ko, MD, PhD, Division of Cardiology, Department of Internal Medicine, Taipei Tzu Chi Hospital, 289 Jianguo Road, Xindian District, New Taipei City 231, Taiwan. Tel.: 886-2-6628-9779 Ext: 5709; Fax: 886-2-6628-9009. E-mail: yulinkotwcom.tw.
Corresponding author: Yu-Lin Ko, MD, PhD, Division of Cardiology, Department of Internal Medicine, Taipei Tzu Chi Hospital, 289 Jianguo Road, Xindian District, New Taipei City 231, Taiwan. Tel.: 886-2-6628-9779 Ext: 5709; Fax: 886-2-6628-9009. E-mail: yulinkotwcom.tw.