Impact Factor ISSN: 1449-1907

 Global reach, higher impact
Int J Med Sci 2015; 12(6):494-501. doi:10.7150/ijms.11364 This issue Cite
Research Paper
Changes in Bone Biomarkers, BMC, and Insulin Resistance Following a 10-Week Whole Body Vibration Exercise Program in Overweight Latino Boys
David N. Erceg1, Lindsey J. Anderson1, Chun M. Nickles1, Christianne J. Lane2, Marc J. Weigensberg3, E. Todd Schroeder1 ![]()
1. The Clinical Exercise Research Center, Division of Biokinesiology and Physical Therapy at the School of Dentistry, University of Southern California, Los Angeles, USA
2. Center for Transdisciplinary Research on Energetics and Cancer, Keck School of Medicine, University of Southern California, Los Angeles, USA
3. Department of Pediatrics, Keck School of Medicine, University of Southern California, Los Angeles, USA
Received 2014-12-16; Accepted 2015-5-25; Published 2015-6-8
Abstract
Purpose: With the childhood obesity epidemic, efficient methods of exercise are sought to improve health. We tested whether whole body vibration (WBV) exercise can positively affect bone metabolism and improve insulin/glucose dynamics in sedentary overweight Latino boys. Methods: Twenty Latino boys 8-10 years of age were randomly assigned to either a control (CON) or 3 days/wk WBV exercise (VIB) for 10-wk.
Results: Significant increases in BMC (4.5±3.2%; p=0.01) and BMD (1.3±1.3%; p<0.01) were observed for the VIB group when compared to baseline values. For the CON group BMC significantly increased (2.0±2.2%; p=0.02), with no change in BMD (0.8±1.3%; p=0.11). There were no significant between group changes in BMC or BMD. No significant change was observed for osteocalcin and (collagen type I C-telopeptide) CTx for the VIB group. However, osteocalcin showed a decreasing trend (p=0.09) and CTx significantly increased (p<0.03) for the CON group. This increase in CTx was significantly different between groups (p<0.02) and the effect size of between-group difference in change was large (-1.09). There were no significant correlations between osteocalcin and measures of fat mass or insulin resistance for collapsed data.
Conclusion: Although bone metabolism was altered by WBV training, no associations were apparent between osteocalcin and insulin resistance. These findings suggest WBV exercise may positively increase BMC and BMD by decreasing bone resorption in overweight Latino boys.
Keywords: prepubescent, exercise, osteocalcin, insulin sensitivity, fat mass
Introduction
The continual metabolic processes of bone meet the functional demands of the body by maintaining skeletal structural integrity and acting as a mineral repository [1]. Bone metabolism may also exert an endocrine regulation of glucose homeostasis and body weight [2], potentially making bone an important determinant of type 2 diabetes. In children, physical inactivity and obesity have been linked to many health issues, including poor skeletal development [3, 4]. Abnormal bone metabolism has been associated with development of diabetes initiating the interest in understanding how diet and exercise impact bone metabolism and insulin sensitivity.
Dietary and exercise interventions have improved insulin sensitivity and osteocalcin [5, 6]; however, changes in osteocalcin levels and insulin sensitivity are not always related [5]. Fernandez-Real et al. [5] speculated that the mechanisms which lead to changes in insulin sensitivity from weight loss alone or from exercise may be different. The authors hypothesize that exercise may stimulate osteocalcin production in bone, which positively impacts insulin secretion and sensitivity. Developing exercise interventions to improve bone health in overweight children may help maintain glucose homeostasis and skeletal health into adulthood.
Poor bone development may be ameliorated or reversed with targeted interventions such as whole body vibration (WBV) exercise [7, 8]. Weight bearing WBV training involves the transfer of energy in the form of oscillatory motion from the machine to the body [9]. Vibration training can elicit a high degree of muscle activation through the tonic vibration reflex [10, 11]. In addition, skeletal loading is a non-invasive stimulus for bone metabolism [7, 8], increasing bone formation through an interaction between fluid shear forces and cellular mechanics [12].
To date, there is a limited number of clinical studies examining the effect of vibration training on bone metabolism in children. The majority of studies have been conducted in adults [7, 8, 13-19]; only two studies were conducted in a pediatric population [8, 15]. These pediatric studies demonstrated significant increases in trabecular BMD of ~2-6% and cortical BMD ~2-3%; however, both studies included children with physical disabilities or low BMD. It is unclear whether vibration training has the potential to induce changes in BMD in otherwise healthy, overweight children. The aims of this study were to: 1) determine the efficacy of vibration exercise for altering bone mineral density and content, 2) assess the effect of vibration exercise on bone biomarkers of formation (osteocalcin) and resorption (collagen type I C-telopeptide; CTx), and 3) determine the association between baseline osteocalcin and insulin sensitivity in overweight prepubertal Latino boys.
Methods
Participants
Following study approval from the Institutional Review Board, overweight Latino volunteers were recruited from the greater Los Angeles area. Participants were medically screened by a physician or nurse practitioner and satisfied the following criteria to be enrolled in the study: boy, 8-10 years of age, gender-specific BMI ≥ 85th percentile, [20] Latino ethnicity (i.e., parents and grandparents of Latino descent by self-report), and Tanner stage 1 [21]. Prepubertal Tanner stage 1 was selected to avoid confounding effects of changes in hormones associated with puberty on measures of insulin and bone. Participants were excluded from the study if they participated in any dietary, weight loss, or structured physical activity program within the prior 6 months, were using any medication, or were diagnosed with any disease that affects exercise, insulin, glucose regulation, or body composition.
Boys were enrolled in the study after providing their written assent and consent was obtained from their parent(s) or legal guardian(s). Thirty two prepubertal boys were randomized to either the control (CON) or whole body vibration exercise (VIB) groups. Participants randomized to the CON group were instructed to continue their normal daily routine for the 10-week study period.
Oral Glucose Tolerance Test (OGTT)
At around 7:00 a.m., after a 10-12 hour overnight fast, participants ingested 1.75 gram oral glucose solution/kg of body weight up to a maximum of 75 grams at time 0. Blood was sampled and assayed for glucose and insulin at time points -15, 30, 60, 90, 120, 150, and 180 min. Blood samples taken during the OGTT were centrifuged immediately to obtain plasma, stored on ice before being aliquoted, and stored at -70 ºC until assayed. The homeostasis model of assessment of insulin resistance (HOMA-IR) was calculated as [(If) x (Gf)]/22.5, where (If) is the fasting insulin level (µU/mL) and (Gf) is the fasting glucose level (mmol/L) [22]. Insulin and glucose area under the curve (AUC) values were calculated from the OGTT data using the trapezoidal rule [23]. Following the 10-wk intervention, the OGTT was repeated 48-72 hours after the last training session to minimize the acute effects of exercise on glucose/insulin dynamics.
Assays of Bone Biomarkers, Lipids, HbA1c, Glucose, and Insulin
Fasting blood samples were collected at baseline and following the 10-wk intervention on the scheduled OGTT visits. Samples were centrifuged immediately to obtain plasma, kept on ice before being aliquoted, and stored at -70 ºC until assayed. Osteocalcin (ng/mL) and CTx (pg/mL) were both measured using electrochemiluminescent immunoassay on the Roche Modular Analytics E170 (Quest Diagnostics Nichols Institute, San Juan Capistrano, CA). The intra- and interassay coefficients of variation for osteocalcin were < 2.7% and < 5.7%, and for CTx were <3.2% and <4.0%, respectively. Plasma was analyzed for total cholesterol, high-density lipoprotein (HDL) cholesterol, and triglycerides using the Ortho/Vitros DTII system (Ortho Diagnostics, Rochester, NY) in the CTU core laboratory. Plasma lipid concentrations for pre- and post-testing samples for each participant were run in the same assay to eliminate the effects of interassay variation. The CVs for the three lipids were < 4.5%, < 4.4%, and < 3.0%, respectively. LDL cholesterol was calculated as: LDL cholesterol = total cholesterol - HDL cholesterol - VLDL cholesterol; (VLDL cholesterol = triacylglycerols/5) [24].
Glucose was assayed using a Yellow Springs Instrument 2700 Analyzer (Yellow Springs Instrument, Yellow Springs, OH), with a membrane-bound glucose oxidase technique. Insulin was assayed using an immunoenzymetric assay method on an automated random-access enzyme immunoassay system Tosoh AIA 600 II analyzer (Tosoh Bioscience, Inc, San Francisco, CA; sensitivity 0.31 IU/ml, interassay CV 6.1%, intraassay CV 4.8%).
Body Composition
All participants underwent a total body dual-energy x-ray absorptiometry (DXA) scan (model DPX-IQ 2288; Lunar Radiation Corporation, Madison, WI, USA) to assess BMC, BMD, lean tissue, and fat mass. Quality assurance was performed daily using a single acrylic block to confirm accuracy and precision of the DXA system. The precision error of the Lunar DXA for BMD was 0.01g/cm2 for 68% of repeat scans. The same experienced investigator was responsible for performing and analyzing all scans.
Whole Body Vibration Exercise Program
Vibration training consisted of dynamic lower and upper body exercises on a vibration platform (NEXTgeneration, Power Plate®, USA). During all exercise sessions, participants wore socks only to standardize the possible dampening effects of different footwear. The exercises performed were: standard squat (knee angle 90-130°), wide-stance squat, calf raise, lunge, and modified push-up. Training intensity on the vibration platform was increased by: i) adding sets of exercises, ii) increasing the acceleration via frequency and/or amplitude modification and, iii) increasing the duration per set (Table 1). Supervised training was conducted 3 times per week on non-consecutive days to ensure at least 1 day of rest between exercise sessions. Participants were required to complete a minimum of 26 out of 30 (86%) training sessions to remain in the program.
10-week Whole Body Vibration Training Program
| Week | Acceleration (g) | Frequency (Hz) | Amplitude (mm) | Sets | Time/set (sec) | Volume (reps) | Rest (sec) | Vibration Duration (min) |
|---|---|---|---|---|---|---|---|---|
| 1 | 1.9 | 30 | Low | 7 | 30 | 10 | 30 | 3.0 |
| 2 | 2.5 | 30 | Low | 7 | 30 | 10 | 30 | 3.0 |
| 3 | 2.5 | 30 | Low | 12 | 30 | 10 | 30 | 8.5 |
| 4 | 3.8 | 30 | High | 12 | 45 | 15 | 30 | 8.5 |
| 5 | 3.8 | 30 | High | 15 | 45 | 15 | 30 | 10.8 |
| 6 | 5.0 | 30 | High | 18 | 45 | 15 | 30 | 12.8 |
| 7 | 5.0 | 35 | High | 16 | 60 | 15 | 30 | 14.5 |
| 8 | 5.0 | 35 | High | 19 | 60 | 20 | 30 | 17.0 |
| 9 | 6.2 | 40 | High | 19 | 60 | 20 | 30 | 17.0 |
| 10 | 6.2 | 40 | High | 22 | 60 | 20 | 30 | 20.0 |
Statistical Analysis
Data are expressed as the mean ± SD. All analyses were performed using Statistical Package of the Social Science version 16.0 (SPSS Inc, Chicago, IL) with statistical significance set by P < 0.05. Baseline characteristics and post-pre changes were conducted for participants who completed the study in its entirety (i.e., pre and post-testing) and the minimum number of training sessions. Data were assessed for normality and log transformed as necessary. Within group changes were determined using a paired samples t-test, while independent t-tests were used to assess between group differences at baseline. General Linear Model (GLM) was used to assess between group change scores controlling for baseline values. Pearson's correlations were conducted for osteocalcin and partial correlations were determined for BMC and BMD. The effect size (ES) changes were calculated by subtracting the mean change score in the VIB group from the mean change score in the CON group. The difference was then divided by the pooled standard deviation of the VIB and CON groups. An ES of 0.20 was considered a small effect, 0.50 a moderate effect, and 0.80 a large effect.
Results
Adverse Events, Training Compliance, and Dropouts
A training log for each participant was completed by the trainer. Additionally, before and after each exercise session participants were interviewed by the trainer to assess any potential detrimental effects and overall intensity of the vibration training. No adverse events related to vibration training were reported. A minimum of 27 out of 30 training sessions were completed by the participants whose data were analyzed. Of the 32 boys enrolled, 20 completed the study (CON = 9, VIB = 11); others withdrew for the following reasons: 2 did not complete the minimum number of training sessions, 1 was no longer interested in the program, 3 did not complete post-testing, 5 cited family reasons, and 1 withdrew because he was not randomized into the exercise group.
Bone Biomarkers and DXA Outcomes
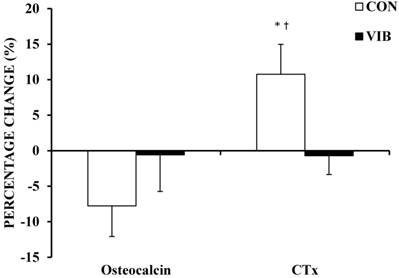
There were no significant baseline differences between groups for bone biomarkers or DXA measures of BMC and BMD (Table 2). Figure 1 shows a trend (-7.8%; p = 0.09) for a decrease in bone formation marker osteocalcin in the CON group following the 10-week period. There was no significant change in osteocalcin levels for the VIB group (-0.6%; p = 0.78). There was no significant difference in osteocalcin (p = 0.09) change scores between groups following the intervention. The intervention brought about a moderate ES of 0.46 for between-group osteocalcin. Bone resorption measure CTx significantly increased (10.8%; p = 0.03) following the 10-weeks in the CON group, but did not significantly change in the VIB group (-0.7%; p = 0.77). The increase in CTx by the CON group was significantly greater (p = 0.02) when compared to the VIB group with the intervention producing a large between-group ES of -1.09.
Percentage change in bone biomarkers. Percentage change in bone biomarkers osteocalcin and collagen type I c-telopeptide (CTx) following 10 weeks of intervention. CON, Control Group; VIB, Vibration Group. Data shown as mean ± SE. * Significant within group change, p < 0.05. † Significant between group change, p < 0.05.
Descriptive Characteristics of Study Participants
| Control (N=9) | Vibration Exercise (N=11) | ||||
|---|---|---|---|---|---|
| Pretest | Post-test | Pretest | Post-test | P-value* | |
| Age (years) | 9±1 | 9±1 | 9±1 | 9±1 | 0.53 |
| Weight (kg) | 57.8±18.5 | 58.7±18.6‡ | 45.7±7.8 | 48.4±8.5‡ | 0.05 |
| Height (cm) | 145.6±9.2 | 146.9±9.8 | 139.3±5.2 | 140.6±5.4 | 0.83 |
| BMI Percentile | 96.2±4.0 | 95.2±5.5 | 95.9±4.1 | 96.2±4.0 | 0.13 |
| HbA1c (%) | 5.68±0.2 | 5.67±0.3 | 5.55±0.3 | 5.58±0.4 | 0.63 |
| HOMA-IR | 5.53±5.3 † | 4.38±5.9 | 1.26±0.85 | 1.91±1.31 | 0.45 |
| % Body Fat | 42.6±8.5 | 42.9±9.5 | 38.4±8.2 | 37.7±9.4 | 0.63 |
| Total Fat Mass (kg) | 24.1±11.7 | 24.7±12.5 | 17.2±5.8 | 17.6±6.5 | 0.62 |
| Trunk Fat (kg) | 10.5±5.1 | 10.8±5.2 | 7.6±2.7 | 7.8±3.1 | 0.82 |
| DXA BMC (g) | 1677±301 | 1712±402‡ | 1421±224 | 1483±227‡ | 0.13 |
| DXA BMD (g/cm2) | 0.970±0.074 | 0.978±0.078 | 0.950±0.081 | 0.962±0.080‡ | 0.41 |
| Osteocalcin (ng/mL) | 74.3±21.2 | 67.0±15.4 | 83.6±18.2 | 81.8±16.0 | 0.09 |
| CTx (pg/mL) | 1496±326 | 1637±302‡ | 1473±268 | 1462±292 | 0.02 |
| Total cholesterol (mg/dL)§ | 138.6±25.8 | 138.1±32.3 | 148.1±25.8 | 150.0±21.8 | 0.50 |
| LDL (mg/dL)§ | 77.3±21.1 | 82.5±24.8 | 81.0±22.0 | 81.4±20.6 | 0.51 |
| HDL (mg/dL)§ | 38.8±7.7† | 38.8±9.9 | 49.3±7.3 | 50.2±6.8 | 0.34 |
| Triglycerides (mg/dL)§ | 112.9±62.6 | 84.6±44.4‡ | 89.2±30.1 | 91.9±34.6 | 0.01 |
Data are mean ± SD; BMI body mass index, HbA1c glycated hemoglobin, HOMA-IR homeostatic model assessment of insulin resistance, DXA dual-energy x-ray absorptiometry, BMC bone mineral content, BMD bone mineral density, CTx collagen type I c-telopeptide, LDL low density lipoprotein cholesterol, HDL high density lipoprotein cholesterol. *Between group change, adjusted for baseline; † Significant between group baseline p<0.05; ‡ Significant with-in group change p<0.05; § Control group N = 8
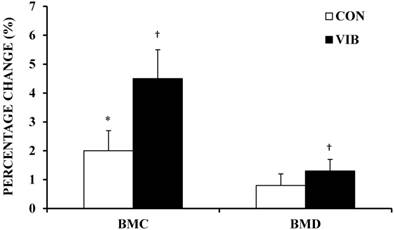
BMD increased on average for the CON group (0.8 ± 1.3%) and VIB group (1.3 ± 1.3%); however, the increase in BMD was only significant for the VIB group (p < 0.01). After 10 weeks, BMC significantly increased by 2.0 ± 2.2% and 4.5 ± 3.2% in the CON (p = 0.02) and VIB (p = 0.01) groups, respectively (Figure 2). There were no significant differences in BMD or BMC change scores when the CON group was compared to the VIB group. The intervention resulted in small (0.36) and moderate (0.66) ES for between-group change in BMD and BMC, respectively.
Percentage change in bone mineral content and density. Bone mineral content (BMC) and bone mineral density (BMD) percentage change following 10 weeks of intervention. CON, Control Group; VIB, Vibration Group. Data shown as mean ± SE. * Significant within group change, p < 0.05. † Significant within group change, p ≤ 0.01.
Osteocalcin, Body Composition, and Insulin Resistance
There were no significant correlations between unadjusted osteocalcin and weight, BMI, total fat mass, trunk fat mass, lean tissue mass, or HOMA-IR at baseline for the cohort (Table 3). However, osteocalcin was significantly negatively correlated with unadjusted BMC (p = 0.02) and BMD (p = 0.03) at baseline.
Baseline unadjusted Pearson's Correlations for Osteocalcin (N=20)
| Osteocalcin | ||
|---|---|---|
| r | P-value | |
| Weight (kg) | -0.30 | 0.21 |
| BMI (kg/m2) | -0.35 | 0.13 |
| Total Fat (kg) | -0.35 | 0.13 |
| Trunk Fat (kg) | -0.33 | 0.15 |
| Lean Tissue (kg) | -0.32 | 0.17 |
| HOMA-IR | -0.20 | 0.39 |
| BMC (g) | -0.51 | 0.02* |
| BMD (g/cm2) | -0.48 | 0.03* |
BMI body mass index, HOMA-IR homeostatic model assessment of insulin resistance, BMC bone mineral content, BMD bone mineral density, HOMA-IR homeostatic model assessment of insulin resistance. * Significant correlation p<0.05
HOMA-IR was significantly positively associated with unadjusted BMD (r = 0.47; p = 0.04) and BMC (r = 0.60; p = 0.05) at baseline.
Unadjusted BMC significantly correlated pre and post with trunk fat mass (r = 0.82-0.83; p < 0.001) and total fat mass (r = 0.84-0.85; p < 0.001). After adjusting for differences in lean tissue mass the coefficient remained significant for total fat mass only (r = 0.60; p = 0.006).
Reported in Table 4 are baseline partial correlations of BMC (adjusted for height and weight) and BMD (adjusted for weight). BMC was positively associated with weight and height (all p < 0.001), while BMD only correlated with weight (p = 0.02). Both BMC and BMD correlated negatively with HbA1c levels (r = -0.51 and r = -0.52, respectively; p ≤ 0.05). A significant negative association between osteocalcin and BMC was observed (r = -0.47; p = 0.05).
Partial correlations with bone mineral content (adjusted for height and weight) and bone mineral density (adjusted for weight).
| BMC | BMD | |||
|---|---|---|---|---|
| (N = 20) | r | P-value | r | P-value |
| Weight* | 0.84 | < 0.001‡ | 0.52 | 0.02‡ |
| Height* | 0.72 | < 0.001‡ | 0.30 | 0.22 |
| Total Fat | 0.05 | 0.86 | 0.15 | 0.57 |
| Trunk Fat | -0.12 | 0.66 | 0.16 | 0.54 |
| Total Cholesterol† | -0.29 | 0.27 | -0.17 | 0.51 |
| HDL-C† | -0.17 | 0.53 | -0.17 | 0.52 |
| LDL-C† | -0.37 | 0.16 | -0.27 | 0.28 |
| Triglycerides† | 0.22 | 0.42 | 0.41 | 0.10 |
| HbA1c | -0.51 | 0.05‡ | -0.52 | 0.03‡ |
| Fasting Glucose (mg/dl) | -0.14 | 0.60 | -0.27 | 0.29 |
| 2-h Glucose (mg/dl) | 0.04 | 0.88 | -0.04 | 0.88 |
| Glucose AUC180 | -0.20 | 0.45 | -0.14 | 0.58 |
| Fasting Insulin (μU/ml) | -0.02 | 0.95 | 0.01 | 0.98 |
| 2-h Insulin (μU/ml) | -0.02 | 0.94 | -0.17 | 0.51 |
| Insulin AUC180 | 0.08 | 0.78 | 0.12 | 0.65 |
| HOMA-IR | -0.03 | 0.92 | -0.02 | 0.96 |
| Osteocalcin | -0.47 | 0.05‡ | -0.38 | 0.13 |
AUC area under the curve, HOMA-IR homeostatic model assessment of insulin resistance, HDL-C high-density lipoprotein cholesterol, LDL-C low-density lipoprotein cholesterol, HbA1c glycosylated hemoglobin. * Not adjusted for height or weight; † N = 19; ‡ Significant correlation p≤0.05
Discussion
With studies suggesting that bone metabolism may be closely linked to metabolic disorders, the present study was designed to: 1) assess the effects of vibration as a potential bone stimulus in overweight Latino boys, 2) determine changes in the association between bone and metabolic health measures following the intervention, and 3) assess the correlation between osteocalcin and insulin sensitivity in prepubertal overweight Latino boys. Our results imply that a controlled 10-week WBV exercise program may significantly improve bone metabolism, as suggested by larger percent increases in BMD and BMC in the treatment group. While the percentage increase in BMC and BMD post intervention were higher for the VIB group compared to the CON group, the between group differences were not statistically significant. The improvement in bone metabolism for the VIB group most likely resulted from attenuation of bone resorption as indicated by resorption marker CTx when compared to non-exercising controls. Osteocalcin levels did not significantly change in either the VIB or CON group or for the combined cohort, and were not significantly correlated with insulin resistance as measured by HOMA-IR pre (p = 0.39) or post (p = 0.69) intervention.
The effect of WBV on bone metabolism was previously studied in children with physical impairments including diabetes mellitus, idiopathic osteoporosis, cerebral palsy, or muscular dystrophy [8, 15]. Post intervention results for those two studies demonstrate a significant increase in trabecular (2.1%; 6.2%) and cortical (3.4%; 2.1%) BMD compared to controls when using a mechanical vibratory stimulus. These findings are greater than the increase (1.3%) in BMD for the present study. Differences in BMD increases may be attributed to the health of the population studied, length of intervention, type of vibratory stimulus, and use of site specific quantitative computed tomography to measure BMD. Perhaps a more important concern than inducing changes in BMD is effecting change in BMC in children. Low BMC and high adiposity are associated with increased risk of fracture after adjusting for bone size in children [25, 26]. The significant increase we observed in BMC for both groups post-intervention may be due in part to maturation or changes in physical activity. However, habitual activities were maintained throughout the study duration as confirmed by interview with participants and guardians. The percentage increase in BMC for the VIB group was more than two fold compared to the CON group (4.5% vs. 2.0%). Although not significant between groups, the changes in BMC and CTx suggest the vibratory stimulus utilized in the current study may stimulate bone growth, which could help to reduce future fracture risk in this population.
When examining the bone formation marker osteocalcin and the resorption marker CTx, our study demonstrated that CTx significantly increased (11%) in the CON group with minimal change on average in the VIB group (-1%). Furthermore, osteocalcin tended to decrease by 8% (p = 0.09) in the CON and -1% in the VIB groups. This data suggests that WBV exercise may selectively improve bone mass by preventing a decrease in osteoblastic activity and an increase in osteoclastic activity. Our findings are in agreement with Xie et al.[27] who used an animal model to investigate the effects of mechanical vibrations on eight-week-old mice. Their results showed that vibration reduced osteoclastic activity and increased bone formation in the presence of normal growth.
Lee et al. [2, 28] established the novel link between bone metabolism and glucose homeostasis, insulin sensitivity, and fat metabolism using an osteocalcin deficient animal model. Mice lacking osteocalcin had reduced β-cell proliferation, glucose intolerance, and reduced insulin sensitivity. Based on these findings, we sought to determine if there is a relationship between bone parameters (i.e., osteocalcin, BMD, and BMC), fat mass, and insulin sensitivity in overweight Latino boys.
Unadjusted osteocalcin was negatively correlated with weight, BMI, total fat mass, trunk fat mass, and insulin resistance; however, these associations were not significant. The negative association between osteocalcin, BMI, and insulin resistance is in agreement with previous studies in children and adults demonstrating significant negative correlations [5, 6, 29]. Reinehr et al. [6] examined the link between osteocalcin and insulin resistance in a population with a high proportion of prepubertal participants (~48%) and found a moderate correlation between osteocalcin and BMI (r= -0.36, p < 0.001) or HOMA-IR (r =-0.42, p = <0.001). The same investigators found that, after one year, a small cohort (N = 29) of obese children lost weight with a concomitant significant increase in osteocalcin and a decrease in HOMA-IR. However, it is undetermined whether the changes in osteocalcin levels resulted from weight loss, diet, or physical activity.
Pollock et al. [4] compared BMC in prepubertal overweight children with normal glucose tolerance to those with pre-diabetes status. BMC was 4% lower in overweight children with pre-diabetes after adjusting for sex, race, height, and weight or lean tissue mass. Additionally, inverse associations were found with markers of insulin resistance. We also report that BMC negatively correlated with measures of insulin resistance after adjusting for weight. While the associations found in the current study were not significant, they were similar to the findings by Pollock et al. [4] However, in contrast to Pollock et al., [4] the adjusted correlation between BMC and osteocalcin levels was significant (p = 0.05) pre-intervention for the current cohort.
Osteocalcin may not only act to regulate glucose metabolism but is also important for the mineralization of bones. To the best of our knowledge this is the first report to demonstrate a significant negative association between osteocalcin and BMC in prepubertal overweight boys. Our data shows lower levels of osteocalcin being reflective of higher BMC and thus better bone health. However, prepubertal normal weight children have significantly higher levels of osteocalcin when compared to obese counterparts [6] and, therefore, would allow for greater mineralization of bone. This information suggests that potentially detrimental alterations in bone turnover are occurring with obesity at a very young age, preventing normal bone maturation. Studies in adults demonstrate that bone turnover is lower in patients with diabetes and can be increased with improved glycemic control [30]. In the present study, WBV training appears to have a positive effect on the coupling between osteoblast and osteoclast activity, resulting in greater bone mineralization when compared to non-exercising controls. Osteocalcin levels trended toward a decline in the CON group, suggesting a reduction in bone formation. Our data also suggests that WBV exercise in overweight children may help to restore/maintain normal bone turnover and mineralization with maturation.
Since the establishment of a reciprocal relationship between bone and fat metabolism in animal models by Lee and Karsenty [28], cross-sectional studies have focused on exploring the association between fat mass and bone mass in humans. To date, a limited number of studies have been conducted in a pediatric population examining the effect of fat mass on BMC [4, 26, 31-33]. Results have been inconclusive due to the variable methods used to measure fat mass and bone (i.e., DXA, computed tomography, or MRI) and differences in gender, race, age, selection of bone, and fat depots used in the analysis (e.g., visceral fat measures or total body fat mass). Of the pediatric studies, the general finding is that abdominal adipose tissue is significantly negatively correlated to BMC in Caucasians, African Americans, and Latino children [4, 32, 33]. Of the aforementioned studies, only Pollock et al. has examined the relationship between total fat mass and BMC [4]. Their findings showed a positive association with total fat mass and BMC (beta = 0.16, p = 0.01) when adjusted for sex, race, height, and lean tissue mass. Visceral adipose tissue (beta = -0.13, p = 0.03) and subcutaneous abdominal adipose tissue (beta = -0.34, p = 0.02) were inversely associated with BMC after controlling for sex, race, height, lean tissue, and fat mass in children with and without pre-diabetes. This led the investigators to conclude that higher levels of central adiposity may be a primary factor responsible for deleterious bone growth in prepubertal children. Although not statistically significant, our findings are in agreement, suggesting a positive association between BMC and total fat mass and a negative association with trunk fat mass after adjusting for height and weight.
Important to the design of our study was the inclusion of a non-exercising control group. Growth and maturation of children are often responsible for changes in weight and body composition. Although novel in its approach, this study has several limitations. First, the sample size for each group was not large enough to justify conclusions about the effects of vibration exercise on metabolic outcomes. Initially, the study participants were normally distributed, however greater Con group variability was evident following randomization and dropouts. The use of GLM was used to control for baseline differences when examining between group changes. Second, we were not able to control for the amount of physical activity or nutrition of participants during the intervention; although, all participants were advised to continue normal daily activities and dietary habits throughout the program. The use of OGTT and HOMA-IR to detect changes in insulin sensitivity is another limitation. It is possible that true changes in insulin sensitivity may have occurred but were undetected due to the relatively low sensitivity of HOMA-IR compared to more sensitive measures such as the euglycemic clamp. However, the clamp method is more invasive and would have increased the difficulty of recruiting in this young population and potentially prevented the inclusion of a control group. In animal models, the uncarboxylated form of osteocalcin has been shown to affect β-cell insulin secretion and increase insulin sensitivity. The present study measured total osteocalcin which may be the reason why no associations or changes were found between osteocalcin and insulin resistance or bone mass. Pollock et al. [4] measured total, uncarboxylated, and carboxylated osteocalcin and found no association with BMC. Although the intent of the study was to determine the efficacy of vibration for inducing bone development in this population, it is unknown if exercise alone was primarily responsible for the observed bone development. Also, the precision error of DXA BMD scans can be influenced by obesity, weight change, heterogeneous distribution of adipose tissue external to bone and variations in marrow composition within bone. Participants who are heavier generally have a greater thickness of soft tissue. The soft tissue acts to attenuate the DXA energy which may lead to less precise measurement [34]. Caution should be used when interpreting BMD changes in the present cohort since participants' body composition was heterogeneous between groups and changed overtime.
Further studies incorporating an exercise only arm in the design are warranted to parse out the effect of vibration exercise.
Conclusion
In conclusion, we report that in at-risk overweight prepubertal Latino boys, a 10-week WBV intervention can positively alter bone metabolism by increasing bone mass through attenuation in bone resorption that may occur from being overweight. Although bone metabolism was changed, no associations were apparent with changes in insulin resistance (HOMA-IR). Studies using a pediatric population and vibration exercise training are required to further elucidate the bone-fat-pancreas axis.
Acknowledgements
We thank all the study participants and their families for participating in this study and the trainers for their supervision of participant exercise sessions.
Competing Interests
All authors state that they have no conflicts of interest. This study was supported by the Gary Hall Jr., Foundation for Diabetes and the University of Southern California Clinical Exercise Research Center and Clinical Trials Unit. We also acknowledge PowerPlate® USA for the use of their equipment.
References
1. Zaidi M. Skeletal remodeling in health and disease. Nat Med. 2007;13:791-801
2. Lee NK, Sowa H, Hinoi E. et al. Endocrine regulation of energy metabolism by the skeleton. Cell. 2007;130:456-469
3. Gunter KB, Almstedt HC, Janz KF. Physical activity in childhood may be the key to optimizing lifespan skeletal health. Exerc Sport Sci Rev. 2012;40:13-21
4. Pollock NK, Bernard PJ, Wenger K. et al. Lower bone mass in prepubertal overweight children with prediabetes. J Bone Miner Res. 2010;25:2484-2493
5. Fernandez-Real JM, Izquierdo M, Ortega F. et al. The relationship of serum osteocalcin concentration to insulin secretion, sensitivity, and disposal with hypocaloric diet and resistance training. J Clin Endocrinol Metab. 2009;94:237-245
6. Reinehr T, Roth CL. A new link between skeleton, obesity and insulin resistance: relationships between osteocalcin, leptin and insulin resistance in obese children before and after weight loss. Int J Obes (Lond). 2010;34:852-858
7. Gilsanz V, Wren TA, Sanchez M. et al. Low-level, high-frequency mechanical signals enhance musculoskeletal development of young women with low BMD. J Bone Miner Res. 2006;21:1464-1474
8. Ward K, Alsop C, Caulton J. et al. Low magnitude mechanical loading is osteogenic in children with disabling conditions. J Bone Miner Res. 2004;19:360-369
9. Jordan MJ, Norris SR, Smith DJ. et al. Vibration training: an overview of the area, training consequences, and future considerations. J Strength Cond Res. 2005;19:459-466
10. Roelants M, Verschueren SM, Delecluse C. et al. Whole-body-vibration-induced increase in leg muscle activity during different squat exercises. J Strength Cond Res. 2006;20:124-129
11. Hagbarth KE, Eklund G. Tonic vibration reflexes (TVR) in spasticity. Brain Res. 1966;2:201-203
12. Hsieh YF, Turner CH. Effects of loading frequency on mechanically induced bone formation. J Bone Miner Res. 2001;16:918-924
13. Verschueren SM, Roelants M, Delecluse C. et al. Effect of 6-month whole body vibration training on hip density, muscle strength, and postural control in postmenopausal women: a randomized controlled pilot study. J Bone Miner Res. 2004;19:352-359
14. Russo CR, Lauretani F, Bandinelli S. et al. High-frequency vibration training increases muscle power in postmenopausal women. Arch Phys Med Rehabil. 2003;84:1854-1857
15. Pitukcheewanont P, Safani D. Extremely low-level, short-term mechanical stimulation increases cancellous and cortical bone density and muscle mass of children with low bone density - A pilot study. Endocrinologist. 2006;16:128-132
16. Gusi N, Raimundo A, Leal A. Low-frequency vibratory exercise reduces the risk of bone fracture more than walking: a randomized controlled trial. BMC Musculoskelet Disord. 2006;7:92
17. Rubin C, Recker R, Cullen D. et al. Prevention of postmenopausal bone loss by a low-magnitude, high-frequency mechanical stimuli: a clinical trial assessing compliance, efficacy, and safety. J Bone Miner Res. 2004;19:343-351
18. Torvinen S, Kannus P, Sievanen H. et al. Effect of 8-month vertical whole body vibration on bone, muscle performance, and body balance: a randomized controlled study. J Bone Miner Res. 2003;18:876-884
19. Iwamoto J, Takeda T, Sato Y. et al. Effect of whole-body vibration exercise on lumbar bone mineral density, bone turnover, and chronic back pain in post-menopausal osteoporotic women treated with alendronate. Aging Clin Exp Res. 2005;17:157-163
20. Kuczmarski RJ, Ogden CL, Guo SS. et al. 2000 CDC Growth Charts for the United States: methods and development. Vital Health Stat 11. 2002:1-190
21. Marshall WA, Tanner JM. Variations in the pattern of pubertal changes in boys. Arch Dis Child. 1970;45:13-23
22. Matthews DR, Hosker JP, Rudenski AS. et al. Homeostasis model assessment: insulin resistance and beta-cell function from fasting plasma glucose and insulin concentrations in man. Diabetologia. 1985;28:412-419
23. Brouns F, Bjorck I, Frayn KN. et al. Glycaemic index methodology. Nutr Res Rev. 2005;18:145-171
24. Warnick GR, Knopp RH, Fitzpatrick V. et al. Estimating low-density lipoprotein cholesterol by the Friedewald equation is adequate for classifying patients on the basis of nationally recommended cutpoints. Clin Chem. 1990;36:15-19
25. Goulding A, Jones IE, Taylor RW. et al. Bone mineral density and body composition in boys with distal forearm fractures: a dual-energy x-ray absorptiometry study. J Pediatr. 2001;139:509-515
26. Goulding A, Taylor RW, Jones IE. et al. Overweight and obese children have low bone mass and area for their weight. Int J Obesity. 2000;24:627-632
27. Xie L, Jacobson JM, Choi ES. et al. Low-level mechanical vibrations can influence bone resorption and bone formation in the growing skeleton. Bone. 2006;39:1059-1066
28. Lee NK, Karsenty G. Reciprocal regulation of bone and energy metabolism. Trends Endocrinol Metab. 2008;19:161-166
29. Pittas AG, Harris SS, Eliades M. et al. Association between serum osteocalcin and markers of metabolic phenotype. J Clin Endocrinol Metab. 2009;94:827-832
30. Rosato MT, Schneider SH, Shapses SA. Bone turnover and insulin-like growth factor I levels increase after improved glycemic control in noninsulin-dependent diabetes mellitus. Calcified Tissue International. [Clinical TrialResearch Support, Non-U.S. Gov't Research Support, U.S. Gov't, P.H.S.]. 1998;63:107-111
31. Ellis KJ, Shypailo RJ, Wong WW. et al. Bone mineral mass in overweight and obese children: diminished or enhanced? Acta Diabetol. [Comparative StudyResearch Support, U.S. Gov't, Non-P.H.S.]. 2003;40(Suppl 1):S274-277
32. Afghani A, Goran MI. The interrelationships between abdominal adiposity, leptin and bone mineral content in overweight Latino children. Horm Res. 2009;72:82-87
33. Afghani A, Goran MI. Racial differences in the association of subcutaneous and visceral fat on bone mineral content in prepubertal children. Calcif Tissue Int. 2006;79:383-388
34. Rajamanohara R, Robinson J, Rymer J. et al. The effect of weight and weight change on the long-term precision of spine and hip DXA measurements. Osteoporosis international: a journal established as result of cooperation between the European Foundation for Osteoporosis and the National Osteoporosis Foundation of the USA. 2011;22:1503-1512
Author contact
![]() Corresponding author: David N. Erceg, 1540 E. Alcazar St. CHP-155, Los Angeles, CA 90033, USA; E-mail: ercegedu; Tel: 1-323-442-2180; Fax: 1-323-442-1515
Corresponding author: David N. Erceg, 1540 E. Alcazar St. CHP-155, Los Angeles, CA 90033, USA; E-mail: ercegedu; Tel: 1-323-442-2180; Fax: 1-323-442-1515