Impact Factor ISSN: 1449-1907

 Global reach, higher impact
Int J Med Sci 2015; 12(5):378-386. doi:10.7150/ijms.11224 This issue Cite
Research Paper
Reduction of QTD - A Novel Marker of Successful Reperfusion in NSTEMI. Pathophysiologic Insights by CMR
Christoph J. Jensen1 ![]() , Sarah Lusebrink1, Alexander Wolf1, Thomas Schlosser2, Kai Nassenstein2, Christoph K. Naber1, Georg V. Sabin1, Oliver Bruder1
, Sarah Lusebrink1, Alexander Wolf1, Thomas Schlosser2, Kai Nassenstein2, Christoph K. Naber1, Georg V. Sabin1, Oliver Bruder1
1. Contilia Heart and Vascular Center, Department of Cardiology and Angiology, Elisabeth Hospital Essen, Germany;
2. Department of Diagnostic and Interventional Radiology and Neuroradiology, University of Essen, Germany.
Received 2014-12-2; Accepted 2015-4-7; Published 2015-5-3
Abstract
Background/Objectives: Non-ST segment elevation myocardial infarction (MI) poses similar detrimental long-term prognosis as ST-segment elevation MI. No marker on ECG is established to predict successful reperfusion in NSTEMI. QT dispersion is increased by myocardial ischemia and reduced by successful restoration of epicardial blood flow by PCI. Whether QT dispersion reduction translates to smaller infarcts and thus indicates successful reperfusion is unknown.
We hypothesized that the relative reduction of QT dispersion (QTD-Rrel ) on a standard ECG in acutely reperfused NSTEMI is related to infarct size and infarct transmurality as assessed by delayed enhancement CMR (DE-CMR).
Methods and Results: 69 patients with a first acute NSTEMI were included. QTD-Rrel was stratified according to LV function and volumes, infarct transmurality and size as assessed by DE-CMR. Extensive myocardial infarction was defined as above median infarct size.
LV function and end-systolic volume were only mildly related to QTD-Rrel . QTD-Rrel was inversely related to infarct size (r=-0.506,p=0.001) and infarct transmurality (r=-0.415, p=0.001). QTD-Rrel was associated with extensive myocardial infarction in univariate analysis (odds ratio (OR) 0.958, CI 0.935-0.982; p=0.001). Compared to clinical and angiographic data QTD-Rrel remained the only independent predictor of non-transmural infarcts (OR 1.110, CI 1.055-1.167; p=0.049).
Conclusion: In patients with acute Non-ST-Segment Myocardial infarction QTd-Rrel calculated on a surface ECG prior and post PCI for restoration of epicardial blood flow detects small, non-transmural infarcts as assessed by delayed enhancement CMR. Thus, QTd-Rrel can indicate successful reperfusion therapy.
Keywords: acute myocardial infarction, non-ST-elevation myocardial infarction, QT dispersion, cardiac magnetic resonance imaging.
Introduction
Stopping the transmural progression of myocardial infarcts is a fundamental concept of acute reperfusion therapy and thus limits final infarct size. Infarct size strongly determines prognosis after AMI [1]. Additionally, the transmural extent of infarction predicts improvement in left ventricular function [2]. Markers of successful reperfusion in AMI should therefore reflect infarct size and non-transmural infarction. In general, AMI is categorized in ST-elevation MI (STEMI) and Non-ST-elevation MI (NSTEMI) by the presence or absence of ST segment elevation on the surface electrocardiogram (ECG) [3]. Whereas in STEMI, the extent and recovery of ST segment elevation are markers of extensive myocardial infarction [4], in NSTEMI no such marker is clinically established.
On a standard ECG the QT interval reflects myocardial repolarization of different myocardial areas [5]. The interlead difference of QT intervals on a surface ECG is defined as QT dispersion. In AMI QT dispersion is prolonged by the extent of myocardial ischemia [6] [7] and can be reduced by successful reperfusion [8] [9]. Whether this reduction of QTd (QTd-R) by reperfusion in AMI reflects infarct size and translates to non-transmural infarcts is unknown. Cardiac magnetic resonance imaging (CMR) is becoming more and more accepted worldwide and is increasingly implemented in clinical decision pathways in various diseases [10]. CMR using the delayed enhancement technique (DE-CMR) depicts the size and visualizes the transmurality of acute myocardial infarction with high reproducibility [11] [12] [13]. Furthermore, delayed-enhancement CMR has been extensively validated against histopathology [11] [14].
In this study we sought to determine whether the reduction of QT dispersion on a standard ECG in acutely reperfused NSTEMI is related to infarct size and infarct transmurality as assessed by DE-CMR.
Methods
Patient selection
Patients were screened for this study, which were admitted to the department of cardiology at our institution for first documented NSTEMI treated by primary PCI between july 2008 and November 2008, and agreed to undergo CE-CMR as part of the EuroCMR registry. Methods description of the EuroCMR registry was published previously [10] [15] [16]. Patients were enrolled if they fulfilled following criteria [17]: i) chest pain; ii) elevated troponin t; iii) persistent or transient ST-segment depression or T-wave inversion, or no ECG changes. Exclusion criteria were: i) prior cardiac surgery for any reason; ii) prior percutaneous coronary intervention (PCI); iii) prior documented myocardial infarction; iv) congential heart disease (except bicuspid aortic valve, persistent foramen ovale); v) QRS duration >120ms; vi) rhythm other than sinusrhythm; vii) pacemaker or ferromagnetic devices viii) known contraindications for CMR or contrast agent.
The study conforms to the ethical guidelines of the 1975 Declaration of Helsinki. Ethics committee approved data collection and every patient gave written informed consent prior to CMR. Clinical data and blood samples were collected as part of the routine diagnostic work-up.
Electrocardiographic and QT dispersion measurements
A 12 lead resting ECG was obtained in each patient with 50mm/s paper speed and 10 mm/mV amplitude before and within 90 minutes after PCI. All ECGs were blinded for patient data and ECG timing, scanned at a 600dpi resolution and interpolated by the factor 2. Computer-based analysis was performed by two observers (S.L., C.J.), who were blinded to each other's results, patients clinical status, X-ray coronary angiography and CE-CMR results. Mean values of both observers are displayed in this manuscript.
The QT interval was measured from the beginning of the QRS complex to the end of the T wave [18] using following criteria: i) end of T wave was defined as the return of its descending limb to isoelectric baseline; ii) isoelectric baseline was defined by the reference line between two pq intervals; iii) in case of an U wave the end of the T wave was defined as the nadir between the T and the U wave; iv) if the T wave could not be reliably determined (for amplitudes <50 μV), leads were excluded from the analysis. Dispersion of QT (QTd) intervals was calculated at the difference between the maximum and the minimum QT interval recorded in any ECG lead. QTd was calculated for each patient twice (before and after PCI). Absolute reduction of QTd (QTd-Rabs) was calculated fusing the ECGs prior PCI and post PCI. The relative reduction of QTd (QTd-Rrel) from prior PCI to post PCI was defined as follows: [(QTd prior - QTd post PCI)/QTd prior PCI] x 100 [18].
X-ray Coronary Angiography
Coronary angiography was performed according to standard clinical practice (Axiom, Siemens Healthcare) for primary PCI. The infarct related artery and culprit lesion was evaluated on the basis of angiographic characteristics of the lesion. Therapeutic decision was made at the discretion of an interventional cardiologist, who was blinded to CMR data. Aim of primary PCI was complete restoration of epicardial blood flow (TIMI grade 3 flow). TIMI flow grade was recorded prior and post PCI.
Delayed-Enhancement Magnetic Resonance Imaging
Acquisition
Images were acquired on a standard 1.5 T MR system (Magnetom Avanto, Siemens Medical Solution, Erlangen, Germany) using a phased-array coil during multiple breath holds. Steady-state free precession (SSFP) cine sequences in short-axis orientation covering the entire left ventricle (LV) and three long axis planes were acquired for calculation of LV function. Typical settings are as follows: repetition time, 3ms; echo time, 1.12ms; flip angle, 77°; temporal resolution, 39ms; slice thickness, 6mm; interslice gap, 20%; in plane resolution 1.5x1.8mm). For detection of microvascular obstruction inversion-recovery single-shot steady-state free precession sequences were performed early after contrast agent injection (gadoterate meglumine, 0.15mmol/kgBW) [19] [20] (in plane resolution 1.8x2.3mm, temporal resolution 200-230ms). 10 minutes after contrast standard delayed enhancement images were acquired in the same long - and short-axis orientations as the described SSFP cine sequences, with inversion-recovery segmented gradient echo sequences (IR-GRE, in plane resolution 1.5x1.9mm, temporal resolution 160-190ms). Inversion times were adjusted to null normal myocardium (inversion time, 260-350ms). Imaging time was typically 30-40 minutes.
Analysis
CMR scans were placed in random order and analyzed masked to clinical data and coronary angiography results. Cine, microvascular obstruction and delayed enhancement images were evaluated separately. LV function and mass was calculated by tracing the end-diastolic and end-systolic endocardial borders in short-axis images using the disc-summation method [19]. The presence of microvascular obstruction and delayed enhancement was assessed by two observers blinded to each other results (C.J., A.W.).
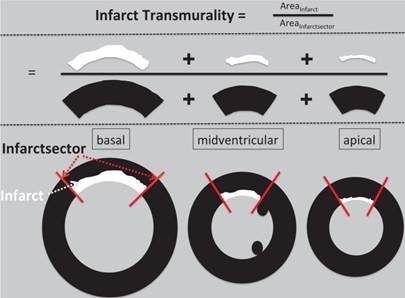
The extent of delayed enhancement was evaluated by the number of hyperenhanced segments using a standard 17-segment model of the LV. Delayed enhancement analysis was performed after transferring the data to a commercially available analysis package (Mass analysis, Medis, Leiden, and The Netherlands). Infarcted areas were defined as enhanced areas within the endocardial and epicardial border having signal intensity above 5SD above remote myocardium. The average infarct transmurality was calculated as the ratio of the area of delayed enhancement to the area of the infarct sector (figure 1). Non-transmural infarcts were defined as less than 50% transmurality [21 22]. Total microvascular obstruction volumes (MVO) and total delayed enhancement volumes were expressed as percentage of LV mass.
Methods figure how we calculated mean infarct transmurality. The infarct sector was defined by the infarct lateral border (red line) in every slice and the area of infarct sector was summed up on a per heart basis. The area of delayed enhancement (above 5SD compared to remote myocardium) was traced and summed up for every slice. The average infarct transmurality was calculated as the ratio of the area of delayed enhancement to the area of the infarct sector and expressed as percentage.
Statistical Analysis
Continuous, normal distributed variables are expressed as mean ± standard deviation and compared by Mann-Whitney test. Normal distribution was tested by the one-sample Kolmogorov-Smirnov test. Correlation between continuous variables was described by pearson testing. Frequencies were compared by the fisher exact test. Subjects were stratified according to infarct size (above median infarct size=extensive infarcts) and according to tertiles of relative QTd reduction; lowest QTd-Rrel was grouped in the first tertile, and largest in the third tertile. Differences among QTd-Rrel groups were evaluated using Kruskal-Wallis test. Interobserver agreement on continuous variables was assessed by the intraclass correlation coefficient and on ordinal variables using kappa statistics. Univariate logistic regression analysis was performed for clinical, enzyme levels, angiographic data and electrocardiographic parameters to identify predictors for detection of extensive infarction, as well as non-transmural infarcts, table 3 and 4. Parameters entered multivariate logistic regression analysis if p<0.1. A receiver operating curve were generated for relative QT dispersion reduction to detect non transmural infarcts. All tests were two-tailed and p-Values <0.05 were considered statistically significant. Statistical analysis was performed using SPSS 22 (SPSS, Chicago, USA).
Predictive value of clinical, angiographic and electrographic data on extensive myocardial infarction.
| Parameter | Univariate | Multivariate | ||
|---|---|---|---|---|
| OR (95% CI) | p-Value | OR (95% CI) | p-Value | |
| Age | 1.020 (0.980-1.063) | 0.332 | ||
| Male Gender | 0.705 (0.258-1.930) | 0.497 | ||
| BMI | 0.981 (0.884-1.089) | 0.722 | ||
| CKmax (U/l) | 1.001 (1.000-1.001) | 0.010 | ||
| Troponin T max (ng/ml) | 2.112 (1.359-3.283) | 0.001 | 2.343 (1.208-4.546) | 0.012 |
| CVRF | ||||
| Hypertension | 1.892 (0.474-7.548) | 0.366 | ||
| Hypercholesterolemia | 1.220 (0295-5.042) | 0.782 | ||
| Current Smoking | 3.226 (0.827-12.582) | 0.092 | 1.751 (0.542-5.657) | 0.349 |
| Diabetes | 0.651(0.170-2.495) | 0.531 | ||
| Angiographic data | ||||
| Pre-PCI TIMI flow | 0.581 (0.383-0.881) | 0.011 | 0.552 (0.314-0.971) | 0.039 |
| Post-PCI TIMI flow | 0.471 (0.041-5.445) | 0.546 | ||
| LAD culprit lesion | 1.053 (0.406-2.727) | 0.916 | ||
| Multivessel disease | 2.267 (0.841-6.111) | 0.106 | ||
| ECG | ||||
| QTd prior (ms) | 0.991 (0.975-1.007) | 0.268 | ||
| QTd post (ms) | 1.029 (1.000-1.058) | 0.048 | 1.016 (0.955-1.080) | 0.619 |
| QTd-Rabs (ms) | 0.966 (0.943-0.990) | 0.005 | 0.981 (0.931-1.033) | 0.458 |
| QTd-Rrel (%) | 0.958 (0.935-0.982 ) | 0.001 | 0.990 (0.915-1.072 | 0.810 |
Univariable and multivariable stepwise logistic regression analysis of age, male gender, BMI in kg/m2, hypertension, hypercholesterolemia, current smoking, diabetes, pre-PCI TMI flow and post-PCI TIMI flow, LAD culprit lesion, multivessel disease, as well as QT dispersion prior and post and absolute and relative QTd-R for the prediction of extensive myocardial infarction as defined by CMR. CVRF= cardiovascular risk factors; ECG= electrocardiogram, CI =confidence interval; OR=odds ratio.
Predictive value of clinical and electrographic data on non-transmural infarction.
| Parameter | Univariate | Multivariate | ||
|---|---|---|---|---|
| OR (95% CI) | p-Value | OR (95% CI) | p-Value | |
| Age | 1.024 (0.978-1.072) | 0.311 | ||
| Male Gender | 1.575 (0.487-5.090) | 0.448 | ||
| BMI | 1.023 (0.923-1.135) | 0.661 | ||
| CKmax (U/l) | 0.999 (0.999-1.000) | 0.001 | 0.278 (0.067-1.162) | 0.079 |
| Troponin T max (ng/ml) | 0.438 (0.293-0.654) | 0.001 | 1.001 (0.998-1.003) | 0.592 |
| CVRF | ||||
| Hypertension | 0.759 (0.213-2.706) | 0.671 | ||
| Hypercholesterolemia | 1.215 (0.325-4.538) | 0.772 | ||
| Current Smoking | 1.575 (0.487-5.090) | 0.448 | ||
| Diabetes | 1.171(0.281-4.886) | 0.829 | ||
| Angiographic data | ||||
| Pre-PCI TIMI flow | 0.999 (0.648-1.540) | 0.997 | ||
| Post-PCI TIMI flow | 1.333 (0.114-15.619) | 0.819 | ||
| LAD culprit lesion | 2.000 (0.656-6.100) | 0.223 | ||
| Multivessel disease | 0.455 (0.142-1.456) | 0.184 | ||
| ECG | ||||
| QTd prior (ms) | 1.017 (0.995-1.040) | 0.122 | ||
| QTd post (ms) | 0.950 (0.918-0.984) | 0.004 | 1.002 (0.927-1.083) | 0.955 |
| QTd-Rabs (ms) | 1.098 (1.051-1.148) | 0.001 | 0.960 (0.886-1.041) | 0.328 |
| QTd-Rrel (%) | 1.110 (1.055-1.167 ) | 0.001 | 1.150 (1.000-1.328) | 0.049 |
Univariable and multivariable stepwise logistic regression analysis of age, male gender, BMI in kg/m2, hypertension, hypercholesterolemia, current smoking, diabetes, pre-PCI TMI flow and post-PCI TIMI flow, LAD culprit lesion, multivessel disease, as well as QT dispersion prior and post, absolute and relative QTd-R for the prediction of non-transmural myocardial infarction as defined by CMR. CVRF= cardiovascular risk factors; ECG= electrocardiogram, CI =confidence interval; OR=odds ratio.
Results
69 patients with first documented acute Non-ST segment- Elevation Myocardial infarction met criteria and were included in this study. The baseline characteristics are given in table 1. Patients were predominantly men, of older age and overweight. The most common cardiovascular risk factors were hypertension and hypercholesterolemia. All patients were treated by primary PCI. Most patients had multivessel disease and 48% of the study population presented in cath lab with a TIMI grade 0 or 1 flow in the infarct related artery. Post PCI almost every patient had TIMI grade 3 flow in the infarct related artery, with only 3 patients exhibiting TIMI grade 2 flow.
Patient Characteristics, QT dispersion, Angiographic and CMR Data according to infarct size.
| Parameter | All Patients | Extensive Infarcts | Limited Infarcts | P Value |
|---|---|---|---|---|
| N | 69 | 34 | 35 | |
| Male Gender | 46 (67%) | 24 (71%) | 22 (63%) | 0.611 |
| Age (years) | 61.5 ±11.9 | 62.9±12.7 | 60.1±11.1 | 0.337 |
| BMI (kg/m2) | 27.7±5.3 | 27.8±4.7 | 27.7±5.8 | 0.933 |
| CK max (U/L) | 1178.7±1545.4 | 1722.1±1492.7 | 650.9±1425.4 | 0.003 |
| Troponin T max (ng/ml) | 2.2±2.8 | 3.6±3.3 | 0.9±1.1 | 0.001 |
| Risk factors | ||||
| Hypertension | 52 (75%) | 28 (82%) | 24 (69%) | 0.265 |
| Hypercholesterolemia | 56 (81%) | 29 (85%) | 27 (77%) | 0.540 |
| Current smoking | 23 (33%) | 11 (32%) | 12 (34%) | 1.0 |
| Diabetes mellitus | 12 (17%) | 8 (24%) | 4 (11%) | 0.218 |
| ECG | ||||
| Sinusrhythm | 69 (100%) | 34 (100%) | 35 (100%) | 1.0 |
| QTd | ||||
| Prior PCI | 74±31 | 70.0±33.9 | 78±27 | 0.267 |
| Post PCI | 32±22* | 38±27 | 27±16 | 0.036 |
| QTd-Rabs (ms) | 42±23 | 32±28 | 51±21 | 0.002 |
| QTd-Rrel (%) | 54±26 | 42±29 | 66±17 | 0.001 |
| Angiographic data | ||||
| Pre-PCI TIMI flow 0 or 1 | 33 (48%) | 21 (62%) | 12 (34%) | 0.031 |
| Post-PCI TIMI flow 0 or 1 | 0 (0%) | 0 (0%) | 0 (0%) | 1.0 |
| LAD culprit lesion | 33 (47%) | 16 (47%) | 18 (51%) | 0.279 |
| Multivessel disease | 40 (58%) | 24 (71%) | 18 (51%) | 0.140 |
| CMR | ||||
| Time to CMR (d) | 3.8±2.7 | 4.5±3.3 | 3.1±1.8 | 0.028 |
| EF (%) | 55.3±11.0 | 51.7±10.9 | 58.7±10.2 | 0.008 |
| EDV (ml) | 139.8±42.2 | 143.4±45.9 | 136.3±38.7 | 0.488 |
| ESV (ml) | 64.9±31.9 | 71.2±33.4 | 58.7±29.6 | 0.106 |
| LVM (g) | 145.8±39.2 | 153.6±42.5 | 138.2±34.6 | 0.104 |
| DE (% of LVM) | 10.0±8.5 | 16.8±7.2 | 3.4±1.9 | 0.001 |
| Segments infarcted (N) | 4.0±2.4 | 5.7±2.1 | 2.3±1.2 | 0.001 |
| Mean Transmurality (%) | 40.5±19.1 | 53.4±18.1 | 28.0±9.2 | 0.001 |
| MVO present | 18 (26%) | 17 (50%) | 1 (3%) | 0.001 |
| MVO (% of LVM) | 1.4±3.3 | 2.9±4.3 | 0.0±0.1 | 0.001 |
p<0.001* for reduction of QTdispersion prior PCI to post PCI.
Data are presented as mean values ± SD or percentage (number) of patients. BMI body mass index, CK max maximum levels of creatinin kinase, QTd QT dispersion, PCI percutaneous coronary intervention, LAD left anterior descending artery, EF ejection fraction, EDV end-diastolic volume, ESV end-systolic volume, LVM left ventricular mass, DE delayed enhancement indexed to LVM, MVO microvascular obstruction.
ECG
The QRS/QT interval was measurable in 10 ± 2 leads (range 9-12). Mean time interval between both ECGs was 105 ± 27 minutes. The maximum QT interval significantly increased after primary PCI (QTmax 392±43ms vs. 405±47ms, p=0.005), whereas the minimum QT interval increase post PCI missed significance (QTmin 337±40 vs. 350±37ms, p=0.299) . Consecutively absolute QT dispersion usually decreased pre to post reperfusion (74ms ± 31ms vs. 32 ± 22ms). Mean relative reduction of QT dispersion overall was 54± 26%; 1st tertile ΔQtd 23±16%, 2nd tertile ΔQtd 59±7%, 3rd tertile ΔQtd 81±8%.
QTd reduction and myocardial infarction
Mean Infarct size was 10.0±8.5% of LV mass (median 7.7%, range 0.7-36.8%). Patients with extensive infarcts (above median infarct size, table 1) showed more depressed LV function, higher enzyme levels, bigger spatial extension of infarcts (number of infarcted segments), higher transmurality of infarcts and greater prevalence of microvascular obstruction. These patients exhibited a lower QTd-R (QTd-Rabs and QTd-Rrel), due to persistent QT heterogeneity post reperfusion (extensive vs. limited infarcts, QTd 38±27ms vs. 27±16ms, p=0.036). Infarct size was inversely correlated to the extent of QTd-Rrel (-0.506, p=0.001).
When we stratified patients according to tertiles of QTd-Rrel, no statistically significant difference was found within groups between baseline characteristics (age, gender, BMI, cardiovascular risk factors and medication) and angiographic data (pre-PCI TIMI flow, post PCI TIMI flow multivessel disease as well as the presence of LAD culprit lesion, table 2. However, there was an inverse correlation between cardiac enzyme levels (CK max and troponin T) and QTd-Rrel (CKmax and QTd-Rrel -0.329, p=0.007, troponin T and QTd-Rrel -0.442, p=0.001).
Clinical, ECG and angiographic data according to QTd-Rrel tertiles.
| Parameter | QTd-Rrel 1st tertile | QTd-Rrel 2nd tertile | QTd-Rrel 3rd tertile | P Value* |
|---|---|---|---|---|
| N | 23 | 23 | 23 | |
| Male Gender | 19 (83%) | 13 (57%) | 14 (61%) | 0.132 |
| Age (years) | 62.3±13.1 | 63.0±12.5 | 59.2±10.0 | 0.533 |
| BMI (kg/m2) | 27.9±4.3 | 27.6±5.2 | 27.6±6.3 | 0.666 |
| CK max (U/L) | 1957.7±1697.8 | 887.8±1743.2 | 690.6±698.9 | 0.013 |
| Troponin T max (ng/ml) | 4.2±3.7 | 1.1±1.2 | 1.4±1.6 | 0.001 |
| Risk factors | ||||
| Hypertension | 19 (83%) | 17 (74%) | 16 (69%) | 0.579 |
| Hypercholesterolemia | 19 (83% | 21 (91%) | 16 (69%) | 0.165 |
| Current smoking | 4 (17%) | 8 (35%) | 11 (48%) | 0.090 |
| Diabetes mellitus | 4 (17%) | 5 (22%) | 3 (13%) | 0.739 |
| Medications | ||||
| ASA | 23 (100%) | 23 (100%) | 23 (100%) | 1.0 |
| clopidogrel | 23 (100%) | 23 (100%) | 23 (100%) | 1.0 |
| Betablocker | 23 (100%) | 23 (100%) | 21 (91%) | 0.127 |
| ACE-I/ARB | 23 (100%) | 23 (100%) | 21 (91%) | 0.127 |
| CA-Antagonist | 1 (4%) | 2 (9%) | 1 (4%) | 0.767 |
| Statine | 23 (100%) | 23 (100%) | 22 (96%) | 0.363 |
| Diuretics | 11 (48%) | 10 (44%) | 4 (17%) | 0.067 |
| ECG | ||||
| QTd | ||||
| Prior PCI | 67±34 | 79±27 | 76±31 | 0.225 |
| Post PCI | 50±27 | 32±9 | 15±11 | 0.001 |
| QTd-Rabs (ms) | 17±16 | 47±19 | 61±22 | 0.001 |
| QTd-Rrel (%) | 23±16 | 59±7 | 81±8 | 0.001 |
| Angiographic data | ||||
| Pre-PCI TIMI flow 0 or 1 | 11 (48%) | 14 (61%) | 8 (35%) | 0.208 |
| Post-PCI TIMI flow 0 or 1 | 0 (0%) | 0 (0%) | 0 (0%) | 1.0 |
| LAD culprit lesion | 10 (44%) | 13 (57%) | 10 (44%) | 0.413 |
| Multivessel disease | 15 (65%) | 14 (61%) | 14 (61%) | 0.833 |
Data are presented as mean values ± SD or percentage (number) of patients. BMI body mass index, CK max maximum levels of creatinin kinase, QTd QT dispersion, PCI percutaneous coronary intervention, LAD left anterior descending artery.
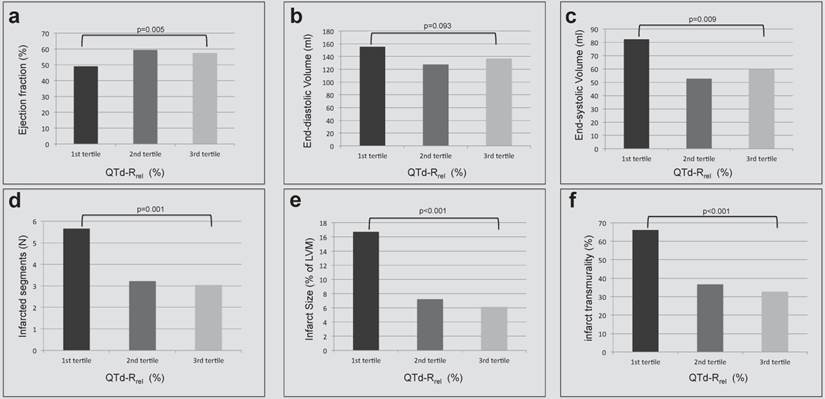
LV ventricular function overall was usually preserved (EF 55.3 ± 11.0%). Mean EF was lowest in the lowest tertile of QTd-Rrel and higher in the highest tertile of QTd-Rrel (49.0 ± 12.6% vs. 57.4 ± 9.1%, p=0.005). A mild correlation was found between QTd-Rrel and ejection fraction (r=0.249, p=0.039, figure 2a). An inversive relationship was found for end-systolic volumes and QTd-Rrel (r=-0.266, p=0.26; figure 2c), whereas correlation between QTd-Rrel and end-diastolic volumes missed significance (p>0.05, figure 2b). QTd-Rrel was significantly lower in patients with greater number of infarcted segments, figure 2d, and more extensive myocardial infarction, figure 2e. With increasing QTd-R rel smaller infarcts (r=-0.506, p<0.001) occurred with lower transmurality (figure 2f; r=-0,415, p<0.001), which covered fewer segments (r=-0.435, p<0.001).
Left ventricular volumes and function (a-c) and delayed enhancement findings (d-f) are stratified according to tertiles of QTd-Rrel from prior to post revascularization in patients with acute NSTEMI. A) Left ventricular ejection fraction (%) increased, b) end-systolic volume (ml) decreased significantly between first and third QTd-Rrel tertile. The number of infarcted segments (d), as well as the transmurality (f) and the size of infarcts (e) decreased from first to third QTd-Rrel tertile (p=0.001).
QT dispersion and microvascular obstruction
Two observers independently assessed microvascular obstruction. Their analysis showed excellent agreement on the presence of microvascular obstruction (κ=0.98) and extent of MVO (ICC=0.92). 18 patients (26%) showed microvascular obstruction on CE-CMR. These patients had more often single vessel disease (p=0.023), greater cardiac enzyme level (CKmax: 2472.2 ± 1589.4 U/l vs. 722.2 ± 1254.7 U/l, p<0.001; and troponin T max: 5.3 ±3.6 vs. 1.2 ±1.3 ng/ml, p<0.001). Concurrently, patients with microvascular obstruction demonstrated bigger infarcts (infarct size in % of LVM: 20.3 ± 8.2% vs. 6.4 ± 4.9, p<0.001; number of segments infarcted: 6.4 ± 2.5 vs. 3.1 ± 1.7, p<0.001; and greater depressed LV dysfunction (EF 50.6 ± 11.9% vs. 56.9 ± 10.3%, p=0.034).
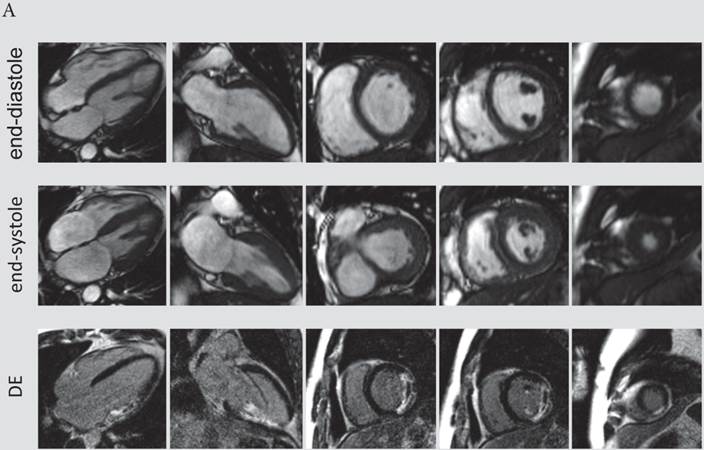
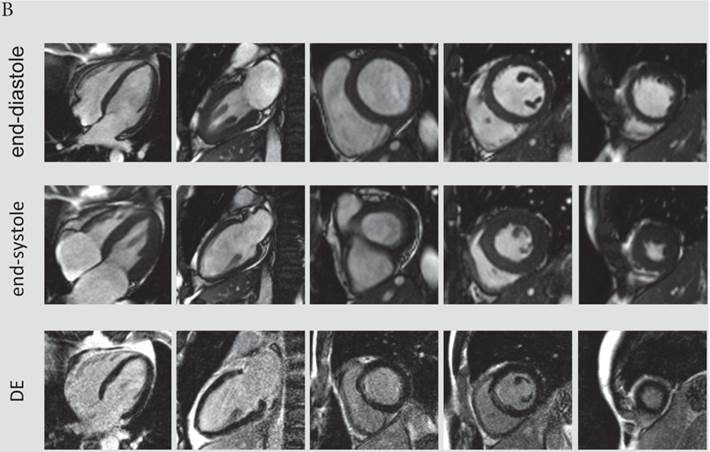
The presence and extent of microvascular obstruction on DE-CMR was significantly correlated to QTd-Rrel (r=-0.725, p<0.001 and r=-0.719, p<0.001), respectively. Patients in the 1st tertile of QTd-Rrel had the highest prevalence (69%) and extent of microvascular obstruction (4.1% of LV mass), and patients in the third tertile of QTd-Rrel showed the lowest (0%). A typical CMR scan of patients with low and high QTd-Rrel post revascularization is shown in figure 3a and 3b.
A) CMR scan of an 63-year-old male exhibiting only a minor reduction of QTd-Rrel post revascularization (QTd-Rrel 1st tertile). This patient had extensive, predominantly transmural myocardial infarction (average infarct transmurality: 95%, QTd-Rrel :0%) with presence of microvascular obstruction. B) A typical CMR scan of a patient with high reduction QTd-Rrel . This 60-year-old male was categorized to the 3rd tertile of QTd-Rrel . CMR images showed limited, non-transmural infarction (average infarct transmurality: 22%, QTd-Rrel: 80%).
Predictors of extensive myocardial infarction and non-transmural infarction
In univariate analysis cardiac enzyme levels, pre-PCI TIMI flow and QTd post reperfusion, as well as the peri-procedural reduction of QT dispersion were associated with extensive myocardial infarction. However, a multivariable analysis demonstrated that only troponin t levels and initial TIMI flow grades in the infarct related artery were independent predictors of extensive myocardial infarction, table 3.
When we looked at the predictors of non-transmural infarctions univariate analysis showed that CK max, troponin T levels and QT dispersion post reperfusion as well as the peri-procedural reduction of QT dispersion were related to non-transmural infarcts. However, the reduction of QT dispersion remained the single independent predictor of non-transmural infarctions in multivariate analysis, table 4. ROC analysis revealed that the best cut-off of QTd-Rrel to detect non-transmural infarcts was 50%, sensitivity of 74% and a specificity of 79% [AUC 0.810 (0.658-0.963,p<0.001)]. Using this cut-off 42 out of 46 patients in this study population were correctly identified as having non-transmural infarction (PPV 91%), whereas only 11 out of 23 patients were correct classified as having transmural infarctions (NPV 47%). 12 patients with non transmural infarctions that were missed using the QTd-Rrel cut-off had significantly larger infarcts by size and circumferential extent with more transmural infarcted segments (infarct size 12.3±10.2% vs. 5.8±4.6, p=0.002, DE segments involved 5.8±2.9±1.7, p=0.004, transmural infarcted segments 3±2.8 vs. 0.21±0.5, p=0.001, respectively) compared to the correctly identified.
Discussion
The main finding of this study in patients with acute Non-ST-Segment Myocardial infarction was that the reduction of QT dispersion calculated from surface ECG prior and post revascularization was linked to low infarct size and infarct transmurality as assessed by contrast enhanced CMR. QTd-Rrel was inversely correlated to infarct size, and high QTd-Rrel predicted limited myocardial infarction. Additionally, there was an inverse relationship between QTd-Rrel and infarct transmurality. QTd-Rrel remained the only independent predictor of non-transmural infarction compared to clinical and angiographic data.
In current clinical practice the surface ECG is routinely obtained in acute myocardial infarction. Patients with acute MI are classified according to the presence or absence of ST-segment elevation [3]. In ST-segment elevation myocardial infarction the lack of ST-segment elevation reduction is accompanied with more extensive and profound myocardial injury (bigger infarcts and more transmural infarction) [4], which results in worse prognosis. Unfortunately, in Non-ST segment myocardial infarction no such marker is known. This is worrisome, because despite angiographic restoration of epicardial blood flow in acute MI, extensive myocardial infarction can occur. Contrary to common conception, non-ST-segment myocardial infarction per se does not translate to smaller myocardial damage and better outcome compared to STEMI. In fact, recent studies provide evidence for a similar long term prognosis in patients with STEMI and NSTEMI [23]. It is conceivable, that prognosis in NSTEMI is heterogeneous and relates to the extent of irreversible injured myocardium. In this study patients with extensive myocardial infarction had higher cardiac enzyme levels, more impaired LV function and greater infarct transmurality by MRI. Additionally, the occurrence of microvascular obstruction was more frequent in extensive infarction. All of these patients had myocardial infarcts, which were transmural in at least one segment. On first glance the prevalence of MVO in this study is surprisingly high (26%). Though recently, an international two center study described a prevalence of over 30% of MVO in NSTEMI with large infarct size, greater transmurality and infarct age as predictors of MVO. More striking, the prevalence of MVO was similar in NSTEMI as in STEMI when adjusted for infarct size and infarct transmurality [24]. Microvascular obstruction in itself seems to be important, because it appears to be related to adverse LV remodeling post infarction and poor outcome [25] [26].
Increased QT dispersion on surface ECG has been associated with fatal arrhythmia and sudden cardiac death in acute myocardial infarction [27] [28] [29]. Though, a major criticism of the QT dispersion is the wide range of values and the complete absence of established reference values. To be precise a substantial overlap was found between disease and normal volunteers. Additionally, the variable T wave morphology contributes to impaired reproducibility with both manual and automatic measurements. Therefore, a single measurement of QT dispersion did not provide clinically useful. Recently, a study including patients undergoing elective PCI evaluated peri-PCI changes in QT dispersion and provided an association between lack of relative QT dispersion reduction and cardiac death [18]. Following the same line of thought, we implemented this approach to assess individually QT dispersion by serial testing. This also circumvents the absence of reference values. Mirroring previous studies, patients with smaller infarct size had lower QT dispersion post revascularization [30]. Fitting perfectly with previous published data [31] [32] QT dispersion post revascularization was found to be a associated to non-transmural infarction in this study. Yet, in multivariate analysis relative reduction of QT dispersion remained the only independent predictor of non-transmural infarctions. Moreover, in post-hoc analysis a cut-off greater than 50% reduction of QT dispersion predicted non-transmural infarction with good sensitivity and specificity.
In acute myocardial infarction necrosis progresses as a wavefront beginning at the subendocardium to more transmural extent with increasing time of ischemia, the so called wavefront phenomenon [33 34]. The proportion of myocardium that is ischemic but not infarcted is therefore salvaged. The extent of salvaged myocardium in non-transmural infarctions reflects the success of reperfusion therapy in the individual patient and is the fundamental concept of infarct management. QTd-Rrel on a standard surface ECG detects limited infarct size and non-transmural infarction. Thus QTd-Rrel can be used as a readily available marker of successful reperfusion in NSTEMI.
Limitations
In general, this study was performed in patients with acute NSTEMI undergoing successful primary PCI; it is unclear if results can be extrapolated to patients undergoing thrombolysis or with ST elevation myocardial infarction. In addition, patients with NSTEMI who underwent CABG or who were treated conservatively were excluded from this study. In this study QT dispersion was calculated manually. Continuous QT interval monitoring using dedicated automated analysis systems might have improved calculations. Additionally, the assessment of ST segment depression may have provided an additional ECG marker of extensive myocardial infarction and may have complimentary value to QT dispersion. This study does not provide follow up data of patients to examine the prognostic value of the relative reduction of QT dispersion prior to post revascularization. However, this study provides evidence for the link between QT dispersion reduction and infarct size as well as infarct transmurality assessed by CE-CMR, whereas infarct size is an established predictor of worse outcome and serves as a surrogate endpoint on clinical trials. Last, there is medication that influences QT dispersion on surface ECG, such as Beta-blocker, which could alter findings of this study. Given the fact that patients with acute myocardial infarction were included in this study the overall prevalence of beta-blocker medication was high (97%). Additionally, there was no difference between the prevalence of Beta-blocker administration and the timing of administration between patients with low and high reduction of QT dispersion.
Clinical implication
Because QTd-Rrel reflects limited myocardial infarction and low transmurality of infarcts, this parameter offers information for patients after complete restoration of epicardial blood flow by primary PCI beyond angiography. Measuring QTd-Rrel in acute NSTEMI may assist the clinical decision pathway and risk stratification of the patient beyond current knowledge. The findings of this study may be relevant for choosing high-risk patients for more aggressive medical therapy or additive therapeutic strategies to promote infarct repair. On the other hand, patients with great QTd-Rrel on surface ECG exhibited non-transmural infarcts. In the future, QTd-Rrel in patients with NSTEMI might serve as a marker of salvaged myocardium and therefore the effectiveness of reperfusion therapy in clinical routine and trials.
Conclusion
In patients with acute Non-ST-Segment Myocardial infarction QTd-Rrel calculated on a surface ECG ECG prior and post PCI for restoration of epicardial blood flow can serve as a marker of successful reperfusion therapy.
Whether the proposed cut-off of 50% QTd-Rrel best detects non-transmural infarction in clinical routine and translates to better outcome, has to be determined by further prospective studies.
Competing Interests
The authors have declared that no competing interest exists.
References
1. Risk stratification and survival after myocardial infarction. N Engl J Med 1983;309(6):331-6.
2. Choi KM, Kim RJ, Gubernikoff G, Vargas JD, Parker M, Judd RM. Transmural extent of acute myocardial infarction predicts long-term improvement in contractile function. Circulation. 2001;104(10):1101-7
3. Thygesen K, Alpert JS, White HD. Universal definition of myocardial infarction. J Am Coll Cardiol. 2007;50(22):2173-95
4. Nijveldt R, van der Vleuten PA, Hirsch A. et al. Early electrocardiographic findings and MR imaging-verified microvascular injury and myocardial infarct size. JACC Cardiovasc Imaging. 2009;2(10):1187-94
5. Day CP, McComb JM, Campbell RW. QT dispersion: an indication of arrhythmia risk in patients with long QT intervals. Br Heart J. 1990;63(6):342-4
6. Ulrich Stierle MD EGM, Abdolhamid Sheikhzadeh MD, Dietmar Krüger MD, Georg Schmücker MD, Rolf Mitusch MD, Jürgen Potratz MD. Relation Between QT Dispersion and the Extent of Myocardial Ischemia in Patients With Three-Vessel Coronary Artery Disease. Amercian Journal of Cardiology. 1998;81(5):564-68
7. Sporton SC, Taggart P, Sutton PM, Walker JM, Hardman SM. Acute ischaemia: a dynamic influence on QT dispersion. Lancet. 1997;349(9048):306-9
8. Tomassoni G, Pisano E, Gardner L, Krucoff MW, Natale A. QT prolongation and dispersion in myocardial ischemia and infarction. J Electrocardiol. 1998;30(Suppl):187-90
9. Chiang CE. QT dispersions: fact or fiction? J Chin Med Assoc. 2006;69(7):295-6
10. Bruder O, Wagner A, Mahrholdt H. Lessons Learned from the European Cardiovascular Magnetic Resonance (EuroCMR) Registry Pilot Phase. Curr Cardiovasc Imaging Rep. 2010;3(3):171-74
11. Kim RJ, Manning WJ. Viability assessment by delayed enhancement cardiovascular magnetic resonance: will low-dose dobutamine dull the shine? Circulation. 2004;109(21):2476-9
12. Kim RJ, Fieno DS, Parrish TB. et al. Relationship of MRI delayed contrast enhancement to irreversible injury, infarct age, and contractile function. Circulation. 1999;100(19):1992-2002
13. Patel MR, Worthley SG, Stebbins A. et al. Pexelizumab and infarct size in patients with acute myocardial infarction undergoing primary percutaneous coronary Intervention: a delayed enhancement cardiac magnetic resonance substudy from the APEX-AMI trial. JACC Cardiovasc Imaging. 2010;3(1):52-60
14. Wagner A, Mahrholdt H, Holly TA. et al. Contrast-enhanced MRI and routine single photon emission computed tomography (SPECT) perfusion imaging for detection of subendocardial myocardial infarcts: an imaging study. Lancet. 2003;361(9355):374-9
15. Bruder O, Schneider S, Nothnagel D. et al. EuroCMR (European Cardiovascular Magnetic Resonance) registry: results of the German pilot phase. J Am Coll Cardiol. 2009;54(15):1457-66
16. Bruder O, Wagner A, Lombardi M. et al. European Cardiovascular Magnetic Resonance (EuroCMR) registry--multi national results from 57 centers in 15 countries. J Cardiovasc Magn Reson. 2013;15:9
17. Bassand JP, Hamm CW, Ardissino D. et al. Guidelines for the diagnosis and treatment of non-ST-segment elevation acute coronary syndromes. Eur Heart J. 2007;28(13):1598-660
18. Zimarino M, Corazzini A, Tatasciore A. et al. Defective recovery of QT dispersion predicts late cardiac mortality after percutaneous coronary intervention. Heart. 2011;97(6):466-72
19. Jensen CJ, Eberle HC, Nassenstein K. et al. Impact of hyperglycemia at admission in patients with acute ST-segment elevation myocardial infarction as assessed by contrast-enhanced MRI. Clin Res Cardiol. 2011;100(8):649-59
20. Jensen CJ, Bleckmann D, Eberle HC. et al. A simple MR algorithm for estimation of myocardial salvage following acute ST segment elevation myocardial infarction. Clin Res Cardiol. 2009;98(10):651-6
21. Kim HW, Farzaneh-Far A, Kim RJ. Cardiovascular magnetic resonance in patients with myocardial infarction: current and emerging applications. J Am Coll Cardiol. 2009;55(1):1-16
22. Romero J, Xue X, Gonzalez W, Garcia MJ. CMR imaging assessing viability in patients with chronic ventricular dysfunction due to coronary artery disease: a meta-analysis of prospective trials. JACC Cardiovasc Imaging. 2012;5(5):494-508
23. Marceau A, Samson J-M, Laflamme N, Reinfret S. Short and Long-Term Mortality after STEMI versus Non-STEMI: A SYSTEMATIC REVIEW AND META-ANALYSIS. JACC Cardiovasc Imaging. 2013
24. Van Assche LMR, Bekkers S.C.A.M, Senthilkumar A, Parker M.A, Kim H.W, Kim R.J. The prevalence of microvascular obstruction in acute myocardial infarction: importance of ST elevation, infarct size, transmurality and infarct age. J Cardiovasc Magn Reson. 2012;13:Suppl 1
25. Bruder O, Breuckmann F, Jensen C. et al. Prognostic impact of contrast-enhanced CMR early after acute ST segment elevation myocardial infarction (STEMI) in a regional STEMI network: results of the "Herzinfarktverbund Essen". Herz. 2008;33(2):136-42
26. Wu KC. CMR of microvascular obstruction and hemorrhage in myocardial infarction. J Cardiovasc Magn Reson. 2012;14:68
27. Perkiomaki JS, Koistinen MJ, Yli-Mayry S, Huikuri HV. Dispersion of QT interval in patients with and without susceptibility to ventricular tachyarrhythmias after previous myocardial infarction. J Am Coll Cardiol. 1995;26(1):174-9
28. Barr CS, Naas A, Freeman M, Lang CC, Struthers AD. QT dispersion and sudden unexpected death in chronic heart failure. Lancet. 1994;343(8893):327-9
29. Aziz F, Doddi S, Alok A. et al. QT dispersion as a predictor for arrhythmias in patients with acute ST elevation myocardial infarction. Journal of thoracic disease. 2010;2(2):86-8
30. Higham PD, Furniss SS, Campbell RW. QT dispersion and components of the QT interval in ischaemia and infarction. Br Heart J. 1995;73(1):32-6
31. Schneider CA, Voth E, Baer FM, Horst M, Wagner R, Sechtem U. QT dispersion is determined by the extent of viable myocardium in patients with chronic Q-wave myocardial infarction. Circulation. 1997;96(11):3913-20
32. Arend F.L. Schinkel M, Manolis Bountioukos, MD, Don Poldermans, MDemail, Abdou Elhendy, MD, Roelf Valkema, MD, Eleni C. Vourvouri, MD, Elena Biagini, MD, Vittoria Rizzello, MD, Miklos D. Kertai, MD, Boudewijn Krenning, MD, Eric P. Krenning, MD, Jos R.T.C. Roelandt, MD, Jeroen J. Bax, MD. Relation between QT dispersion and myocardial viability in ischemic cardiomyopathy. American Journal of Cardiology. 2003;92(6):712-15
33. Reimer KA, Lowe JE, Rasmussen MM, Jennings RB. The wavefront phenomenon of ischemic cell death. 1. Myocardial infarct size vs duration of coronary occlusion in dogs. Circulation. 1977;56(5):786-94
34. Reimer KA, Jennings RB. The "wavefront phenomenon" of myocardial ischemic cell death. II. Transmural progression of necrosis within the framework of ischemic bed size (myocardium at risk) and collateral flow. Laboratory investigation; a journal of technical methods and pathology. 1979;40(6):633-44
Author contact
![]() Corresponding author: Christoph J. Jensen, MD. Elisabeth Hospital Essen, Klara-Kopp-Weg 1, 45138 Essen, Germany. Phone: +49-201-897-0 Fax: +49-201-288525 E-mail: c.jensende.
Corresponding author: Christoph J. Jensen, MD. Elisabeth Hospital Essen, Klara-Kopp-Weg 1, 45138 Essen, Germany. Phone: +49-201-897-0 Fax: +49-201-288525 E-mail: c.jensende.