Impact Factor ISSN: 1449-1907
- Issue 9; 2026
- Issue 8; 2026
- Issue 7; 2026
- Issue 6; 2026
- Issue 5; 2026
- Volume 23; 2026
- Past Issues
- Editorial Board
- Cover Images
- Index & Coverage
- Cover Suggestion
- Special Issues
Introduction
Materials and Methods
Results
Discussion
Supplementary Material
Acknowledgements
References

 Global reach, higher impact
Int J Med Sci 2014; 11(12):1208-1217. doi:10.7150/ijms.9866 This issue Cite
Research Paper
Intestinal and Hepatic Expression of Cytochrome P450s and mdr1a in Rats with Indomethacin-Induced Small Intestinal Ulcers
Shoji Kawauchi1,2, Tsutomu Nakamura3 ![]() , Hiroyuki Yasui4, Chikako Nishikawa4, Ikuya Miki1,5, Jun Inoue1,5, Sayo Horibe1, Tsuneo Hamaguchi2, Toshihito Tanahashi1,5
, Hiroyuki Yasui4, Chikako Nishikawa4, Ikuya Miki1,5, Jun Inoue1,5, Sayo Horibe1, Tsuneo Hamaguchi2, Toshihito Tanahashi1,5 ![]() , Shigeto Mizuno1
, Shigeto Mizuno1
1. Department of Medical Pharmaceutics, Kobe Pharmaceutical University, 4-19-1 Motoyamakita-machi, Higashinada-ku, Kobe, 658-8558, Japan;
2. Educational Center for Clinical Pharmacy, Kobe Pharmaceutical University, 4-19-1 Motoyamakita-machi, Higashinada-ku, Kobe, 658-8558, Japan;
3. Department of Pharmaceutical Health Care, Faculty of Pharmaceutical Sciences, Himeji Dokkyo University, 7-2-1 Kamiohno, Himeji, 670-8524, Japan;
4. Department of Analytical and Bioinorganic Chemistry, Division of Analytical and Physical Chemistry, Kyoto Pharmaceutical University, 5 Nakauchi-cho, Misasagi, Yamashina-ku, Kyoto, 607-8414, Japan;
5. Division of Gastroenterology, Department of Internal Medicine, Kobe University Graduate School of Medicine, 7-5-1 Kusunoki-cho, Chuo-ku, Kobe, 650-0017, Japan.
Received 2014-6-11; Accepted 2014-8-31; Published 2014-9-13
Abstract
Background: Non-steroidal anti-inflammatory drugs induce the serious side effect of small intestinal ulcerations (SIUs), but little information is available regarding the consequences to drug metabolism and absorption. Aim: We examined the existence of secondary hepatic inflammation in rats with indomethacin (INM)-induced SIUs and assessed its relationship to the cytochrome P450 (CYP) and P-glycoprotein (mdr1a), the major drug-metabolizing factors in the small intestine and the liver. Methods: Gene expression of the CYP family of enzymes and mdr1a was measured with quantitative real-time polymerase chain reaction (qPCR). Vancomycin (VCM), a poorly absorbed drug, was administered intraduodenally to rats with SIUs. Results: INM induced SIUs predominantly in the lower region of the small intestine with high expression of inflammatory markers. Liver dysfunction was also observed, which suggested a secondary inflammatory response in rats with SIUs. In the liver of rats with SIUs, the expression of CYP2C11, CYP2E1, and CYP3A1 was significantly decreased, and loss of CYP3A protein was observed. Although previous studies have shown a direct effect of INM on CYP3A activity, we could not confirm any change in hepatic CY3A4 expression (major isoform of human CYP3A) in vitro. The plasma VCM concentration was increased in rats with SIUs due to partial absorption from the mucosal injury, but not in normal mucosa. Conclusions: INM-induced SIUs had a subtle effect on intestinal CYP expression, but had an apparent action on hepatic CYP, which was influenced, at least in part, by the secondary inflammation. Furthermore, drug absorption was increased in rats with SIUs.
Keywords: indomethacin, cytochrome P450, P-glycoprotein, secondary inflammation, small intestine.
Introduction
Non-steroidal anti-inflammatory drugs (NSAIDs) are widely used for the treatment of pain, inflammation, and fever. However, chronic usage of NSAIDs often causes stomach ulcers and an increased risk of bleeding. Recent technological advances in the diagnosis of intestinal diseases, i.e. video capsule endoscopy and double-balloon enteroscopy, have provided adequate information about gastrointestinal mucosal lesions and assessment of the effect of medications on the small bowel [1, 2].Consequently, physicians can make a definitive diagnosis of NSAID-induced small intestinal ulcers (SIU), a condition that has attracted a great deal of attention in recent years [1-3].
The small intestine is the primary site of absorption for orally administered drugs, and intestinal metabolism and active extrusion of absorbed drug have been recognized as barriers to drug absorption for over a decade [4-6]. Among drug metabolizing enzymes and efflux transporters present in the small intestinal mucosa, cytochrome P450 (CYP) enzymes, in particular the CYP3A subfamily, and P-glycoprotein (P-gp), encoded by the multidrug resistance (mdr1a) gene, are of particular interest as they accommodate a very wide spectrum of substrates and they exhibit a high degree of substrate overlap [7, 8]. Regional differences in the expression levels of CYPs and P-gp have been reported in the small intestine of humans [9-12] and animals such as rats [12-14]. NSAID-induced SIUs are produced predominantly in the distal jejunum and ileum of healthy subjects receiving short-term NSAID medication [15] and patients receiving NSAID therapy for rheumatoid arthritis [16]. Similar regional differences have also been reported in an experimental rat model of SIUs induced by indomethacin (INM) [17] and diclofenac [18]. Several studies have reported that increased levels of some mediators of inflammation, such as tumor necrosis factor (TNF)-α, interleukin (IL)-1β, and IL-6, lead to decreased expression of transcription factors resulting in the down-regulation of CYPs and P-gp [19, 20]. In the SIUs, the inflammatory response could be associated with the regulation of CYP and P-gp expression. In addition, drug absorption may be further affected by the mucosal injury. However, little information is available concerning the associations among NSAID-induced SIUs, the expression of CYPs and P-gp, and drug absorption in the small intestine.
The small intestinal tract and hepatobiliary system form an enterohepatic circulation through the portal vein and the bile duct. In our previous study, the existence of a secondary inflammatory response was found in the liver of mice with dextran sodium sulfate (DSS)-induced experimental colitis, which resulted in the dysfunction of CYP3A and P-gp in the liver and small intestine and further impaired the oral bioavailability of cyclosporine A [21].
In this study, we examined the mRNA expression levels of inflammatory markers and assessed the presence of secondary inflammation in the liver in rats with INM-induced SIUs. Furthermore, we investigated the gene expression of CYP family members and mdr1a in the small intestine and the liver. To evaluate drug absorption after mucosal injury in animals with INM-induced SIUs, we assessed the plasma concentrations of vancomycin (VCM) as a model drug, which is not metabolized in the liver and is poorly absorbed in the gastrointestinal tract [22].
Materials and Methods
Reagents
Indomethacin (INM) was purchased from Sigma-Aldrich (St. Louis, MO, USA). Rifampicin was purchased from Nacalai Tesque, (Kyoto, Japan). Vancomycin (VCM) hydrochloride powder MEEK was purchased from Meiji Seika Pharma (Tokyo, Japan).
Animals
Male Sprague-Dawley rats (220-300 g) were purchased from CLEA Japan (Shizuoka, Japan) and maintained under an artificial 12 h dark-light cycle (lights on at 8:30 AM) at a constant temperature of 24 ± 1°C and 55% humidity under specific-pathogen-free conditions. They were provided with laboratory chow CE-2 (CLEA) and water ad libitum. All of the described experimental procedures were approved by the Animal Care Committee of Kobe Pharmaceutical University.
Indomethacin (INM)-induced small intestinal ulcers (SIUs)
Induction of small intestinal ulceration was performed according to the previously reported procedure [23]. Briefly, INM was suspended in saline with a drop of Tween 80 (Wako, Osaka, Japan). Animals were administered INM (10 mg/5 ml/ kg) by subcutaneous injection. Control animals received the vehicle alone. Animals were sacrificed 24 h after INM treatment under deep ether anesthesia. The small intestine was quickly excised and treated with 2% formalin for fixation of the tissues. To examine site-specific differences, the small intestine was divided equally into 3 sections: upper, middle, and lower. Each section was opened along the mesenteric attachment and was examined for lesions under a dissecting microscope with square grids (magnification, × 10). The area (mm2) of macroscopically visible lesions was measured, summed per each section of the small intestine, and this value was used as a lesion score. Real-time polymerase chain reaction (PCR) analysis was conducted with samples collected 24 h after INM administration.
Biochemical assays
Blood samples were collected from the inferior vena cava under deep ether anesthesia in control and INM-treated animals, and serum samples were isolated by centrifugation at 3,500 × g for 5 min at room temperature. The serum samples were analyzed for total protein, albumin, albumin/globulin (A/G), asparatate aminotransferase (AST), alanine aminotransferase (ALT), alkaline phosphatase (ALP), total bilirubin, serum creatinine, and blood urea nitrogen (BUN) according to standard biochemical methods at Mitsubishi Chemical Medience, Co. (Tokyo, Japan).
Cell line and culture
The HepG2 cell line, which was derived from a human hepatocellular carcinoma, was obtained from Summit Pharmaceuticals International (Tokyo, Japan). The cells were maintained in Dulbecco's modified Eagle's medium (DMEM) (Nacalai Tesque) with 10% fetal bovine serum (FBS) (Gibco, Carlsbad, CA, USA), 100 U/mL penicillin G, 100 μg/mL streptomycin (Nacalai Tesque) and 1% non-essential amino acids (Nacalai Tesque). Cells were seeded into culture flasks, grown in a humidified atmosphere of 5% CO2 and 95% air at 37°C, and subcultured with 0.05% trypsin and 0.02% EDTA (Nacalai Tesque).
To evaluate the effects of INM on CYP3A4 mRNA expression induced by rifampicin, HepG2 cells were seeded at 1×10⁵/well into 12-well multi-dishes (Becton Dickinson, Franklin Lakes, NJ, USA) and incubated for 4 days before treatment with each reagent. The final concentrations of the reagents during exposure were 250 μM for INM and 30 μM for rifampicin. To examine INM inhibitory effects on rifampicin-induced CYP3A4 mRNA expression, we added INM to the rifampicin-containing culture medium. Rifampicin was used as a positive control to confirm the ability to induce expression of the target genes [24, 25]. Control cells were incubated with the culture medium without reagents in each experiment. After incubation for 24 h to quantify the target mRNAs, the cells were washed twice with phosphate-buffered saline (PBS), and cell pellets were prepared.
Preparation of total RNA
Control and INM-treated animals were sacrificed under deep ether anesthesia. The small intestine and liver were quickly excised and washed with cold saline. The small intestine was divided into 3 equal sections as in the case of lesion score measurement. In rats treated with INM, intestinal tissue samples were obtained from microscopically inflamed and non-inflamed mucosa from each section of the small intestine.
Total RNA was extracted from tissues or cell pellets with the RNeasy Mini Kit (Qiagen, Valencia, CA, USA) or TRIzol reagent (Life Technologies, Carlsbad, CA, USA), according to the manufacturer's instructions. The quantity of RNA was determined using an ND-1000 spectrophotometer (NanoDrop Technologies, Wilmington, DE, USA). Two hundred nanograms of total RNA was subjected to reverse transcription (RT) as described below.
Quantitative real-time PCR
Purified total RNA was reverse transcribed with a ReverTra Ace qPCR RT Kit (Toyobo, Osaka, Japan) in a total volume of 20 μl. For real-time PCR amplification, 2 μl of cDNA was used as a template. PCR amplification was performed on a Thermal Cycler Dice Real Time System (TaKaRa Bio, Otsu, Japan) with Thunderbird SYBR qPCR Mix (Toyobo). The PCR conditions were as follows: 40 cycles of 15 s at 95 °C for annealing and 45 s at 60°C for extension. The primer sequences are shown in Supplementary Table 1. Relative expression levels of target genes were calculated by the delta-delta Ct method with β-actin used as a reference gene [26].
Preparation of proteins extracted from the rat liver microsomal fraction
The rat liver was excised at the same time points as for preparation of total RNA. Preparation of microsomes was performed as previously reported [21]. Briefly, the liver was homogenized using a glass Potter (30 strokes) in a buffer containing 10 mM potassium phosphate (pH 7.4), 0.15 M potassium chloride, and a protease inhibitor cocktail (Nacalai Tesque). The homogenate was centrifuged at 10,000 × g for 20 min at 4°C. The microsomal fraction was obtained by centrifuging the supernatant at 100,000 × g for 60 min at 4°C, and the pellet was suspended in potassium phosphate buffer (pH 7.4).
The protein concentration was measured using a bicinchoninic acid (BCA) assay kit (Thermo Fisher Scientific, Rockford, IL, USA), according to the manufacturer's protocol.
Western blot analysis
Proteins extracted from microsomes (15 μg) were boiled in a quarter-volume of sample buffer (1 M Tris-HCl [pH 7.4], 640 mM 2-mercaptoethanol, 0.2% bromophenol blue, 4% sodium dodecyl sulfate [SDS], and 20% glycerol) and separated on 10% SDS polyacrylamide gels. The proteins on the gels were transferred to polyvinylidene difluoride membranes. The membranes were then blocked with 1% ECL Prime Blocking Reagent (GE Healthcare, Buckinghamshire, England) in Tris-buffered saline (TBS) containing 0.5% Tween 20 for 1 h at room temperature. Anti-CYP3A goat polyclonal antibody L-14 (1:350; sc-30621, Santa Cruz Biotechnology, Santa Cruz, CA, USA) and anti-β-actin rabbit monoclonal antibody 13E5 (1:2,000; #4970, Cell Signaling, Beverly, MA, USA) were used as primary antibodies. Membranes were incubated with horseradish peroxidase-conjugated secondary antibodies for 1 h at room temperature. The secondary anti-goat IgG antibody (Santa Cruz Biotechnology) and anti-rabbit IgG antibodies (GE Healthcare) were diluted to 1:10,000 Protein/antibody complexes were visualized with Chemi-Lumi One Super (Nacalai Tesque) and detected with an Image Quant LAS 4000 (GE Healthcare). The intensities of the bands were quantified with Image Quant TL software (GE Healthcare).
Determination of the plasma VCM concentration
Control and INM-treated rats were anesthetized with an intraperitoneal injection of 40 mg/kg pentobarbital. The abdomen was incised and the duodenum exposed. Using a 26-G needle, we injected VCM dissolved in normal saline (250 mg/ml) through the pyloric valve into the proximal duodenum at a volume of 2 ml/kg. Blood samples were collected from the jugular vein at 10, 20, 30, 45, 60, 90, and 120 min after the administration of VCM.
Plasma concentrations of VCM were determined by a high-performance liquid chromatography (HPLC) assay. The HPLC system contained a Shimadzu HPLC LC-10A (Shimadzu, Kyoto, Japan) equipped with a variable wavelength UV detector, SPD-10AV (Shimadzu), monitored at 220 nm and an analytical C18 reverse-phase column (Nucleosil 120 C18 5 μm, 150 × 4.6 mm i.d., Chemco Scientific, Osaka, Japan). The mobile phase consisted of 50 mM ammonium phosphate buffer (pH 4.0) : acetonitrile = 93 : 7. The flow rate was 1.0 ml/min, and the column temperature was maintained at 40 ºC. The plasma concentration of VCM was calculated from the chromatogram peak area using a calibration curve, which was constructed for each assay with standard samples in the concentration range from 0.1 to 10 μg/ml. The elution time for VCM was found to be 20.5 min with the above separation conditions.
Samples (120 μl) were deproteinized by adding 10 μl of 60% perchloric acid. The mixture was vortex mixed and centrifuged for 10 min at 6,000 × g at 4°C, and 50 μl of the supernatant was injected onto the HPLC system to determination the plasma concentration of VCM. The limit of quantification was 0.1 μg/ml.
Data analysis and statistics
Data for the mRNA expression of target genes after treatment with INM were expressed as the ratio of the mean value in the upper intestine of the control group. In the liver, the data were expressed as the ratio of the mean value of CYP1A2 or TNF-α expression. Because the mRNA expression data exhibited a lognormal distribution, statistical analysis was performed on logarithmically transformed data. For the in vitro study, the mRNA expression data were expressed as the ratio of the mean value for the control group. The area under the plasma concentration-time curve (AUC0-120) was calculated by the trapezoidal method from 0 to 120 min. The statistical significance of differences between the mean or median values was calculated with the unpaired student's t-test or Mann-Whitney U-test with SPSS version 21.0 (IBM). Multiple comparisons were performed with the Tukey-Kramer test. A probability level of 0.05 was used as the criterion for significance.
Results
Induction of INM-induced SIUs
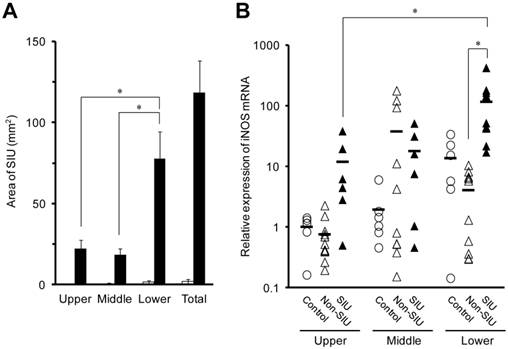
Animals treated with INM for 24 h exhibited ulcers throughout the small intestine, but animals not treated with INM (control group) had few ulcers (Fig. 1A). The average area of SIUs in the lower small intestine was 77.7 ± 16.6 mm2, which was significantly higher than those in the upper and middle sections of the small intestine (22.2 ± 5.1 and 18.5 ± 3.7 mm2, respectively) (P < 0.05). In rats with INM-induced SIUs, the level of expression of inducible nitric oxide synthase (iNOS) mRNA in the lower region of the small intestine was significantly higher than that in the upper region. In addition, there was a significant difference in iNOS mRNA expression levels between SIU and non-SIU tissue with INM treatment in the lower region of the small intestine (Fig. 1B).
Area of SIUs (A), and intestinal iNOS mRNA expression (B) in rats with INM-induced SIUs. Animals were sacrificed 24 h after INM or vehicle administration. (A) Areas of SIU were microscopically assessed in control (open columns) and INM-treated rats (closed columns). The data are presented as the mean ± standard error for 5 to 6 rats per group. (B) Total RNA was extracted from the small intestine. The expression level of iNOS mRNA was determined by real-time PCR, as described in the Materials and Methods. The data for mRNA expression are expressed as the ratio of the mean value for iNOS mRNA in the upper intestine of the control group. Points represent individual data for control (open circles), non-SIU (open triangles), and SIU (closed triangles) groups, and bars represent the mean value for 6 to 11 rats per group. *P < 0.05, statistically significant.
In the lower region of the small intestine, the expression of TNF-α, IL-1β, and IL-6 mRNA was significantly higher in SIU tissue than in non-SIU tissue (P < 0.05) (Fig. 2). In addition, the expression of IL-1β and IL-6 mRNAs was significantly higher in SIU tissue than in the control group (P < 0.05). Expression of IL-1β mRNA in SIU tissue in the lower region of the small intestine was significantly higher than in the upper and middle regions (P < 0.05). In the control group, there was a significant difference in the expression of IL-6 between the upper and the lower regions (P < 0.05). There was no significant difference in the mRNA expression of TNF-α and IL-1β among the upper, the middle, and the lower regions of the small intestine of control rats (Fig. 2).
Changes in TNF-α, IL-1β, and IL-6 mRNA expression in the rat small intestine with INM treatment. Animals were sacrificed 24 h after INM or vehicle administration. Total RNA was extracted from the upper, middle, and lower regions of the small intestine. The expression of TNF-α, IL-1β and IL-6 mRNA was determined by real-time PCR, as described in the Materials and Methods. The data for mRNA expression for non-SIU (open triangles) and SIU groups (closed triangles) are expressed as the ratio of the mean value for each target gene in the upper region of the control group (open circles). Points represent the individual data, and bars represent the mean value for 6 to 11 rats per group. *P < 0.05, statistically significant.
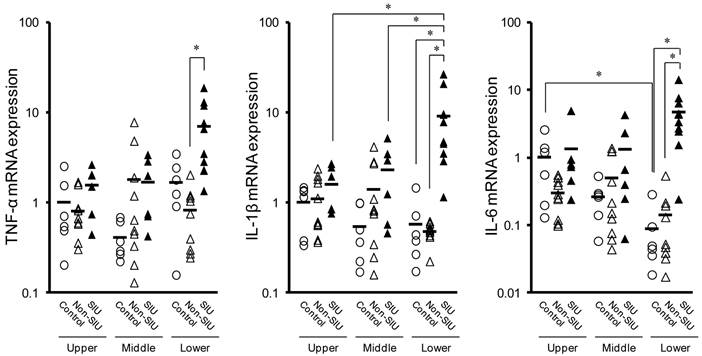
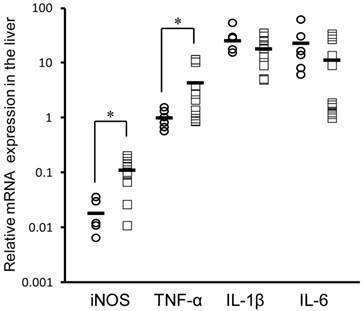
Figure 3 shows the mRNA expression of these inflammatory markers in the rat liver. After treatment with INM, the expression of iNOS and TNF-α mRNA was significantly higher (6.1- and 4.4-fold) in the rat liver of rats with SIUs than in control rats (P < 0.05). However, there were no significant changes in IL-1β and IL-6 mRNA expression in the rat liver between rats with SIUs and controls.
Changes in iNOS, TNF-α, IL-1β, and IL-6 mRNA expression in the rat liver with INM treatment. Animals were sacrificed 24 h after administration of INM or vehicle. Total RNA was extracted from the liver. The expression of iNOS, TNF-α, IL-1β, and IL-6 mRNA was determined by real-time PCR, as described in the Materials and Methods. The data for mRNA expression are expressed as the ratio of the mean value for TNF-α mRNA in the liver of the control group. Points represent the individual data for the control group (open circles; N = 6) and SIU group (open squares; N = 11), and bars represent the mean value for each group. *P < 0.05, statistically significant.
Biochemical data in rats with SIUs
Table 1 shows the biochemical data of experimental rats 24 h after INM injection. There was no significant difference in body weight between INM-treated and untreated rats (226.0 ± 2.5 g and 225.7 ± 2.0 g, respectively). Serum concentrations of total protein, albumin, A/G ratio, AST, ALT, and ALP were significantly decreased with INM treatment (P < 0.05). There was no significant difference in total bilirubin concentrations between the control and SIU groups. With regard to renal function indexes, there was no significant difference in the serum creatinine and BUN between the control and SIUs rats.
Biochemical data of control rats and rats with INM-induced SIUs.
| Control (N = 5) | INM-induced SIUs (N = 6) | |
|---|---|---|
| Total protein (g/dL) | 4.86 ± 0.09 | 3.65 ± 0.24* |
| Albumin (g/dL) | 3.40 ± 0.12 | 2.05 ± 0.14* |
| A/G ratio | 2.34 ± 0.17 | 1.30 ± 0.06* |
| AST (IU/L) | 74.2 ± 4.6 | 53.7 ± 7.4* |
| ALT (IU/L) | 35.2 ± 4.2 | 25.3 ± 4.2* |
| ALP (IU/L) | 1150 ± 154 | 418 ± 24* |
| Total bilirubin (mg/dL) | < 0.1 | < 0.1 |
| Serum creatinine (mg/dL) | 0.78 ± 0.08 | 0.72 ± 0.13 |
| BUN (mg/dL) | 14.8 ± 1.5 | 16.3 ± 4.8 |
Values represent mean ± standard deviation.
*P < 0.05, significant difference from control group.
A/G: albumin/globulin, ALP: alkaline phosphatase, ALT: alanine aminotransferase, AST: asparatate aminotransferase, BUN: blood urea nitrogen, INM: indomethacin, and SIU: small intestinal ulcer.
Changes in CYP and mdr1a mRNA expression in the rat small intestine with INM treatment
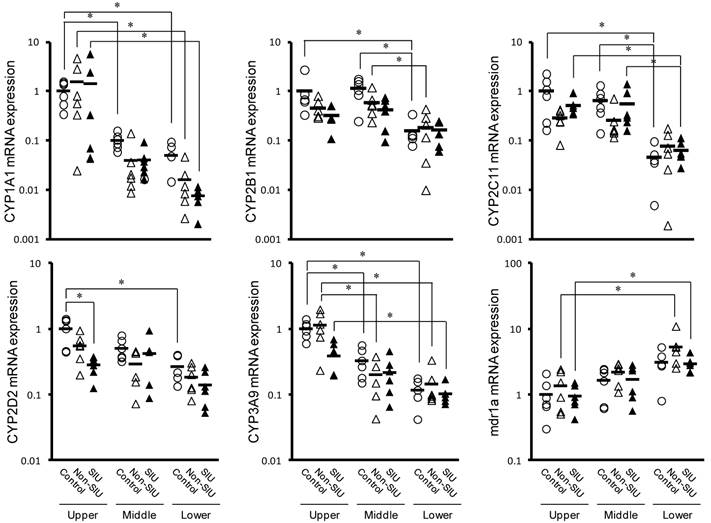
Figure 4 shows the effect of INM on the relative mRNA expression of CYPs and mdr1a in the upper, middle, and lower regions of the small intestine. In control rats, all CYP expression levels measured were significantly higher in the upper region than in the lower region (P < 0.05). An inverse trend was observed to expression of mdr1a, but it was not significant (P = 0.0503). In rats with non-SIU and SIU tissues, CYP and mdr1a expression were similar to those observed in control rats, with relatively high expression in the upper region. In particular, there was significantly higher expression of CYP1A1 and CYP3A9 in the upper region (P < 0.05). In contrast, mdr1a expression was significantly lower in the upper region (P < 0.05). In rats with normal and SIU tissues, a significant difference was observed only in CYP2D2 expression in the upper region of the small intestine (P < 0.05).
Changes in the mRNA expression of CYPs and mdr1a in the rat small intestine with INM treatment. Animals were sacrificed 24 h after INM or vehicle administration. Total RNA was extracted from the upper, middle and lower small intestine. Expression levels of CYP and mdr1a mRNA were determined by real-time PCR, as described in the Materials and Methods. The data for mRNA expression for the non-SIUs (open triangles) and SIU groups (closed triangles) are expressed as the ratio of the mean value for each target gene in the upper region of the small intestine of the control group (open circles). Points represent the individual data, and bars represent the mean value for 5 to 6 rats per group. *P < 0.05, statistically significant.
Changes in CYP and mdr1a mRNA expression in the rat liver with SIUs
Figure 5A shows the effect of INM on the relative expression of CYPs and mdr1a in the liver. The levels of CYP2C11, CYP2E1, and CYP3A1 mRNA expression were significantly decreased by more than 80% 24 h after the administration of INM (P < 0.05). The mRNA levels of CYP1A2, CYP2B1, CYP3A9, and mdr1a also decreased by 18.9%, 63.2%, 52.3%, and 34.4%, respectively, compared to control rats, but the differences were not significant.
Changes in mRNA expression of CYP and mdr1a and CYP3A protein in the rat liver with INM treatment. Animals were sacrificed 24 h after INM or vehicle administration. (A) Total RNA was extracted from the liver. Expression levels of CYP and mdr1a mRNA were determined by real-time PCR, as described in the Materials and Methods. The data for mRNA expression are expressed as the ratio of the mean value for CYP1A2 mRNA in the liver of the control group. Points represent individual data for the control group (open circles; N = 5) and SIU group (open squares; N = 6), and bars represent the mean value for each group. (B) The protein level of CYP3A was determined by western blot analysis, as described in the Materials and Methods. Densitometric quantification of CYP3A was performed and normalized to those of β-actin as a loading control. Data are presented as the mean values ± standard error for 4 rats per group. White columns represent those in the control group, and black columns represent those in the SIU group. *P < 0.05, statistically significant.
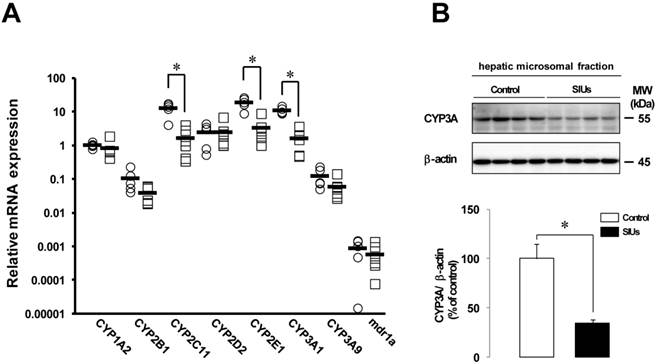
Changes in CYP3A protein levels in the rat liver with SIUs
Given the decreased expression of CYP2C11, CYP2E1, and CYP3A1 in the rat liver with INM treatment, we examined the protein production of CYP3A, which was the predominant hepatic CYP isoform. In the rat liver with SIUs, the level of CYP3A protein was significantly decreased by 65.8% from control (Fig. 5B), and down-regulation of CYP3A protein was detected, consistent with the results of decreased mRNA expression.
Effects of INM on human CYP3A4 mRNA expression in HepG2 cells
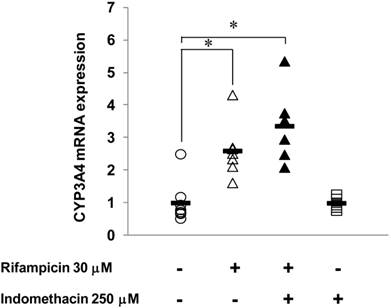
Figure 6 shows the effects of INM on the expression of human CYP3A4 (major isoform of human CYP3A) induced by rifampicin. In HepG2 cells treated with 30 μM rifampicin for 24 h, CYP3A4 mRNA expression was increased 2.6-fold compared to the control, which indicated that rifampicin could induce CYP3A4 expression under this experimental condition. With INM treatment alone, the CYP3A4 expression showed no significant change compared to that of the control. When the HepG2 cells were treated with both INM and rifampicin, CYP3A4 expression was not changed compared to that with rifampicin treatment alone.
Effects of INM on human CYP3A4 mRNA expression induced by rifampicin in HepG2 cells. HepG2 cells were incubated with medium containing INM and/or in combination with rifampicin for 24 h. The final concentrations of the reagents during exposure were 250 μM for INM and 30 μM for rifampicin. Control cells were incubated without the reagents in each experiment. Points represent the individual data, and bars represent the mean value for 6 to 8 separate experiments per group. *Statistically significant difference (P < 0.05) compared with controls.
Plasma concentration of VCM after intraduodenal administration in rats with SIUs
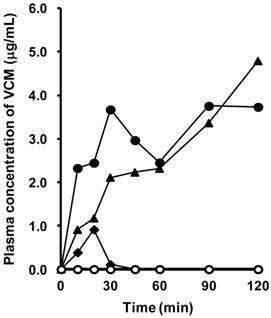
Figure 7 shows the concentration-time profiles of VCM after intraduodenal administration in rats with INM-induced SIU. VCM was detected in the plasma in three out of five rats with SIUs. Among the three rats in which plasma VCM could be detected, the concentration of VCM gradually increased up to 120 min in two rats, but only a transient increase was observed in the remaining one. The highest value of plasma VCM was 4.8 μg/ml at 120 min after administration, and the calculated AUC0-120 ranged from 14.7 to 362.0 μg∙min/ml. In the control, there was no detectable plasma concentration of VCM.
Plasma concentration of VCM in rats with INM-induced SIUs. VCM was administered intraduodenally at a dose of 500 mg/kg after treatment with INM or vehicle. Venous blood was collected at 10, 20, 30, 45, 60, 90, and 120 min after the administration of VCM. VCM plasma concentration-time profiles were constructed from concentrations measured by HPLC, as described in Materials and Methods. Data were obtained for each individual rat in the control (open symbols; N = 4) and SIU (closed symbols; N = 5) groups.
Discussion
NSAIDs can induce gastrointestinal ulceration as an adverse event, but it is difficult to detect SIUs by the classical diagnostic approach. In recent years, direct visualization throughout the small intestine with video capsule endoscopy and double-balloon enteroscopy has provided physicians with essential information for the definitive diagnosis of NSAID-induced SIUs [27, 28]. In an experimental rat model, a single subcutaneous administration of INM produced hemorrhagic damage leading to ulceration in the small intestinal mucosa within 24 h [23]. Such site-dependent phenomena seem to reflect the observations in human subjects receiving NSAIDs [15, 16]. Under our experimental conditions, SIUs were observed in the entire region of the small intestine, mainly in the lower region, 24 h after INM treatment. Additionally, in the lower region of the small intestine, the expression of iNOS mRNA was higher in the areas with SIUs. These findings are in agreement with the characteristic findings in SIUs induced by INM [29-32].
NSAIDs have been indicated to reduce mucus and bicarbonate secretion and increase intestinal motility, resulting in entero-bacterial invasion in the mucosa and increased intestinal permeability [1-3, 29]. Intestinal iNOS expression and NO production are involved in the mucosal defense system, which is up-regulated by endotoxin released from enterobacteria [32, 33]. In rats with SIUs, the expression of iNOS and inflammatory mediators was higher in the lower region of the small intestine than in the upper region. In parallel, higher levels of iNOS and TNF-α expression were observed in the rat liver with SIUs, which was consistent with the period of decreased CYP expression in the liver. Previously, these inflammatory mediators were shown to decrease hepatic CYP expression in other experimental colitis models and in in vitro studies [34, 35]. Furthermore, the concentrations of total protein, albumin, A/G ratio, AST, ALT, and ALP in rat serum were decreased with exposure to INM. These findings suggest possible hepatic dysfunction due to secondary inflammation from INM treatment, dependent on the enterohepatic circulation and its relationship with hepatic expression of CYPs.
INM was previously indicated to have direct and indirect effects on CYP enzyme activity in the rat liver [36]. However, we could not confirm a direct effect of INM, since INM had no significant inhibitory effect on human CYP3A4 expression in HepG2 cells. In the present condition, we only examined the gene expression of CYP3A and cannot exclude a direct action of INM on enzyme activity. Future studies are needed to determine the detailed regulation of the hepatic expression of CYPs dependent on the enterohepatic circulation with SIUs.
As mentioned above, SIUs were more common in the lower region than in the upper region of the small intestine. In contrast to CYP expression, mdr1a expression was significantly higher in the lower region than in the upper region of the small intestine. Thus, intestinal mdr1a expression is likely to be affected by the formation of SIUs. However, there was no significant difference in mdr1a expression between non-SIU and SIU tissues in the lower region of the small intestine, such as ulcer-predominantsites. These results indicated that the INM-induced SIUs did not have an effect on mdr1a expression in the small intestine.
Among the CYPs in the small intestine, significantly decreased expression of CYP2D2 was observed only between controls and SIU tissues in the upper region, but there was no significant difference in the expression of the other CYPs genes throughout the small intestine. In addition, CYP2D2 expression showed no change in the rat liver although, its expression was higher than in the small intestine [37]. CYP2D isoforms have an important action on the mono-oxygenation of various drugs, including anti-depressant agents and beta blockers [38], but we could not find any significant effect of the INM treatment on CYPs due to no drastic changes in gene expression in the small intestine.
In contrast, significantly decreased expression of CYP2C11, CYP2E1, and CYP3A1 were observed in the rat liver of animals with SIUs. Previously, decreased activity of CYP2C, CYP2E, and CYP3A was observed in rats with acute hepatic failure [39], which is consistent with our findings. Furthermore, we confirmed that INM treatment caused a loss of CYP3A protein. Among human CYPs, CYP3A4 is abundantly expressed in the liver, and is the major enzyme responsible for drug-metabolism [38]. Taken together, INM exposure could contribute to the decreased CYP expression in the liver and have a possible effect on hepatic drug metabolism.
Against our expectations, we could not find any intense role of the intestinal CYPs and mdr1a in the drug-metabolism of animals with SIUs. We also assessed drug absorption in rats with INM-induced SIUs by measuring rat plasma VCM concentrations after intraduodenal administration. VCM is recognized to be poorly absorbed in the gastrointestinal tract after oral administration [22]. In addition, this drug is not metabolized in the liver, and is excreted mainly in the kidneys [22, 40]. Thus, the evaluation of VCM absorption in the gastrointestinal tract is suitable for the existence of mucosal injury. In this study, 60% of the experimental rats exhibited a significant elevation in the plasma concentration of VCM. Furthermore, rats with INM-induced SIUs did not exhibit any significant changes in the markers of renal function. These findings indicated that VCM absorption was likely to be increased by the intestinal mucosal injury induced by INM.
In conclusion, additional impairment extended to the rat liver in rats with INM-induced SIUs. This secondary hepatic dysfunction was accompanied by decreased expression of hepatic CYPs, but not mdr1a. Furthermore, INM treatment resulted in intestinal mucosal injury, which may contribute to the absorption of drugs in the gastrointestinal tract. However, further studies are required to investigate the detailed regulation of decreased CYP expression in rats with INM-induced SIUs.
Supplementary Material
Supplementary Table 1Acknowledgements
This study was supported by the Science Research Promotion Fund for the Promotion and Mutual Aid Corporation for Private Schools of Japan (S.K.). This study was also supported by a Grant-in-Aid for Young Scientists (B) from the Ministry of Education, Culture, Sports, Science and Technology (MEXT) of Japan (no. 25860568 to J.I.)
Competing Interests
The authors have declared that no competing interest exists.
References
1. Wallace JL. Mechanisms, prevention and clinical implications of nonsteroidal anti-inflammatory drug-enteropathy. World J Gastroenterol. 2013;19:1861-1876
2. Arakawa T, Watanabe T, Tanigawa T. et al. Small intestinal injury caused by NSAIDs/aspirin: finding new from old. Curr Med Chem. 2012;19:77-81
3. Boelsterli UA, Redinbo MR, Saitta KS. Multiple NSAID-induced hits injure the small intestine: underlying mechanisms and novel strategies. Toxicol Sci. 2013;131:654-667
4. Zhang Y, Benet LZ. The gut as a barrier to drug absorption: combined role of cytochrome P450 3A and P-glycoprotein. Clin Pharmacokinet. 2001;40:159-168
5. Chan LM, Lowes S, Hirst BH. The ABCs of drug transport in intestine and liver: efflux proteins limiting drug absorption and bioavailability. Eur J Pharm Sci. 2004;21:25-51
6. Lin JH, Chiba M, Baillie TA. Is the role of the small intestine in first-pass metabolism overemphasized? Pharmacol Rev. 1999;51:135-158
7. Wacher VJ, Wu CY, Benet LZ. Overlapping substrate specificities and tissue distribution of cytochrome P450 3A and P-glycoprotein: implications for drug delivery and activity in cancer chemotherapy. Mol Carcinog. 1995;13:129-134
8. Katragadda S, Budda B, Anand BS. et al. Role of efflux pumps and metabolising enzymes in drug delivery. Expert Opin Drug Deliv. 2005;2:683-705
9. Canaparo R, Finnstrom N, Serpe L. et al. Expression of CYP3A isoforms and P-glycoprotein in human stomach, jejunum and ileum. Clin Exp Pharmacol Physiol. 2007;34:1138-1144
10. Berggren S, Gall C. et al. Gene and protein expression of P-glycoprotein, MRP1, MRP2, and CYP3A4 in the small and large human intestine. Mol Pharm. 2007;4:252-257
11. Paine MF, Khalighi M, Fisher JM. et al. Characterization of interintestinal and intraintestinal variations in human CYP3A-dependent metabolism. J Pharmacol Exp Ther. 1997;283:1552-1562
12. de Waziers I, Cugnenc PH, Yang CS. et al. Cytochrome P 450 isoenzymes, epoxide hydrolase and glutathione transferases in rat and human hepatic and extrahepatic tissues. J Pharmacol Exp Ther. 1990;253:387-394
13. Takara K, Ohnishi N, Horibe S. et al. Expression profiles of drug-metabolizing enzyme CYP3A and drug efflux transporter multidrug resistance 1 subfamily mRNAS in small intestine. Drug Metab Dispos. 2003;31:1235-1239
14. Mitschke D, Reichel A, Fricker G. et al. Characterization of cytochrome P450 protein expression along the entire length of the intestine of male and female rats. Drug Metab Dispos. 2008;36:1039-1045
15. Fujimori S, Gudis K, Takahashi Y. et al. Distribution of small intestinal mucosal injuries as a result of NSAID administration. Eur J Clin Invest. 2010;40:504-510
16. Morris AJ, MacKenzie JF. Small-bowel enteroscopy and NSAID ulceration. Lancet. 1991;337:1550
17. Tanaka A, Hase S, Miyazawa T. et al. Role of cyclooxygenase (COX)-1 and COX-2 inhibition in nonsteroidal anti-inflammatory drug-induced intestinal damage in rats: relation to various pathogenic events. J Pharmacol Exp Ther. 2002;303:1248-1254
18. Reuter BK, Davies NM, Wallace JL. Nonsteroidal anti-inflammatory drug enteropathy in rats: role of permeability, bacteria, and enterohepatic circulation. Gastroenterology. 1997;112:109-117
19. Kalitsky-Szirtes J, Shayeganpour A, Brocks DR. et al. Suppression of drug-metabolizing enzymes and efflux transporters in the intestine of endotoxin-treated rats. Drug Metab Dispos. 2004;32:20-27
20. Geier A, Dietrich CG, Voigt S. et al. Cytokine-dependent regulation of hepatic organic anion transporter gene transactivators in mouse liver. Am J Physiol Gastrointest Liver Physiol. 2005;289:G831-G841
21. Kawauchi S, Nakamura T, Miki I. et al. Downregulation of CYP3A and P-Glycoprotein in the secondary inflammatory response of mice with dextran sulfate sodium-induced colitis and its contribution to cyclosporine A blood concentrations. J Pharmacol Sci. 2014;124:180-191
22. Matzke GR, Zhanel GG, Guay DR. Clinical pharmacokinetics of vancomycin. Clin Pharmacokinet. 1986;11:257-282
23. Konaka A, Kato S, Tanaka A. et al. Roles of enterobacteria, nitric oxide and neutrophil in pathogenesis of indomethacin-induced small intestinal lesions in rats. Pharmacol Res. 1999;40:517-524
24. Hartley DP, Dai X, Yabut J. et al. Identification of potential pharmacological and toxicological targets differentiating structural analogs by acombination of transcriptional profiling and promoter analysis in LS-180 and Caco-2 adenocarcinoma cell lines. Pharmacogenet Genomics. 2006;16:579-599
25. Synold TW, Dussault I, Forman BM. The orphan nuclear receptor SXR coordinately regulates drug metabolism and efflux. Nat Med. 2001;7:584-590
26. Livak KJ, Schmittgen TD. Analysis of relative gene expression data using real-time quantitative PCR and the 2(-Delta Delta C(T)) method. Methods. 2001;25:402-408
27. Higuchi K, Umegaki E, Watanabe T. et al. Present status and strategy of NSAIDs-induced small bowel injury. J Gastroenterol. 2009;44:879-888
28. Park SC, Chun HJ, Kang CD. et al. Prevention and management of non-steroidal anti-inflammatory drugs-induced small intestinal injury. World J Gastroenterol. 2011;17:4647-4653
29. Takeuchi K, Tanaka A, Kato S. et al. Roles of COX inhibition in pathogenesis of NSAID-induced small intestinal damage. Clin Chim Acta. 2010;411:459-466
30. Tanaka A, Hase S, Miyazawa T. et al. Up-regulation of cyclooxygenase-2 by inhibition of cyclooxygenase-1: a key to nonsteroidal anti-inflammatory drug-induced intestinal damage. J Pharmacol Exp Ther. 2002;300:754-761
31. Tanaka A, Kunikata T, Mizoguchi H. et al. Dual action of nitric oxide in pathogenesis of indomethacin-induced small intestinal ulceration in rats. J Physiol Pharmacol. 1999;50:405-417
32. Takeuchi K, Hatazawa R, Tanigami M. et al. Role of endogenous nitric oxide (NO) and NO synthases in healing of indomethacin-induced intestinal ulcers in rats. Life Sci. 2007;80:329-336
33. Takeuchi K, Kato S, Amagase K. Prostaglandin EP receptors involved in modulating gastrointestinal mucosal integrity. J Pharmacol Sci. 2010;114:248-261
34. Lee CM, Kim BY, Li L. et al. Nitric oxide-dependent proteasomal degradation of cytochrome P450 2B proteins. J Biol Chem. 2008;283:889-898
35. Masubuchi Y, Enoki K, Horie T. Down-regulation of hepatic cytochrome P450 enzymes in rats with trinitrobenzene sulfonic acid-induced colitis. Drug Metab Dispos. 2008;36:597-603
36. Masubuchi Y, Masuda E, Horie T. Multiple mechanisms in indomethacin-induced impairment of hepatic cytochrome P450 enzymes in rats. Gastroenterology. 2002;122:774-783
37. Hiroi T, Imaoka S, Chow T. et al. Tissue distributions of CYP2D1, 2D2, 2D3 and 2D4 mRNA in rats detected by RT-PCR. Biochim Biophys Acta. 1998;1380:305-312
38. Mouly S, Meune C, Bergmann JF. Mini-series: I. Basic science. Uncertainty and inaccuracy of predicting CYP-mediated in vivo drug interactions in the ICU from in vitro models: focus on CYP3A4. Intensive Care Med. 2009;35:417-429
39. Yokogawa K, Watanabe M, Takeshita H. et al. Serum aminotransferase activity as a predictor of clearance of drugs metabolized by CYP isoforms in rats with acute hepatic failure induced by carbon tetrachloride. Int J Pharm. 2004;269:479-489
40. Nakamura T, Takano M, Yasuhara M. et al. In-vivo clearance study of vancomycin in rats. J Pharm Pharmacol. 1996;48:1197-1200
Author contact
![]() Corresponding authors: Tsutomu Nakamura, Ph.D. Department of Pharmaceutical Health Care, Faculty of Pharmaceutical Sciences, Himeji Dokkyo University, 7-2-1 Kamiohno, Himeji, 670-8524, Japan. Phone/Fax: +81-79-223-6833 E-mail: tsutomunhimeji-du.ac.jp and Toshihito Tanahashi M.D., Ph.D. Department of Medical Pharmaceutics, Kobe Pharmaceutical University, 4-19-1Motoyamakita-machi, Higashinada-ku, Kobe, 658-8558, Japan. Phone/Fax: +81-78-441-7579 E-mail: tanaac.jp.
Corresponding authors: Tsutomu Nakamura, Ph.D. Department of Pharmaceutical Health Care, Faculty of Pharmaceutical Sciences, Himeji Dokkyo University, 7-2-1 Kamiohno, Himeji, 670-8524, Japan. Phone/Fax: +81-79-223-6833 E-mail: tsutomunhimeji-du.ac.jp and Toshihito Tanahashi M.D., Ph.D. Department of Medical Pharmaceutics, Kobe Pharmaceutical University, 4-19-1Motoyamakita-machi, Higashinada-ku, Kobe, 658-8558, Japan. Phone/Fax: +81-78-441-7579 E-mail: tanaac.jp.