Impact Factor ISSN: 1449-1907

 Global reach, higher impact
Int J Med Sci 2014; 11(6):587-592. doi:10.7150/ijms.8025 This issue Cite
Research Paper
Late-onset Depression in the Absence of Stroke: Associated with Silent Brain Infarctions, Microbleeds and Lesion Locations
Ri-Han Wu1*, Chao Feng1, 2*, Yu Xu3, Ting Hua3, Xue-Yuan Liu1 ![]() , Min Fang1
, Min Fang1 ![]()
1. Department of Neurology, Shanghai Tenth People's Hospital of Tongji University, School of Medicine, Shanghai, China;
2. Yiwu Affiliated Hospital of Zhejiang University, School of Medicine, Zhejiang, China;
3. Department of Radiology, Shanghai Tenth People's Hospital of Tongji University, School of Medicine, Shanghai, China.
* contributed equally to this paper.
Received 2013-10-31; Accepted 2014-3-25; Published 2014-4-8
Abstract
Background: Late-onset depression (LOD) is a frequent mood disorder among elderly. Previous studies have proved that LOD is associated with cerebral silent lesions especially white matter lesions (WML) and yielded the “vascular depression” hypothesis to explain the pathogenesis of LOD. However, there were relatively few studies about the association between silent brain infarctions (SBIs), microbleeds (MBs) and the prevalence of LOD. In this study we sought to evaluate the presence, accumulation and locations of SBIs and MBs, and explore the possible association between them and LOD.
Methods: 65 patients of LOD diagnosed according to DSM-IV and 270 subjects of control group were enrolled and scanned by MRI to analyze the presence, numbers and locations of SBIs and MBs. Clinical and radiological characteristics were compared between LOD patients and control group. Logistic regression models were constructed to identify the independent risk factors for LOD.
Results: LOD patients had higher prevalence and numbers of both SBIs and MBs. SBIs and MBs in the left hemisphere, SBIs in basal ganglia and lobar MBs were all independent risk factors for LOD.
Conclusion: The presence of both SBIs and MBs were associated with a higher rate LOD. Lesions in some specific locations might be critical for the presence of LOD.
Keywords: Late-onset depression, stroke, silent brain infarctions, microbleeds.
Introduction
Depression is a frequent mood disorder. Adult people could suffer from depression in different ages. According to the age of onset, depression is usually classified as early-onset depression (EOD) and late-onset depression (LOD), with a cut-off age 40-65 years old, which varied a lot in different studies [1,2]. The etiology of depression is not clear yet and there are different hypothesizes, which mainly involve neurotransmitters [3], cerebral lesions [4], neurogenesis [5], social support and psychological factors [6]. Previous studies showed that, compared to EOD, LOD is more strongly associated with cerebral lesions, including acute infarctions and silent lesions [7,8].
Previously, cerebral lesions were mainly studied in post-stroke depression (PSD) [4], which could also be regarded as a special subtype of LOD because most stroke patients are aged. The lesion location hypothesis is widely accepted as an important mechanism of PSD. According to this hypothesis, acute infarctions in specific areas such as prefrontal lobe and basilar ganglia could destruct the critical circuits and the pathways of mood related neurotransmitters, thus lead to depressive disorders [9]. Later, some researchers found that patients of LOD had higher rates of silent lesions such as white matter lesions (WML) and silent brain infarctions (SBIs) compared with patients of EOD[10,11]. Thus, the concept of “vascular depression” was proposed as a hypothesis for the etiology of LOD [12]. This hypothesis emphasizes the role of silent lesions which might destruct some critical areas of mood control, thus could be regarded as the extension of lesion location hypothesis in PSD actually. However, most evidence about vascular depression was from the studies of WML or indirectly from the studies of acute infarctions in PSD [13,14,15]. There were quite few studies about the association between SBIs and the incidence of depression [11,16] compared with those about WML. Studies about microbleeds (MBs) in LOD couldn't even be searched out. Now it's still unclear whether the locations of SBIs, the presence and locations of MBs are associated with LOD.
Depression is usually covert and underdiagnosed in the community. However, patients with depressive tendency are not rare and often showed non-specific symptoms such as dizziness, fatigue and insomnia [17,18,19] which are very common in the neurological outpatient department. In this study, we assumed that LOD was associated with various subtypes of silent lesions including SBIs and MBs. In order to test our presumption, we screened the patients with depressive tendency using Diagnostic and Statistical manual of mental disorders, 4th edn (DSM-Ⅳ), and MR scan including susceptibility weighted imaging (SWI) which is more validated for the identification of MB than gradient-echo series [20], and sought to explore the associations between LOD and the presence, accumulation and locations of SBIs and MBs.
Methods
Ethics Statement
All the procedures were approved by the Ethics Committee of 10th People's Hospital.
General Information
This was a case-control study based on the outpatients of the Neurological Department of 10th People's Hospital in Shanghai from September 2011 to October 2012, who had non-specific symptoms including dizziness, fatigue and insomnia and were guided to the Neurological Department. Subjects were divided into two groups: LOD group and control group. Patients were consecutively enrolled according to following criteria: 1) 65 years old or older, with ability and will to give consent to this study; 2) without physical disability; 3) patients were enrolled into LOD group if they were diagnosed as major depression according to DSM-Ⅳ after a face-to-face interview (performed by Chao Feng), with first depressive episode after 65 years old according to the medical history supplied by the patients themselves or by their family members; meanwhile subjects without any depressive symptoms or depressive histories were consecutively enrolled into control group. Patients with following conditions were excluded; 1) diagnosis or history of acute stroke, intracranial tumor, migraine, Parkinson disease, schizophrenia, dementia, other central or peripheral nervous system diseases; 2) sick because of severe diseases of other systems including cancer, uremia, respiratory failure, heart failure with a New York Heart Association degree 3 or 4, cirrhosis, lupus, and et al.; 3) history of depressive symptoms including depression and apathy before 65 years old which were indicative of the diagnosis of early-onset depression; 4) history of current antidepressants uptake which might influence the evaluation of depression; 5) metal plants and claustrophobia. At last, 740 patients with consent to this study and without physical disability were screened; 65 patients of LOD and 270 subjects of control group met all the criteria and were enrolled. Among the 65 patients with LOD, 52 were diagnosed as depression for the first time.
Following information was collected: age, sex, education years, and medical history including hypertension, diabetes, depression. Following medical protocol was performed on each patient: brain MRI including SWI; blood test for blood cell count, blood glucose, creatinine and liver enzymes; Mini-Mental State Examination (MMSE) and Lubben Social Network Scale (LSNS) by the same investigator (Ri-Han Wu). LSNS is a psychosocial scale mainly focusing on the interactions between elderly and their social network, containing 10 items of different aspects. The maximum score of LSNS is 50. A lower score of LSNS indicated lack of social support [21].
MR protocol and image criteria
All subjects were imaged by a 3.0T MR scanner (Siemens 3.0T Magnetom Verio, Germany). The MRI imaging protocol consisted of T1-weighted images (repetition time (TR)/echo time (TE) = 2000/9), FLAIR (TR/TE = 8500/94), and diffusion-weighted imaging (TR/TE = 6000/94) on the axial plane; T2-weighted images (TR/TE = 4540/96) on the sagittal plane with a thickness of 5.5 mm; and SWI (TR/TE = 27/20) on the axial plane with a thickness of 1.5 mm.
All images were reviewed by 2 radiologists blind to the clinical information. WML, SBI and MB were evaluated on MRI. The discrepancy in the scores of WML, presence, numbers and locations of SBI and MB was resolved by a visual consensus.
WML was defined as focal or confluent hyperintensities in the deep or periventricular area on FLAIR images [22] and was scaled as 0-3 according to Fazekas' scale [23]. SBI was defined as a focal cavitated lesion 3 mm to 15 mm in size, with hypointensity on T1-weighted images and hyperintensity on T2-weighted images, without corresponding stroke history [24]. MBs were defined as homogenous round areas of signal loss with diameters less than 10 mm on SWI images [25]. Hypointense lesions within the subarachnoid space, basal ganglia mineralization, and other lesions or structures with similar signals were excluded during the MB evaluation.
The total numbers of SBIs and MBs were counted. The presences of SBIs and MBs in left hemisphere, right hemisphere, and other regions (corpus callosum, brainstem and cerebellum) were recorded respectively. Besides, the presence of SBIs in basal ganglia, subcortical area, thalamus, and infratentorial region was recorded respectively, while the presence of lobar (frontal, temporal, parietal and occipital lobal), deep (basal ganglia, subcortical and thalamus) and infratentorial MBs was recorded respectively.
Data analysis
All data were analyzed with SPSS 18.0. Chi-square test and Student t test were respectively used to compare the values of all the baseline characteristics, image features, MMSE and LSNS between two groups. Variables with a P value ≤ 0.05 were further analyzed with logistic regression models to testify the independence of SBIs and MBs in different locations for the presence of LOD with non-LOD subjects as contrast. P < 0.05 was considered to indicate statistical difference. The details of regression models were introduced in the part of “results”.
Results
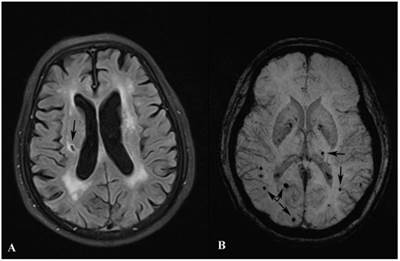
LOD patients were more likely to be female, lack of social support, with severe WML and cognitive dysfunction than control group. Besides, LOD patients had higher prevalence of SBIs and MBs, especially lesions in the left hemisphere, SBIs in basal ganglia and lobar MBs than control group. (All p<0.05). Details were listed in Table 1. Examples of SBIs and MBs were illustrated in Figure 1.
Demographic, neuropsychological and radiological characteristics.
| Control (n = 270) | LOD (n = 65) | P | |
|---|---|---|---|
| Age, years | 72.28±5.65 | 73.17±4.36 | 0.237 |
| Female | 130 (48.15%) | 46 (70.77%) | 0.001 |
| Education years | 4.39±3.88 | 3.80±3.66 | 0.271 |
| MMSE score | 25.11±2.81 | 24.22±2.43 | 0.018 |
| LSNS score | 36.09±5.32 | 33.98±5.45 | 0.005 |
| Hypertension | 166 (61.5%) | 47 (72.3%) | 0.115 |
| Diabetes | 75 (27.8%) | 23 (35.4%) | 0.226 |
| WML score | 1.11±0.97 | 1.62±1.10 | <0.001 |
| SBI score | 0.57±0.94 | 1.14±1.29 | <0.001 |
| MB score | 0.60±1.00 | 1.06±1.29 | 0.002 |
| Prevalence of SBIs in | |||
| Any region | 79 (29.3%) | 31 (47.7%) | 0.004 |
| Left hemisphere | 44 (16.3%) | 24 (36.9%) | <0.001 |
| Right hemisphere | 52 (19.3%) | 17 (26.2%) | 0.217 |
| Other regions | 26 (9.6%) | 10 (15.4%) | 0.179 |
| Basal ganglia | 38 (14.1%) | 22 (33.8%) | <0.001 |
| Subcortical | 40 (14.8%) | 14 (21.5%) | 0.186 |
| Thalamus | 32 (11.9%) | 12 (18.5%) | 0.157 |
| Infratentorial | 22 (8.1%) | 9 (13.8%) | 0.155 |
| Prevalence of MBs in | |||
| Any region | 83 (30.7%) | 29 (44.6%) | 0.033 |
| Left hemisphere | 46 (17.0%) | 21 (32.3%) | 0.006 |
| Right hemisphere | 58 (21.5%) | 15 (23.1%) | 0.780 |
| Other regions | 31 (11.5%) | 9 (13.8%) | 0.598 |
| Lobar | 52 (19.3%) | 24 (36.9%) | 0.002 |
| Frontal | 23 (8.5%) | 13 (20.0%) | 0.007 |
| Temporal | 30 (11.1%) | 14 (21.5%) | 0.025 |
| Parietal | 30 (11.1%) | 12 (18.5%) | 0.108 |
| Occipital | 12 (4.4%) | 7 (10.8%) | 0.093 |
| Deep | 58 (21.5%) | 17 (26.2%) | 0.417 |
| Basal ganglia | 36 (13.3%) | 13 (20.0%) | 0.172 |
| Subcortical | 39 (14.4%) | 13 (20.0%) | 0.267 |
| Thalamus | 31 (11.5%) | 11 (16.9%) | 0.234 |
| Infratentorial | 29 (10.7%) | 8 (12.3%) | 0.717 |
All values of measurement and half-categorized data were shown as mean ± SD, while values of categorized data were shown as numbers (percentage).
Images of SBI and MB. Image A shows a SBI (black arrow) in the right cerebral hemisphere. Image B shows MBs (black arrows) in both hemispheres.
Logistic regression models were constructed to analyze the significance of the presence (yes/no), accumulation (numbers) and locations of SBIs and MBs for the presence of LOD respectively with step-wise method. First, the presences of SBIs and MBs in any region for all subjects were added into the regression model with Sex, MMSE, LSNS and WML score (all p<0.05 as shown in Table 1) as confounding factors. However, the results showed that neither the presence of SBIs nor MBs was an independent risk factor. Then the total numbers of SBIs and MBs in replace of their presences were added into the second model with sex, MMSE, LSNS and WML scores added in too, and the results showed that the accumulation of SBIs but not MBs was an independent risk factor for LOD. The details about the 2 models were listed in Table 2.
Logistic regression models about the presence and accumulation of lesions in LOD.
| OR (95% CI) | P | |
|---|---|---|
| Model 1 | ||
| Female | 2.822 (1.529-5.207) | 0.001 |
| MMSE score | 1.062 (0.916-1.233) | 0.424 |
| LSNS score | 0.928 (0.878-0.980) | 0.007 |
| WML score | 1.623 (1.108-2.377) | 0.013 |
| Presence of SBIs | 1.618 (0.775-3.379) | 0.200 |
| Presences of MBs | 1.165 (0.579-2.346) | 0.668 |
| Model 2* | ||
| Number of SBIs | 1.322 (1.102-1.586) | 0.003 |
| Number of MBs | 1.136 (0.965-1.054) | 0.695 |
Sex, MMSE, LSNS and WML scores, the presence of SBIs and MBs in any region were added in Model 1. Sex, MMSE, LSNS and WML scores, the numbers of SBIs and MBs were added in Model 2. *Results about sex, MMSE, LSNS, WML in the second model were similar to those in the first model, thus were not shown here.
Four other regression models were constructed to analyze the association between LOD and specific lesion locations with a p value<0.05 shown in Table 1 respectively. Sex, MMSE, LSNS and WML score were also added into the regression models as confounding factors. Step one, the presences of SBIs and MBs in the left hemisphere were analyzed, and the results showed that the presences of both SBIs and MBs in the left hemisphere were independent risk factors for LOD. Step two, the presences of SBIs in basal ganglia and lobar MBs in replace of lesions in the left hemisphere were analyzed and the results showed that both of them were independent risk factors for LOD too. At last, the presences of MBs in frontal and temporal lobes were respectively added into the model of step two in replace of the presence of lobar MBs, however, after adjusting for the confounding factors, the MB locations lost significance in LOD. The details about the four regression models were listed in Table 3.
Logistic regression models about lesion locations in LOD.
| OR (95% CI) | P | |
|---|---|---|
| Model 1 | ||
| Female | 2.932 (1.567-5.484) | 0.001 |
| MMSE score | 1.105 (0.953-1.280) | 0.186 |
| LSNS score | 0.923 (0.873-0.977) | 0.006 |
| WML score | 1.535 (1.044-2.258) | 0.029 |
| Presence of SBIs in the left hemisphere | 2.350 (1.147-4.817) | 0.020 |
| Presence of MBs in the left hemisphere | 2.192 (1.072-4.480) | 0.031 |
| Model 2* | ||
| Presence of SBIs in basal ganglia | 2.240 (1.074-4.672) | 0.032 |
| Presence of Lobar MBs | 2.181 (1.032-4.611) | 0.041 |
| Model 3* | ||
| Presence of SBIs in basal ganglia | 2.387 (1.149-4.956) | 0.020 |
| Presence of MBs in frontal lobe | 2.177 (0.911-5.205) | 0.080 |
| Model 4* | ||
| Presence of SBIs in basal ganglia | 2.510 (1.218-5.175) | 0.013 |
| Presence of MBs in temporal lobe | 1.508 (0.667-3.409) | 0.324 |
Sex, MMSE, LSNS and WML scores, the presence of SBIs and MBs in the left hemisphere were added in Model 1. In Model 2 - 4, the presence of SBIs in basal ganglia and MBs in lobes (Model 2)/MBs in frontal lobe (Model 3)/MBs in temporal lobe (Model 4) were added in replace of SBIs and MBs in the left hemisphere. *Results about sex, MMSE, LSNS, WML in the last three models were similar to those in the first model, thus were not shown here.
Discussion
This study focused on the association between LOD and the vascular lesions in relatively healthy elderly. The results of this study verified the vascular depression hypothesis in LOD based on the evaluation of SBIs, MBs and lesion locations, and also indicated that, SBIs and MBs especially lesions in the left hemisphere, SBIs in basal ganglia and lobar MBs might be associated with LOD just like WML.
The vascular depression hypothesis was mainly based on the study of WML and vascular burdens. Our study verified that, severe WML was an independent risk factor for LOD. WML was widely considered as a phenotype of hypertension related small vessel disease (SVD) [26]. WML could result in neuronal and axonal loss, decline of microstructural integrity and disruption of fiber tracts within frontostriatal circuits which were involved in mood control, thus induces mood disorders [22]. SBIs and MBs are another two phenotypes of SVD [26]. Previous studies have demonstrated that SBIs and MBs especially SBIs are similar to WML in various aspects [26,27]. For example, they are both associated with cognitive dysfunction and a higher risk of stroke [27]. There were also a few studies reporting a possible association between the prevalence of SBIs and depression [11,16]. However, the association between MBs and LOD hasn't been reported. In this study, the comparisons showed that the prevalence and numbers of both SBIs and MBs were higher in LOD group than those in control group. These results verified the association between SBIs and LOD again, and also suggested that MBs might be associated with LOD just like WML and SBIs. Furthermore, we found that lesion locations were even more critical for LOD than the presence and accumulation of silent lesions. Our study showed that, although the presence and numbers of both SBIs and MBs differed between 2 groups, after adjusting for the confounding factors, only the accumulation of SBIs was identified as an independent risk factor for LOD. On the other hand, after adjusting for the confounding factors, SBIs and MBs in the left hemisphere, SBIs in basal ganglia and lobar MBs were still independent risk factors for LOD. It implied that lesions in some strategic locations were more likely to result in LOD than the presence and accumulation of lesions in non-strategic regions. This result is also in accordance with the lesion location hypothesis of PSD which mainly concludes that lesions in the left hemisphere, especially frontal lobe and basal ganglia were critical for PSD [9,28]. In conclusion, lesions in strategic regions, including acute infarctions and silent lesions of different subtypes, are all possible sources of depression, including PSD and other subtypes of LOD.
In this study, we tried to dig out the specific location that was associated with LOD most strongly. However, our results seemed puzzling to some extent. Results about SBIs suggested that basal ganglia might be a critical region for LOD while results about MBs showed that the prevalence of MBs in basal ganglia was not significantly different between 2 groups; instead, lobes where SBIs scarcely located in seemed to be more critical than basal ganglia. The limited sample size and even more limited patients with MBs in deep region could partly account for this dilemma because a small sample size could limit the statistical significance of difference. Besides, lobar MBs were widely believed to be related to cerebral amyloid angiopathy [29,30], different from other subtypes of SVD including WML, SBIs and deep MBs which might be caused by lipohyalinosis and demyelination [22,26]. It has been proved that lobar MBs are associated with cognitive dysfunction more strongly than other subtypes of SVD [30]. So it's reasonable to discuss the possibility that lobar MBs also have special impact on emotions because of its special pathogenesis.
This was the first report about MBs and their locations in non-stroke patients with LOD, and we also evaluated the specific locations of SBIs in LOD for the first time. The strength of this study mainly involved the systematic evaluation of lesion locations, including laterality and more specific regions of brain. Thus we could compare the contributions of silent lesions in different regions to LOD. Besides, the utilization of SWI in this study could provide a better view for MBs and improve the detection rate of MBs. However, some limitations were inevitable. For example, this study was just a case-control study based on outpatients of one hospital with LOD, without patients of EOD as control. Thus the representativeness of our results was limited, with the findings only applicable to LOD but not all subtypes of depression. Besides, MMSE which is a simple, basic scale and more powered on memory was used for the evaluation of cognitive function. Considering the limitation of MMSE, we couldn't rule out all the cognitive dysfunction. In this study some variables related to brain function such as handedness of the subjects were not analyzed, thus related bias was inevitable. Furthermore, due to the limited sample size, we could not further analyze the laterality of lesions in frontal lobe, temporal lobe and basal ganglia. Anyway, in the future, more studies are still required to explore the different impact of SBIs and MBs in different regions on different subtypes of depression.
Acknowledgements
This work was supported by grants from the Scientific Program of Science and Technology Committee of Shanghai (No. 11411950303) and National Natural Science Foundation of China (No. 81000492, No. 30971029, No. 81171163).
Conflict of Interest
None.
References
1. Bukh JD, Bock C, Vinberg M, Gether U, Kessing LV. Differences between early and late onset adult depression. Clin Pract Epidemiol Ment Health. 2011;7:140-147
2. Korten NC, Comijs HC, Lamers F, Penninx BW. Early and late onset depression in young and middle aged adults: differential symptomatology, characteristics and risk factors? J Affect Disord. 2012;138:259-267
3. Sperner-Unterweger B, Kohl C, Fuchs D. Immune Changes and Neurotransmitters: Possible Interactions in Depression? Prog Neuropsychopharmacol Biol Psychiatry. 2012
4. Loubinoux I, Kronenberg G, Endres M, Schumann-Bard P, Freret T. et al. Post-stroke depression: mechanisms, translation and therapy. J Cell Mol Med. 2012;16:1961-1969
5. Eisch AJ, Petrik D. Depression and hippocampal neurogenesis: a road to remission? Science. 2012;338:72-75
6. Lieverse R, de Vries R, Hoogendoorn AW, Smit JH, Hoogendijk WJ. Social Support and Social Rhythm Regularity in Elderly Patients With Major Depressive Disorder. Am J Geriatr Psychiatry. 2012
7. Papazacharias A, Logroscino G, Barulli MR, Nardini M. Late life depression and late onset depression: are the same clinical and pathopsysiological picture? Psychiatr Danub 22 Suppl. 2010;1:S108-110
8. Xekardaki A, Santos M, Hof P, Kovari E, Bouras C. et al. Neuropathological substrates and structural changes in late-life depression: the impact of vascular burden. Acta Neuropathol. 2012;124:453-464
9. Tang WK, Lu JY, Chen YK, Chu WC, Mok V. et al. Association of frontal subcortical circuits infarcts in poststroke depression: a magnetic resonance imaging study of 591 Chinese patients with ischemic stroke. J Geriatr Psychiatry Neurol. 2011;24:44-49
10. Salloway S, Malloy P, Kohn R, Gillard E, Duffy J. et al. MRI and neuropsychological differences in early- and late-life-onset geriatric depression. Neurology. 1996;46:1567-1574
11. Fujikawa T, Yamawaki S, Touhouda Y. Incidence of silent cerebral infarction in patients with major depression. Stroke. 1993;24:1631-1634
12. Alexopoulos GS, Meyers BS, Young RC, Campbell S, Silbersweig D. et al. 'Vascular depression' hypothesis. Arch Gen Psychiatry. 1997;54:915-922
13. Alexopoulos GS, Bruce ML, Silbersweig D, Kalayam B, Stern E. Vascular depression: a new view of late-onset depression. Dialogues Clin Neurosci. 1999;1:68-80
14. Sneed JR, Culang-Reinlieb ME. The vascular depression hypothesis: an update. Am J Geriatr Psychiatry. 2011;19:99-103
15. Dalby RB, Chakravarty MM, Ahdidan J, Sorensen L, Frandsen J. et al. Localization of white-matter lesions and effect of vascular risk factors in late-onset major depression. Psychol Med. 2010;40:1389-1399
16. Saavedra Perez HC, Direk N, Hofman A, Vernooij MW, Tiemeier H. et al. Silent brain infarcts: a cause of depression in the elderly? Psychiatry Res. 2013;211:180-182
17. de Moraes SA, Soares WJ, Rodrigues RA, Fett WC, Ferriolli E. et al. Dizziness in community-dwelling older adults: a population-based study. Braz J Otorhinolaryngol. 2011;77:691-699
18. Hur YM, Burri A, Spector TD. The Genetic and Environmental Structure of the Covariation Among the Symptoms of Insomnia, Fatigue, and Depression in Adult Females. Twin Res Hum Genet. 2012;15(6):1-7
19. Nakao M, Yano E. Prediction of major depression in Japanese adults: somatic manifestation of depression in annual health examinations. J Affect Disord. 2006;90:29-35
20. Tsui YK, Tsai FY, Hasso AN, Greensite F, Nguyen BV. Susceptibility-weighted imaging for differential diagnosis of cerebral vascular pathology: a pictorial review. J Neurol Sci. 2009;287:7-16
21. Lubben JE. Assessing social networks among elderly populations. Fam Community Health. 1988;11:42-52
22. Xiong YY, Mok V. Age-Related White Matter Changes. Journal of Aging Research. 2011;2011:1-13
23. Fazekas F, Chawluk JB, Alavi A, Hurtig HI, Zimmerman RA. MR signal abnormalities at 1.5 T in Alzheimer's dementia and normal aging. AJR. 1987;149:351-356
24. Vermeer SE, Longstreth WT, Koudstaal PJ. Silent brain infarcts: a systematic review. The Lancet Neurology. 2007;6:611-619
25. Poels MMF, Ikram MA, van der Lugt A, Hofman A, Krestin GP. et al. Incidence of Cerebral Microbleeds in the General Population: The Rotterdam Scan Study. Stroke. 2011;42:656-661
26. Moran C, Phan TG, Srikanth VK. Cerebral small vessel disease: a review of clinical, radiological, and histopathological phenotypes. International Journal of Stroke. 2012;7:36-46
27. Pantoni L. Cerebral small vessel disease: from pathogenesis and clinical characteristics to therapeutic challenges. Lancet Neurol. 2010;9:689-701
28. Terroni L, Amaro E, Iosifescu DV, Tinone G, Sato JR. et al. Stroke lesion in cortical neural circuits and post-stroke incidence of major depressive episode: A 4-month prospective study. World Journal of Biological Psychiatry. 2011;12:539-548
29. Charidimou A, Gang Q, Werring DJ. Sporadic cerebral amyloid angiopathy revisited: recent insights into pathophysiology and clinical spectrum. Journal of Neurology, Neurosurgery & Psychiatry. 2011;83:124-137
30. Poels MM, Ikram MA, van der Lugt A, Hofman A, Niessen WJ. et al. Cerebral microbleeds are associated with worse cognitive function: the Rotterdam Scan Study. Neurology. 2012;78:326-333
Author contact
![]() Corresponding author: Min Fang, Tel.: +86-21-66301167, E-mail: fangmin-drcom and Xue-Yuan Liu, Tel.: +86-21-66302582, E-mail: liuxyedu.cn, Department of Neurology, Shanghai Tenth People's Hospital of Tongji University, School of Medicine, Middle Yanchang Rd. 301#, Zhabei District, Shanghai, China.
Corresponding author: Min Fang, Tel.: +86-21-66301167, E-mail: fangmin-drcom and Xue-Yuan Liu, Tel.: +86-21-66302582, E-mail: liuxyedu.cn, Department of Neurology, Shanghai Tenth People's Hospital of Tongji University, School of Medicine, Middle Yanchang Rd. 301#, Zhabei District, Shanghai, China.