Impact Factor ISSN: 1449-1907

 Global reach, higher impact
Int J Med Sci 2014; 11(5):453-460. doi:10.7150/ijms.8172 This issue Cite
Research Paper
Increased Levels of Circulating Advanced Glycation End-Products in Menopausal Women with Osteoporosis
Deng-Ho Yang1,2, Tsay-I Chiang3,4, I-Chang Chang3,5, Fu-Huang Lin6, Cheng-Chung Wei 1,7, Ya-Wen Cheng1,8 ![]()
1. Institute of Medicine, Chung Shan Medical University, Taichung, Taiwan;
2. Division of Rheumatology/Immunology/Allergy, Department of Internal Medicine, Taichung Armed-Forces General Hospital, Taichung, Taiwan;
3. Department of Orthopedic Surgery, Chung Shan Medical University Hospital, Taichung, Taiwan;
4. Department of Nursing, College of Medicine & Nursing, Hung Kuang University, Taichung, Taiwan;
5. School of Medicine, Chung Shan Medical University, Taichung, Taiwan;
6. School of Public Health, National Defense Medical Center, Taipei, Taiwan;
7. Division of Rheumatology/Immunology/Allergy, Department of Internal Medicine, Chung Shan Medical University Hospital, Taichung Taiwan;
8. Graduate Institute of Cancer Biology and Drug Discovery, College of Medical Science and Technology, Taipei Medical University, Taipei, Taiwan.
Received 2013-11-20; Accepted 2014-3-5; Published 2014-3-13
Abstract
Background: Advanced glycation end-products (AGEs) can accumulate in organs and tissues during ageing and diabetes. Increased levels of AGEs are found in the bone tissue of patients with osteoporosis. The purpose of this study was to evaluate circulating AGEs in patients with osteoporosis.
Methods: We evaluated plasma AGEs, osteoporosis-related biomarkers, and bone mass in 82 menopausal women with osteoporosis or osteopenia, 16 young women with osteopenia, and 43 healthy women without osteoporosis or osteopenia.
Results: Higher levels of serum AGEs were found in the osteoporosis or osteopenia group compared to healthy women (P < 0.0001). A negative correlation was observed between serum AGEs and lumbar spine bone density (BMD of lumbar spine, r = -0.249, P = 0.028; T-score of lumbar spine, r = -0.261, P = 0.021). Women with a increased level of serum AGEs (> 8.12 U/mL) had a 5.34-fold risk of osteopenia regarding lumbar spine T-score and a 3.31-fold risk of osteopenia regarding the hip T-score.
Conclusion: Serum AGEs could be used to monitor the severity and progression of osteoporosis. An increased serum level of AGEs was associated with impaired bone formation and was a risk factor for the development of osteoporosis. Targeting AGEs may represent a novel therapeutic approach for primary or secondary osteoporosis.
Keywords: Advanced glycation end-products, Osteopenia, Osteoporosis, Biomarker, Osteopontin.
Introduction
Osteoporosis is a skeletal disorder characterized by a generalized increase in bone fragility resulting in fracture of the hip, spine, or wrist. A higher mortality is observed in these patients after osteoporotic fractures occur [1]. Lower bone mineral density (BMD) can be found in the person with osteoporosis and is assessed with dual x-ray absorptiometry (DXA). The World Health Organization has defined osteoporosis based on the management of DXA, and the reference of standard deviation (SD) is used by young adult female (T-score). Osteopenia (low bone mass) is a value of BMD more than one but less than 2.5 SD below the young adult female reference mean (T-score less than -1 and greater than -2.5 SD). Osteoporosis is defined by a T-score of less than or equal to -2.5 SD [2].
Bone microdamage, including linear microcracks or diffuse damage, can be found in patients with osteoporosis and exhibits an age-related variation [3]. Intra- and extra-cellular advanced glycation end-product (AGE) accumulation occurs in an age-dependent manner in human tissues such as cartilage, brain, vessels, kidney, and retina [4-7]. AGE is a non-enzymatic glycation protein product, and generation involves steps in the classical Maillard reaction and the polyol pathway between glucose (or carbohydrates and α-dicarbonyls) and the amino group of proteins [8,9]. Elevated AGE levels are found in the serum or plasma of patients with rheumatic diseases, including rheumatoid arthritis (RA) and systemic lupus erythematosus [10,11]. RA is a systemic immunologic disease with polyarthritis, abnormal juxta-articular osteopenia, and bony erosion. Different degrees of bone erosion or loss occur during the course of RA by abnormal activation of osteoclast. Osteoporosis is also a disease of osteopenia caused by an imbalance between osteoclasts and osteoblasts. AGEs, which increase exponentially in cortical bone during aging [12], regulate the proliferation and differentiation of osteoblasts. In vitro, AGEs have a detrimental effect on human osteoblast functions and exert a dose-dependent inhibition on bone formation [13]. Among the patients with diabetes, higher percentage of osteoporosis is observed, and there is a positive correlation between hyperglycemia and low bone mass [14]. The possible mechanisms include enhancement of reactive oxygen species by hyperglycemia, glucose toxicity to osteoblasts, imbalance of calciotropic hormones or growth factors [14,15]. Increased production of AGEs formation is found in diabetes rats with a negative correlation of bone density [16]. Circulating AGEs may also lead to decrease in bone strength by damage of structural bone [17]. AGEs play a major role in the progression of osteoporosis or osteopenia and are associated with aging and hyperglycemia.
In this study, we hypothesized that AGEs contribute to the initiation of bone remodeling and processing in osteoporosis. In addition to traditional parameters such as age, estrogen, osteopontin (OPN), collagen type 1 cross-linked telopeptide (CTX), and bone-specific alkaline phosphatase (BAP), the serum AGE level may be an independent risk factor for bone loss. Our study focused on the evaluation of the levels of serum AGEs in women with and without low bone mass.
Patients and Methods
Study participants
All study participants were 20 years of age or older and all provided written informed consent. No patient was excluded from participation based on sex or ethnicity. Patients who were bedridden, diabetic, using steroids or estrogen, abused alcohol, or had a history of renal disease and cancer were excluded. Hyperglycemia can induce the formation of AGEs. Therefore, we excluded the patients with diabetes or using steroid. The patients with long-time bedridden were excluded due to influence of BMD by persistent immobilization. This study was approved by the Institutional Review Board of the Chung-Shan Medical University Hospital.
Menopausal women with osteopenia (low bone mass)
Menopausal women with osteopenia (a T score between -1 and -2.5 over the hip or vertebral bone) were selected for evaluation. This group of patients consisted of 34 women ranging from 44 to 87 years (mean age, 61 years).
Menopausal women with osteoporosis
Menopausal women over 45 years of age with severe osteoporosis (T score < -2.5 with concomitant hip or vertebral fracture, in accordance with the World Health Organization definition) were enrolled. This group of patients consisted of 48 women ranging from 46 to 94 years (mean age, 74 years). Levels of plasma AGEs, OPN, and estrogen were checked and BMD was evaluated by DXA.
Young women with low bone mass
This group consisted of 16 young women with low bone mass (a T score between -1 and -2.5 over the hip or vertebral bone) who were selected for evaluation.
Healthy controls
This group consisted of 43 healthy individuals ranging in age from 20 to 77 years (mean age, 36 years) who were recruited for evaluation as controls. These participants were required to complete a brief questionnaire regarding previous or current medical conditions.
Bone density evaluation
BMD determinations by DXA of the lumbar spine, femoral neck, and Ward's triangle were performed with a GE Healthcare Lunar Prodigy densitometer on all candidates. The BMD of the lumbar spine and hip was measured. Osteopenia (low bone mass) is a value of BMD more than one but less than 2.5 SD below the young adult female reference mean (T-score less than -1 and greater than -2.5 SD). Osteoporosis is defined by a T-score of less than or equal to -2.5 SD. The definition is according to hip or lumbar spine.
Characteristics of the four study groups
Blood samples for both markers were withdrawn in fasting state, early in the morning. CTX was measured by electrochemiluminescence immunoassay (Roche Diagnostics, Mannheim, Germany). BAP was measured by the chemiluminescence immunoassay (DiaSorin LIAISON® BAP OSTASE® assay). Serum fasting glucose and the levels of hemoglobin and creatinine were also assessed. The general data of the different groups and healthy controls are listed in Table 1. A higher proportion of older women were noted in the osteopenia and osteoporosis groups. The patients with osteopenia and osteoporosis had significantly lower BMD and T-scores or Z-scores in the lumbar spine and hip compared with the healthy control group. The osteoporosis group had more severe bone loss. There were no siginificant differences including serum fasting glucose, creatinine, hemoglobulin in each group.
Clinical parameters of the 4 study groups.
| Group | 1 | 2 | 3 | 4 |
|---|---|---|---|---|
| Number | 43 | 34 | 48 | 16 |
| Age (years) | 36.47 ± 13.69 | 61.93 ± 10.66† | 74.75 ± 9.11†,§ | 28.01 ± 6.03 |
| Glucose (mg/dL) | 101.9 ± 11.3 | 102.9 ± 11.9 | 104.2 ± 12.5 | 102.3 ± 10.6 |
| Creatinine (mg/dL) | 1.08 ± 0.22 | 1.08 ± 0.32 | 1.07 ± 0.62 | 1.13 ± 0.14 |
| Hemoglobulin (g/dL) | 13.21 ± 0.84 | 13.11 ± 1.16 | 13.36 ± 1.29 | 13.06 ± 0.52 |
| BMD of lumbar (g/cm2) | 1.19 ± 0.11 | 0.95 ± 0.13† | 0.72 ± 0.12†,§ | 1.08 ± 0.07‡ |
| BMD of total hip (g/cm2) | 0.98 ± 0.10 | 0.81 ± 0.09† | 0.66 ± 0.13†,§ | 0.83 ± 0.07 |
| BMD of neck (g/cm2) | 0.94 ± 0.23 | 0.76 ± 0.09† | 0.62 ± 0.11†,§ | 0.82 ± 0.09 |
| Estrogen (pg/mL) | 81.17 ± 86.12 | 43.46 ± 41.79‡ | 38.65 ± 14.09‡ | 78.84 ± 31.17 |
| T-score of lumbar spine | 0.48 ± 0.87 | -1.38 ± 0.99† | -3.30 ± 0.78†,§ | -0.47 ± 0.68‡ |
| Z-score of lumbar spine | 0.70 ± 1.01 | -0.41 ± 1.15† | -1.36 ± 0.89†,§ | -1.75 ± 0.65‡ |
| T-score of hip | 0.30 ± 0.84 | -1.13 ± 0.69† | -2.09 ± 1.04†,§ | -1.06 ± 0.55† |
| Z-score of hip | 0.53 ± 0.73 | 0.07 ± 0.78 | -0.08 ± 0.84‡ | -0.78 ± 0.63† |
| BAP (μg/L) | 1.38 ± 1.28 | 2.12 ± 1.39† | 1.93 ± 1.39‡ | 0.92 ± 0.52 |
| CTX (ng/mL) | 0.16 ± 0.11 | 0.31 ± 0.36† | 0.35 ± 0.34† | 0.12 ± 0.06 |
Group 1 = healthy control; Group 2 = menopausal women with osteopenia (low bone mass); Group 3 = menopausal women with osteoporosis; Group 4 = young women with low bone mass.
† Significant difference when compared with Group 1, P < 0.0001.
‡ Significant difference when compared with Group 1, P < 0.005.
§ Significant difference when compared with Group 2, P < 0.005.
Plasma AGE evaluation
AGEs were analyzed by the Hitachi 7020/902 auto analyzer. The Hanson® Advanced Glycosylation End Products immunoassay kit (Hanson Hong Biomedical Co, Ltd, Taipei, Taiwan) was used and the results are expressed as unit/mL. The within and between CV was 1.3% and 2.8%, respectively. The kit was removed from the refrigerator and left at room temperature while a colorimetric tube was labeled for each serum sample. Anti-AGE reagent (0.25 mL) was added to each labeled colorimetric tube and the OD value (H1) at 340 nm was recorded for each tube. Each sample was diluted 1:4 after standing for 30 min. Diluted serum (15 mL) was added to the differently labeled colorimetric tubes that contained 0.25 mL of the anti -AGE reagent from which the OD value had been recorded as H1. The OD value was obtained at 340 nm immediately after a 360-s incubation; this value was recorded as the H2 value. To obtain the true OD value of the diluted serum in accordance with the standard curve, the following equation was used: H2 - H1 = H0. This value for the diluted serum was multiplied by 4 to obtain the final result.
Plasma OPN evaluation
The plasma OPN concentration was measured using the enzyme-linked immunosorbent assay (ELISA) method with TiterZyme® Osteopontin detection ELISA kits (TiterZyme, USA). Plates were incubated with PBS-Tween containing 1% fetal calf serum at 37°C for 60 min to block nonspecific binding. Subsequently, OPN standards and serum samples were added to the plate. After incubation at 37°C for 60 min, 100 μl of antibody was added to each well with the exception of the blank well and the plates were incubated at room temperature for 60 min. The plates were washed with PBS, 100 μl of conjugate was added to each well with the exception of the blank well, and the plates were incubated at room temperature for 30 min. The plates were washed and the substrate solution and color were added and measured at 570 and 590 nm by a microtiter plate reader (Model 550, BIO-RAD, Hercules, California). The OPN concentration was calculated using linear regression by plotting the average net OD for each standard versus the human OPN concentration in each standard. An approximation of a straight line was made through the points and the concentration of human OPN in the serum was determined by interpolation.
ELISA of estrogen levels
The levels of estrogen in the serum was calculated using the enzyme-linked immunosorbent assay (ELISA) method with TiterZyme® Estrogen detection ELISA kits (DRG International, Inc, Mountainside, NJ, USA). Plates were incubated with phosphate-buffered saline (PBS)-Tween® containing 1% fetal calf serum (Gibco, Carlsbad, CA, USA) at 37° C for 60 minutes to block nonspecific binding. Estrogen or CTx standards and serum samples were added to the plate. After incubation at 37° C for 60 minutes, 100 µL of yellow antibody was added, except for the blank, and the plates were incubated at room temperature for 60 minutes. After a PBS wash, 100 µL of blue conjugate was added, except for the blank, and the plates were incubated at room temperature for 30 minutes. The plates were washed, and the substrate solution and color were added and measured at 570 and 590 nm by a microtiter plate reader (Model 550; BIO-RAD, Hercules, CA, USA). The concentration of estrogen was calculated using linear graph paper, plotting the average net optical density for each standard versus the human estrogen concentration in each standard. An approximation of a straight line was made through the points. The concentration of human estrogen in the serum was determined by interpolation.
Statistical analysis
SPSS version 15.0 software (SPSS Inc., Chicago, IL, USA) was used to perform all statistical analyses. Differences between the median values of the defined patient groups were compared using the nonparametric Mann-Whitney U test. A Spearman's rank correlation was used to detect correlations among different study parameters. P values less than 0.05 were considered statistically significant.
Results
Serum AGE levels were increased in patients with osteopenia or osteoporosis
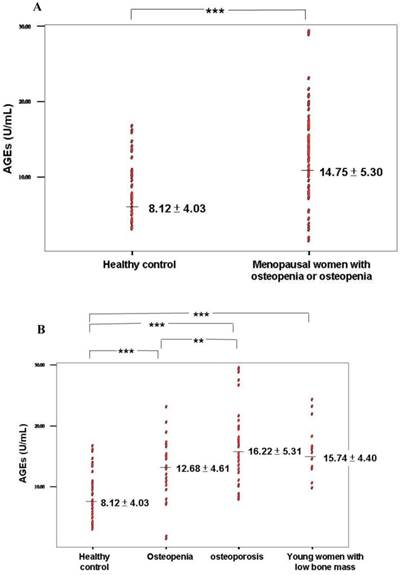
Elevation of serum AGEs was found in patients with osteopenia or osteoporosis compared with healthy controls (Table 2 and Figure 1A). A significantly higher level of AGEs was found in the osteopenia and osteoporosis groups compared with healthy controls (P < 0.0001; Table 3 and Figure 1B). Furthermore, a higher level of serum AGEs was observed in patients with osteoporosis compared with the osteopenia group (P = 0.04; Table 3 and Figure 1B).
Clinical parameters of patients with osteopenia or osteoporosis and healthy controls.
| Group | Healthy control | Osteopenia or osteoporosis | P value |
|---|---|---|---|
| Number | 43 | 82 | |
| Age (years) | 36.47 ± 13.69 | 69.43 ± 11.62 | <0.0001 |
| AGEs (U/mL) | 8.12 ± 4.03 | 14.75 ± 5.30 | <0.0001 |
| OPN (ng/mL) | 7.82 ± 2.16 | 14.03 ± 4.56 | <0.0001 |
| BMD of lumbar (g/cm2) | 1.19 ± 0.11 | 0.82 ± 0.17 | <0.0001 |
| BMD of total hip (g/cm2) | 0.98 ± 0.10 | 0.73 ± 0.13 | <0.0001 |
| BMD of neck (g/cm2) | 0.94 ± 0.23 | 0.68 ± 0.13 | 0.025 |
| Estrogen (pg/mL) | 81.17 ± 86.12 | 40.54 ± 28.14 | 0.001 |
| T-score of lumbar spine | 0.48 ± 0.87 | -2.51 ± 1.79 | <0.0001 |
| T-score of hip | 0.30 ± 0.84 | -1.68 ± 1.03 | <0.0001 |
| BAP (μg/L) | 1.38 ± 1.28 | 2.01 ± 1.39 | 0.002 |
| CTX (ng/mL) | 0.16 ± 0.11 | 0.33 ± 0.25 | <0.0001 |
(A) Serum AGE levels in healthy control and osteopenia or osteoporosis groups. (B) Serum AGE levels in the 4 groups including healthy control, osteopenia, osteoporosis, and young women with low bone mass. *** P value < 0.0001; ** P value < 0.005.
Serum biomarker in the 4 groups.
| Group | 1 | 2 | 3 | 4 |
|---|---|---|---|---|
| Number | 43 | 34 | 48 | 16 |
| AGEs (U/mL) | 8.12 ± 4.03 | 12.67 ± 4.61† | 16.22 ± 5.31†§ | 15.74 ± 4.39† |
| OPN (ng/mL) | 7.81 ± 2.16 | 13.18 ± 4.77† | 14.63 ± 4.36† | 7.60 ± 1.43 |
| Estrogen (pg/mL) | 81.17 ± 86.12 | 43.46 ± 41.79‡ | 38.65 ± 14.09‡ | 78.84 ± 31.17 |
Group 1 = healthy control; Group 2 = menopausal women with osteopenia (low bone mass); Group 3 = menopausal women with osteoporosis; Group 4 = young women with low bone mass.
† Significant difference when compared with Group 1, P < 0.0001.
‡ Significant difference when compared with Group 1, P < 0.005.
§ Significant difference when compared with Group 2, P < 0.005.
Serum AGE levels were increased in the group of young women with low bone mass
The group of young women with low bone mass included in this study had T-scores between -1 and -2.5. These patients could not be diagnosed with osteoporosis because they were young and had not undergone menopause. These women had low bone density as demonstrated by their T-scores and BMDs of the hip and lumbar spine (T-scores between -1 and -2.5). They also had significant lower Z-score of lumbar spine and hip when compared with healthy control (Table 1). The serum AGE level was higher in the young women with low bone mass compared to healthy controls (P < 0.0001; Table 3 and Figure 1B). However, significant differences were not found in the levels of serum OPN, estrogen, BAP, and CTX.
The peripheral estrogen level did not differ between the osteopenia and osteoporosis groups
Although a lower level of estrogen was observed in patients with osteopenia and osteoporosis compared with healthy controls (P = 0.001; Table 2), the level of estrogen did not differ between the osteopenia and osteoporosis groups (P = 0.425). Patients with severe estrogen deficiency (estrogen < 20) had lower hip T-scores compared with patients without severe estrogen deficiency (-1.22 ± 1.35 vs -1.92 ± 1.11, P = 0.040). AGEs, OPN, the lumbar T-score, and the lumbar and hip BMDs were not significantly different between the severe estrogen deficiency and estrogen deficiency groups. The estrogen level was not associated with the AGE and OPN biomarkers.
The serum AGE level was correlated with bone density
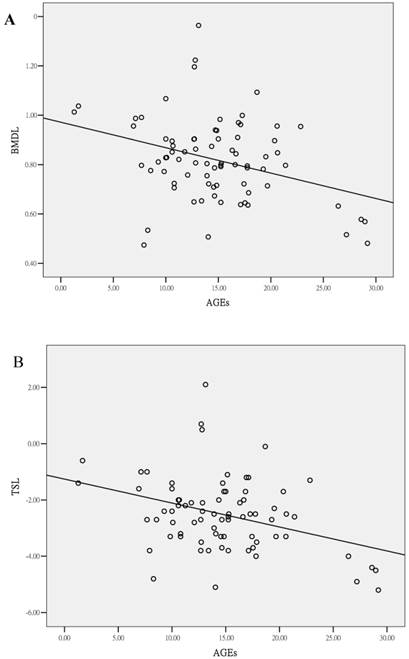
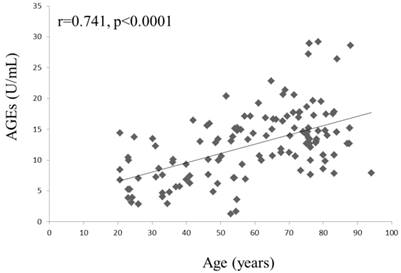
A negative correlation was found between serum AGEs and the lumbar spine bone density (lumbar BMD, r = -0.249, P = 0.028; lumbar T-score, r = -0.261, P = 0.021, Figure 2). However, a significant correlation was not found between serum AGEs and age (P = 0.087) in the patients with osteopenia or osteoporosis. A trend of positive correlation between age and AGEs could be found in osteoporosis or osteopenia patients. We could find the association of age and AGEs in all study subjects (r=0.741, P<0.0001; Figure 3). Age was the major confounder about circulating AGEs. Therefore, we used Z-score (the reference of standard deviation is used by average person of the same age) to evaluate the effects of AGEs in low bone mass. There was still a negative correlation between AGEs and Z-score of lumbar spine (r=-0.295, P=0.001), and negative correlation between OPN and Z-score of lumbar spine (r=-0.336, P<0.001). This indicates that the mean increased level of serum AGEs found in patients with osteoporosis or osteopenia was not due to a significant correlation with increased age. Other clinical parameters were also evaluated. A negative correlation was found between CTX and BMD of neck (r=-0.328, P=0.013). There was no significant correlation between BAP or estrogen and clinical bone density. There is a negative correlation between OPN and BMD of hip or neck (BMD of hip, r = -0.364, P = 0.005; BMD of neck, r = -0.262, P = 0.049; T-score of hip, r = -0.296, P = 0.03). The circulating levels of AGEs, CTX and OPN could serve as biomarkers of bone density in the patients with osteopenia or osteoporosis.
Correlation of serum AGE levels and clinical parameters in patients with osteopenia or osteoporosis. (A) BMD of lumbar spine (r = -0.249, P = 0.028) and (B) T-score of lumbar spine (r = -0.261, P = 0.021).
Correlation of age and serum AGEs in all study subjects.
A high level of serum AGEs was a risk factor for the development of osteopenia
Multivariate logistic regression analyses were performed to evaluate which variables increased the risk of osteopenia (T-score < -1) in women. Women with a high level of serum AGEs (>8.12 U/mL, the mean value of healthy control) had an approximately 5.34-fold risk (95% confidence interval (CI) = 2.25-12.63) of osteopenia regarding the lumbar T-score and an approximately 3.31-fold risk (95% CI = 1.44-7.61) of osteopenia regarding the hip T-score (Table 4) compared with women with low serum AGE levels (≦8.12 U/mL). After adjusting for age, a high serum AGE level had 3.51-fold risk of osteopenia regarding the lumbar T-score. After adjusting for age, estrogen, OPN and glucose, a high serum AGE level (>8.12 U/mL) still had a 2.76-fold risk (95% CI = 1.12-11.70) for the development of osteopenia regarding lumbar T-score. Therefore, serum AGE levels were a significant independent risk biomarker for the progression of osteoporosis.
Odds ratios of serum AGE levels in women with osteopenia (low bone mass) according to lumbar spine and hip T-scores.
| Serum AGEs (U/mL) | Lumbar T-score | Odds ratios | |
|---|---|---|---|
| <-1 (n = 86) | ≧-1 (n = 39) | ||
| AGEs > 8.12 | 41 | 51 | 5.34 (2.25-12.63) |
| AGEs ≦ 8.12 | 11 | 21 | 1 |
| Hip T-score | |||
| <-1 (n = 81) | ≧-1 (n = 44) | ||
| AGEs > 8.12 | 39 | 54 | 3.31 (1.44-7.61) |
| AGEs ≦ 8.12 | 12 | 20 | 1 |
Discussion
Osteoporosis is a systemic disease with abnormal bone metabolism between osteoclasts and osteoblasts. Numerous factors can influence the degree of osteoporosis and risk factors include age, estrogen, cytokines, and inflammation. Estrogen deficiency influences the immune system, resulting in the elevation of Interferon-γ (INF-γ), interleukin (IL)-7, and IL-1 [18,19]. Estrogen withdrawal results in the upregulation of T-cell Tumor necrosis factor-α production and T-cell activation in the thymus and bone marrow [20]. Estrogen loss results in increased T-cell activation and production of pro-osteoclastogenic cytokines by a complex pathway. Following abnormal activation of the immune system and T- and B-cells, bone loss progresses due to the induction of osteoclastogenesis by T-cells or over expression of receptor activator of nuclear factor-kappa B ligand (RANKL) in activated B-cells [21,22]. AGEs induced abnormal T-cell apoptosis in an in vitro study [23] and significant trabecular bone mass loss of the vertebrae and femur was observed in T-cell deficient-mice [24]. Increasing AGE accumulation has been observed in various tissues including the heart, skin, bone, cartilage, and kidney [4-7]. AGEs induce reactive oxygen species via the AGE-specific receptor, which plays key roles in the inflammatory response of diabetic complications such as nephropathy and atherosclerosis [25]. In clinical, Type 2 diabetes patients with high AGE levels have a high risk of osteoporosis [14].
The presence of AGE-modified proteins such as carboxymethyl lysine and imidazolone is found in osteoporotic bone with a different intensity, and a negative correlation has been observed between AGE staining and the percentage of osteoblasts that cover the bone surface [26]. In vitro experiments have shown that osteoclast bone resorption is enhanced by the addition of AGE-modified albumin [27]. A soluble AGE receptor may prevent the proinflammatory effects of bony destruction in RA patients [28]. AGEs appear to trigger inflammation and bone loss in the pathogenesis of RA and osteoporosis. Therefore, AGEs play major role in the impaired bone formation. Our investigation showed increasing AGE levels in the peripheral circulation of patients with osteoporosis or osteopenia (Figure 1A) and the serum AGE level was associated with the severity of bone density loss (Figure 2). Significantly elevated serum AGEs were found in young women with low bone mass, as defined by DXA (Figure 1B). Although these young women could not be diagnosed with osteoporosis, the condition of bone density loss was progressive. Estrogen and OPN levels did not differ between the osteopenia group and the osteoporosis group (Table 3) and the serum AGE level did not differ between the estrogen deficiency group and the severe estrogen deficiency (< 20 pg/mL) group. Thus, serum AGE levels were not influenced significantly by serum estrogen, and the serum AGE level could be used to predict the progression of osteoporosis despite serum estrogen levels.
OPN is a phosphorylated acidic arginine-glycine-aspartate-containing glycoprotein that originally was identified as a major component of the noncollagenous bone matrix expressed by both osteoblasts and osteoclasts [29]. OPN is associated with pathological processes such as wound healing, bone turnover, tumorigenesis, inflammation, ischemia, and immune responses [30]. OPN knockout mice are resistant to ovariectomy-induced bone resorption compared with wild-type mice [31]. In the adaptive immunity of T cells, OPN inhibits production of the Th2 cytokine IL-10, which leads to an enhanced Th1 response [29]. Th1 cytokines, especially IFN-γ and IL-1, can promote osteoclast formation and activity [32]. We previously demonstrated that increased serum OPN is a risk factor for osteoporosis in menopausal women and the serum level of OPN is negatively correlated with the hip and neck BMD and the hip T-score [33]. OPN serves as a biomarker for evaluating the severity of osteoporosis because of its correlation with bone density. In this study, we evaluated the serum OPN levels and found a similar negative correlation with bone density: BMD of hip, r = -0.364, P = 0.005; BMD of neck, r = -0.262, P = 0.049; T-score of hip, r = -0.296, P = 0.03; and CTX, r = 0.388, P < 0.0001 and a positive correlation with age (r = 0.217, P = 0.05). Although elevated serum OPN levels were found in patients with osteoporosis or osteopenia, we did not find a significant OPN elevation among the young women with low bone mass (Table 3). Therefore, OPN appears to be useful for evaluating the severity of osteoporosis but not for the prediction of osteoporosis progression.
In present study, we found that AGEs and OPN could be used as biomarkers to evaluate the severity and risk of this disease in menopausal or childbearing women. T-cells excrete pro-inflammatory cytokines when stimulated with AGEs and OPN induces activation of Th1 cytokine [28,29,32]. An abnormal RANKL activation signal is observed when serum AGEs and OPN are elevated [34-36]. Thereafter, an imbalance between osteoclasts and osteoblasts can develop and progress to gradual bone loss. AGEs increased osteoblast apoptosis in vitro, and a bisphosphonate or an anti-AGE antibody blocked AGE-induced osteoblast apoptosis [37]. Our evaluation of serum AGEs revealed a significantly increased risk of osteopenia or low bone mass (T score < -1) in the hip and lumbar spine when AGEs were elevated (Table 4). We also could find the association of age and AGEs in all study subjects (r=0.741, P<0.0001; Figure 3). After adjusting for age, estrogen, OPN and glucose, a high serum AGE level (>8.12 U/mL) still had an 2.76-fold risk (95% CI = 1.12-11.70) of osteopenia regarding lumbar T-score compared with women with low serum AGE levels (≦8.12). Serum AGE levels might also be used to predict the progression of osteoporosis clinically, resulting in the early detection or prevention of osteoporosis. Bisphosphonate treatment results in changes in AGE accumulation and a reduction in the energy absorption of cortical bone [38]. Therefore, serum AGEs might be also used to monitor the progression of osteoporosis in patients who received anti-osteoporosis therapy including bisphosphonates, parathyroid hormone, calcium, and calcitonin. In clinical, we used DXA to evaluate the severity of osteoporosis. However, the patient could not be received the detection due to radiologic exposure or poor convenience. The serum AGEs may be more easily checked from peripheral blood and be as one of the parameter to monitor the severity or possible progression of osteoporosis. Serum AGEs levels cannot be instead of the role of DXA, and need for further evaluation in the future.
In conclusion, OPN is associated with bone resorption (a positive correlation with serum CTX) and AGEs are associated with impaired function of osteoblasts [13]. Serum OPN levels are strongly associated with bone density loss, including the hip and neck BMDs and the hip T-score. Serum AGEs are associated with bone loss in the lumbar spine. Therefore, serum levels of AGEs and OPN could be used to monitor the severity and progression of osteoporosis. Targeting AGEs may represent a novel therapeutic approach for primary or secondary osteoporosis.
Acknowledgements
Funding: This study was supported by Taichung Armed-Forces General Hospital (grant no: 100-06 and 101-05) and Taipei Medical University (TMU101-AE1-B06).
Ethics committee approval: This study was approved by the institutional ethics committee. All study participants provided written informed consent.
Competing Interests
The authors have declared that no competing interest exists.
References
1. Rachner TD, Khosla S, Hofbauer LC. Osteoporosis: now and the future. Lancet. 2011;377:1276-87
2. Organization WH. Assessment of fracture risk and its application to screening for postmenopausal osteoporosis. WHO, ed. Geneva, Switzerland. 1994
3. Forwood MR, Vashishth D. Translational aspects of bone quality--vertebral fractures, cortical shell, microdamage and glycation: a tribute to Pierre D. Delmas. Osteoporos Int. 2009;20(Suppl 3):S247-53
4. Schleicher ED, Wagner E, Nerlich AG. Increased accumulation of the glycoxidation product N(epsilon)-(carboxymethyl)lysine in human tissues in diabetes and aging. J Clin Invest. 1997;99:457-68
5. Verzijl N, DeGroot J, Oldehinkel E. et al. Age-related accumulation of Maillard reaction products in human articular cartilage collagen. Biochem J. 2000;350(Pt 2):381-7
6. Jakus V, Rietbrock N. Advanced glycation end-products and the progress of diabetic vascular complications. Physiol Res. 2004;53:131-42
7. Wautier JL, Schmidt AM. Protein glycation: a firm link to endothelial cell dysfunction. Circ Res. 2004;95:233-8
8. Singh R, Barden A, Mori T, Beilin L. Advanced glycation end-products: a review. Diabetologia. 2001;44:129-46
9. Grillo MA, Colombatto S. Advanced glycation end-products (AGEs): involvement in aging and in neurodegenerative diseases. Amino Acids. 2008;35:29-36
10. Miyata T, Ishiguro N, Yasuda Y. et al. Increased pentosidine, an advanced glycation end product, in plasma and synovial fluid from patients with rheumatoid arthritis and its relation with inflammatory markers. Biochem Biophys Res Commun. 1998;244:45-9
11. Vytasek R, Sedova L, Vilim V. Increased concentration of two different advanced glycation end-products detected by enzyme immunoassays with new monoclonal antibodies in sera of patients with rheumatoid arthritis. BMC Musculoskelet Disord. 2010;11:83
12. Odetti P, Rossi S, Monacelli F. et al. Advanced glycation end products and bone loss during aging. Ann N Y Acad Sci. 2005;1043:710-7
13. Sanguineti R, Storace D, Monacelli F, Federici A, Odetti P. Pentosidine effects on human osteoblasts in vitro. Ann N Y Acad Sci. 2008;1126:166-72
14. de Paula FJ, Horowitz MC, Rosen CJ. Novel insights into the relationship between diabetes and osteoporosis. Diabetes Metab Res Rev. 2010;26:622-30
15. Wongdee K, Charoenphandhu N. Osteoporosis in diabetes mellitus: Possible cellular and molecular mechanisms. World J Diabetes. 2011;2:41-8
16. Saito M, Fujii K, Mori Y, Marumo K. Role of collagen enzymatic and glycation induced cross-links as a determinant of bone quality in spontaneously diabetic WBN/Kob rats. Osteoporos Int. 2006;17:1514-23
17. Saito M, Marumo K. Collagen cross-links as a determinant of bone quality: a possible explanation for bone fragility in aging, osteoporosis, and diabetes mellitus. Osteoporos Int. 2010;21:195-214
18. Duque G, Huang DC, Macoritto M. et al. Autocrine regulation of interferon gamma in mesenchymal stem cells plays a role in early osteoblastogenesis. Stem Cells. 2009;27:550-8
19. D'Amelio P, Roato I, D'Amico L. et al. Bone and bone marrow pro-osteoclastogenic cytokines are up-regulated in osteoporosis fragility fractures. Osteoporos Int. 2011;22:2869-77
20. D'Amelio P, Isaia GC. Immune System and Postmenopausal Bone Loss. Clinic Rev Bone Miner Metab. 2009;7:262-8
21. Weitzmann MN, Pacifici R. The role of T lymphocytes in bone metabolism. Immunol Rev. 2005;208:154-68
22. Nakashima T, Takayanagi H. Osteoclasts and the immune system. J Bone Miner Metab. 2009;27:519-29
23. Hung LF, Huang KY, Yang DH, Chang DM, Lai JH, Ho LJ. Advanced glycation end products induce T cell apoptosis: Involvement of oxidative stress, caspase and the mitochondrial pathway. Mech Ageing Dev. 2010;131:682-91
24. Lee SK, Kadono Y, Okada F. et al. T lymphocyte-deficient mice lose trabecular bone mass with ovariectomy. J Bone Miner Res. 2006;21:1704-12
25. Yan SF, Ramasamy R, Schmidt AM. Mechanisms of disease: advanced glycation end-products and their receptor in inflammation and diabetes complications. Nat Clin Pract Endocrinol Metab. 2008;4:285-93
26. Hein G, Weiss C, Lehmann G, Niwa T, Stein G, Franke S. Advanced glycation end product modification of bone proteins and bone remodelling: hypothesis and preliminary immunohistochemical findings. Ann Rheum Dis. 2006;65:101-4
27. Miyata T, Notoya K, Yoshida K. et al. Advanced glycation end products enhance osteoclast-induced bone resorption in cultured mouse unfractionated bone cells and in rats implanted subcutaneously with devitalized bone particles. J Am Soc Nephrol. 1997;8:260-70
28. Ji JD, Woo JH, Choi SJ, Lee YH, Song GG. Advanced glycation end-products (AGEs): a novel therapeutic target for osteoporosis in patients with rheumatoid arthritis. Med Hypotheses. 2009;73:201-2
29. Wang KX, Denhardt DT. Osteopontin: role in immune regulation and stress responses. Cytokine Growth Factor Rev. 2008;19:333-45
30. Pedraza CE, Nikolcheva LG, Kaartinen MT, Barralet JE, McKee MD. Osteopontin functions as an opsonin and facilitates phagocytosis by macrophages of hydroxyapatite-coated microspheres: implications for bone wound healing. Bone. 2008;43:708-16
31. Kennedy OD, Brennan O, Rackard SM. et al. Effects of ovariectomy on bone turnover, porosity, and biomechanical properties in ovine compact bone 12 months postsurgery. J Orthop Res. 2009;27:303-9
32. Duque G, Huang DC, Dion N. et al. Interferon-gamma plays a role in bone formation in vivo and rescues osteoporosis in ovariectomized mice. J Bone Miner Res. 2011;26:1472-83
33. Chang IC, Chiang TI, Yeh KT, Lee H, Cheng YW. Increased serum osteopontin is a risk factor for osteoporosis in menopausal women. Osteoporos Int. 2010;21:1401-9
34. Franke S, Siggelkow H, Wolf G, Hein G. Advanced glycation endproducts influence the mRNA expression of RAGE, RANKL and various osteoblastic genes in human osteoblasts. Arch Physiol Biochem. 2007;113:154-61
35. Walker CG, Dangaria S, Ito Y, Luan X, Diekwisch TG. Osteopontin is required for unloading-induced osteoclast recruitment and modulation of RANKL expression during tooth drift-associated bone remodeling, but not for super-eruption. Bone. 2010;47:1020-9
36. Franke S, Ruster C, Pester J, Hofmann G, Oelzner P, Wolf G. Advanced glycation end products affect growth and function of osteoblasts. Clin Exp Rheumatol. 2011;29:650-60
37. Gangoiti MV, Cortizo AM, Arnol V, Felice JI, McCarthy AD. Opposing effects of bisphosphonates and advanced glycation end-products on osteoblastic cells. Eur J Pharmacol. 2008;600:140-7
38. Tang SY, Allen MR, Phipps R, Burr DB, Vashishth D. Changes in non-enzymatic glycation and its association with altered mechanical properties following 1-year treatment with risedronate or alendronate. Osteoporos Int. 2009;20:887-94
Author contact
![]() Corresponding author: Ya-Wen Cheng, Graduate Institute of Cancer Biology and Drug Discovery, Taipei Medical University, 12F., No.3, Bade Rd., Nangang Dist., Taipei 115, Taiwan. Telephone: 886-2-27361661 ext.7615; Fax: 886-2-66387527; e-mail: deng6263hinet.net; ywcedu.tw.
Corresponding author: Ya-Wen Cheng, Graduate Institute of Cancer Biology and Drug Discovery, Taipei Medical University, 12F., No.3, Bade Rd., Nangang Dist., Taipei 115, Taiwan. Telephone: 886-2-27361661 ext.7615; Fax: 886-2-66387527; e-mail: deng6263hinet.net; ywcedu.tw.