Impact Factor ISSN: 1449-1907

 Global reach, higher impact
Int J Med Sci 2014; 11(4):391-403. doi:10.7150/ijms.7697 This issue Cite
Research Paper
Different Isolation Methods Alter the Gene Expression Profiling of Adipose Derived Stem Cells
Nareshwaran Gnanasegaran1, Vijayendran Govindasamy2 ![]() , Sabri Musa1,3, Noor Hayaty Abu Kasim1,4
, Sabri Musa1,3, Noor Hayaty Abu Kasim1,4 ![]()
1. Regenerative Dentistry Research Group (ReDReG), Faculty of Dentistry, University of Malaya, Kuala Lumpur, Malaysia
2. Hygieia Innovation Sdn. Bhd, Lot 1G-2G, Lanai Complex No.2, Persiaran Seri Perdana, Persint 10, Federal Territory of Putrajaya, Malaysia
3. Department of Children's Dentistry and Orthodontics, Faculty of Dentistry, University of Malaya, Kuala Lumpur, Malaysia
4. Department of Restorative Dentistry, Faculty of Dentistry, University of Malaya, Kuala Lumpur, Malaysia.
Received 2013-9-18; Accepted 2014-1-20; Published 2014-3-6
Abstract
Human adipose stem cells (ASCs) has been in the limelight since its discovery as a suitable source of mesenchymal stem cells (MSCs) in regenerative medicine. Currently, two major techniques are used to isolate ASCs, namely liposuction and tissue biopsy. These two methods are relatively risk-free but the question as to which method could give a more efficient output remains unclear. Thus, this study was carried out to compare and contrast the output generated in regards to growth kinetics, differentiation capabilities in vitro, and gene expression profiling. It was found that ASCs from both isolation methods were comparable in terms of growth kinetics and tri-lineage differentiation. Furthermore, ASCs from both populations were reported as CD44+, CD73+, CD90+, CD166+, CD34-, CD45- and HLA-DR-. However, in regards to gene expression, a group of overlapping genes as well as distinct genes were observed. Distinct gene expressions indicated that ASCs (liposuction) has endoderm lineage propensity whereas ASCs (biopsy) has a tendency towards mesoderm/ectoderm lineage. This information suggests involvement in different functional activity in accordance to isolation method. In conclusion, future studies to better understand these gene functions should be carried out in order to contribute in the applicability of each respective cells in regenerative therapy.
Keywords: mesenchymal, liposuction, biopsy, TLDA, Ingenuity Pathway Analysis.
Introduction
It is a known fact that stem cells (SCs) research and its application have revolutionized regenerative medicine [1]. Bone marrow (BM) mesenchymal stem cells (MSCs) was the first source of stem cells to be discovered in adults and it is the most frequently studied, making it a golden standard in the field of regenerative medicine [2]. These cells have the potential to form adipogenic, osteogenic, chondrogenic, myogenic and neurogenic cells both in vitro and in vivo [3]. Despite this, harvesting BM-MSCs from BM by aspiration technique is a tedious and painful method. Surprisingly, identification of MSCs with similar characteristics to BM-MSCs have been found in other human tissues [4].
Among these, SCs from adipose tissue can be considered as one of the potential alternative source [5]. This is mainly because of their abundant cell source for wider therapeutic applicability. Many studies have proven that adipose derived stem cells (ASCs) could easily expand under in vitro condition, and is able to differentiate into adipogenic, osteogenic, chondrogenic, neurogenic and myogenic cells [6]. Moreover, ASCs have the ability to secrete adipokines (leptin and adiponectin) which plays a fundamental role in metabolism regulation and physiological homeostasis [7].
Clinical studies that were conducted previously have shown the applicability of ASCs in different areas of study. For example, treatment using ASCs showed better recovery in a facial lipoatrophy study as the tissue absorbance was faster compared to a non-treated control group [8]. In wound healing therapy, ASCs (liposuction) was employed on patients with radiation wounds. An improvement in healing of tissue wound was observed, and the authors postulated that the lipoaspirate was rich in native ASCs that contributed to the effect [9]. There were also cases where allogeneic ASCs (liposuction) were implemented in the treatment of hematologic and immunologic disorders like graft versus-host disease, idiopathic thrombocytopenic purpura, or pure red cell aplasia [10]. It was reported in all cases that there were significant improvements and no adverse effects were observed.
Despite this, studies have revealed that ASCs are of heterogeneous population [11] and presents variations in terms of proliferative capacity, population doubling time and morphology [12]. Variation was also reported in ASCs isolated from different body regions [13]. For example, ASCs from subcutaneous adipose tissue region have shown higher proliferation rate than those from the omental region [14]. Age and body mass index (BMI) also play an important role in cell yield and growth of ASCs [15].
Recently, it was found that the mode of harvesting influences the potentiality of ASCs, [16] and for now the body of information is focused on the yield and little knowledge is available beyond this. We have previously reported that gene expression and growth factor profile echoes the source of tissue from where the stem cells are collected, and it indicates heterogeneity of stem cell as biologically relevant [17].
Hence, we speculate that the mode of harvesting might influence gene profiling, which ultimately determines the biological functions of the cells in ex vivo microenviroenment. Thus, the present study was undertaken to examine gene expression and occurrence of unusual shift in gene expression when adipose tissues are harvested using two different methods.
Materials and Methods
Donors
Human subcutaneous adipose tissue and lipoaspirate samples were obtained via biopsy (lipectomy) and liposuction aspirates, respectively, from the same male subjects (n=5; age range: 35-50 years). BM-MSC cultures were established from donors (n=5; age range: 18-35 years). Tissues were harvested under general anesthesia by an experienced surgeon. All donors were non-smokers and free from HIV and HBV. Verbal and written informed consent were obtained from all patients prior to enrollment in the study and all procedures have been approved by the Medical Ethics Committee, University of Malaya (Medical Ethics Clearance Number DF CO1107/0066[L]).
Isolation and expansion of cells
BM-MSC cultures were established as previously described [18]. Briefly, 60 mL of BM were aspirated aseptically from the iliac crest of each patient under deep sedation. The BM was diluted (1:1) with knockout Dulbecco's modified Eagle's medium (KO-DMEM; Invitrogen, Carlsbad, CA, USA; www.invitrogen.com) and centrifuged at 1800 rpm for 10 minutes to remove anticoagulants. The supernatant was discarded and washed once with culture medium. Mononuclear cells (MNCs) were isolated by layering onto a lymphoprep density gradient (1:2; Axis-Shield PoCAS). The MNCs present in the buffer coat were washed again with culture medium. The mononuclear fractions that also contained MSCs were plated onto culture flasks.
The subcutaneous adipose tissues were isolated as previously described [18]. Briefly, after the weight of the adipose tissue was determined, it was extensively washed with Dulbecco phosphate-buffered saline (DPBS; Invitrogen) containing 200 Units/ ML and 200 µg/mL of penicillin/streptomycin (Invitrogen) to remove contaminants such as blood cells. The tissues were then minced carefully for 10 minutes with fine scissors until 1-mm3 pieces. The fibrous structures and visible blood vessels were removed and the extracellular matrix was enzymatically digested at 37°C for 30 minutes with 0.5% collagenase Type I (Invitrogen). This was followed by inactivation of the collagenase activity with an equal volume of KO-DMEM (Invitrogen)/10% fetal bovine serum (FBS; Hyclone; Thermo Fisher Scientific Inc, Waltham, MA). The digested adipose tissue was centrifuged at 1500 rpm for 5 minutes to obtain a cell pellet. The pellet was re-suspended and filtered through a 100-um mesh filter (BD Pharmingen, San Diego CA, USA; http://www.bdbiosciences.com) to remove debris. The suspending portion containing lipid droplets was discarded, and the cell pellet was re-suspended and washed twice. Contaminating erythrocytes were lysed with red blood lysis buffer (Sigma Aldrich), and the remaining cells were transferred onto plates.
Lipoaspirates were harvested and cultured following the protocols as described before [19]. In brief, ASCs obtained using liposuction were washed extensively with sterile DPBS (Invitrogen) to remove contaminating debris and red blood cells. After washing, the aspirate samples were treated with 0.075% collagenase Type I (Invitrogen) in DPBS (Invitrogen) for 60 minutes at 37oC with gentle agitation. This was followed by inactivation of the collagenase activity with an equal volume of DMEM-KO (Invitrogen)/10% fetal bovine serum (FBS; Hyclone). Centrifugation was carried out at 600 rpm for 10 minutes and the cell pellets were re-suspended and washed twice. It was then filtrated through a 100-um mesh filter (BD Pharmingen) to remove the debris and the remaining cells were transferred onto tissue culture plates.
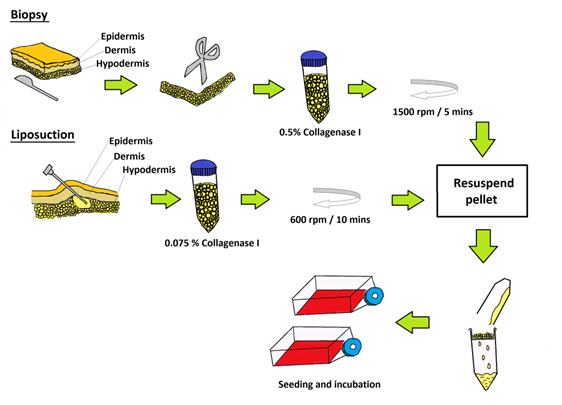
ASCs obtained using biopsy and liposuction were cultured in identical culture condition videlicet; in T75 cm2 culture flasks (BD Pharmingen) with culture medium containing KO-DMEM, 0.5% and 10000 µg/mL of penicillin/ streptomycin (Invitrogen); 1% 1X Glutamax (Invitrogen) and 10% FBS (Hyclone) with humidified atmosphere of 95% of air and 5% of CO2 at 37°C with a cell seeding density of 1000 cell/cm2. Non-adherent cells were removed 48 h after initial plating. The medium was replaced every three days until the cells reached 80-90% confluency. A summary on the isolation and seeding of ASCs from both methods is illustrated in Figure 1.
Schematic representation of the isolation methods employed to obtain ASCs (biopsy) and ASCs (liposuction) as previously described. Both ASCs were treated with collagenase before filtering via cell strainer and seeded in tissue culture flasks.
Growth Kinetics
A total of 1000 cell/cm2 of BM-MSCS and ASCs obtained from biopsy and liposuction were cultured in T-25 flasks (BD Pharmingen, San Diego, CA) to determine the proliferation rate. Each passage and time point had three replicates. Once the cell reached 90% confluency, the cells were detached by trypsinization. Next, the total cell number of BM-MSCS and ASCs in each passage was counted and assessed for viability by means of trypan blue dye exclusion. Cells were re-plated for subsequent passages with initial seeding of 5000 cell/cm2 in T-25-flasks, and a total of 5 passages were studied in this experiment. Growth kinetics was analyzed by calculating population doubling (PD) time using the formula: TD=tlg2/ (lgNH-lgNI), where NI represents the inoculum cell number; NH the cell harvest number and t the duration of the culture (in hours).
Cell Cycle Analysis
Cells were seeded at 5000 cells/cm2 on a 35-mm tissue culture dish (BD Pharmingen) and cultured until 90% confluency. The cells were then detached, fixed, and permeabilized in 70% ethanol overnight in the dark at 4 °C. After that, the cells were treated with RNase A (1 mg/ml final concentration), and stained with propidium iodide (PI, Roche, 50 μg/ml final concentration). DNA content was analyzed on Guava Technologies (Millipore, Billerica, MA) flow cytometer using Cyto- soft, Version 5.2, Guava Technologies software.
Senescence associated β-galactosidase (SA-β-gal) Assay
The senescence-associated β-galactosidase (SA-β-gal) assay was carried out using senescence β-galactosidase staining kit (Cell Signaling Technology, Danvers, MA, USA, http://www.cellsignal.com) according to the manufacturer's instructions. Cells were cultured in a 35-mm plate and allowed to attach in growth medium until it reached 80% confluency. Cells were then washed twice with DPBS - Ca2+, - Mg2+ (Invitrogen), fixed and stained using one mL staining solution in citrate buffer (pH 6.0) overnight at 37°C. The developments of blue coloured cells were observed under a phase-contrast microscope using 20X magnifications. Five random fields were taken from each of the three replicate samples of ASCs (liposuction) and ASCs (biopsy) as well as BM-MSCs. The SA-β-gal assay was calculated using the following formula:
SA-β-gal= (number of senescence cells / total number of cell) X 100%
FACS analysis
The immunophenotyping characterization of the cells were done using flow cytometry at sub-culture 5. After reaching 90% confluency, the cells were trypsinized with 0.05% trypsin (Invitrogen) and re-suspended in DPBS (Invitrogen) at a cell density of 1.5×10⁶ cells/mL. A total of 200 µL of the cell suspension (1 x 10⁵ cells) was incubated with labeled antibodies in the dark for one hour at 37°C. The following antibodies were used: CD90-phycoerythrin (PE), CD44-PE, CD73-PE, CD166-PE and CD34-PE, CD45-Fluorescein-isothyocyanate (FITC) and HLA-DR-FITC. FITC- or PE-labeled isotype-matched immunoglobulins were used as negative controls. The stained cells were analyzed using Guava Technologies flow cytometer and the results were analyzed using Cytosoft, Version 5.2, Guava Technologies. All antibodies were purchased from BD Pharmingen.
Differentiation
The cultures were initiated at a density of 1000 cells/cm2 in six-well plates using growth medium until confluency, and then subjected to differentiation into adipogenic, osteogenic, and chondrogenic lineages.
In order to induce adipogenic differentiation, cells were stimulated with KO-DMEM (Invitrogen), 10% FBS (Hyclone), 1% Glutamax (Invitrogen), 1 µM dexamethasone sodium phosphate (Sigma Aldrich), 10 µg/ml insulin (Sigma Aldrich), 200 µM indomethacin (Sigma Aldrich) and 0.5 mM 3-isobutyl-1-methylxanthine (Sigma Aldrich) for 21 days. Medium was changed three times per week. Lipid droplets were visualized by staining with Oil Red O staining (Sigma Aldrich).
Osteogenic differentiation was induced via conditioned-media containing KO-DMEM (Invitrogen), 10% FBS (Hyclone), 1% Glutamax (Invitrogen), 0.1µM dexamethasone sodium phosphate (Sigma Aldrich), 0.2 mM L-ascorbic 2 phosphate (Sigma Aldrich) and 10 mM β-glycero-2-phosphate (Sigma Aldrich) for the next 21 days. The induction media was changed twice a week. Von Kossa staining was performed to evaluate calcium accumulation.
Cells were stimulated into chondrogenic differentiation with KO-DMEM (Invitrogen), 6.25 μg/mL insulin (Sigma Aldrich), 6.25μg/mL transferrin (Sigma Aldrich), 6.25 μg/mL selenous acid (Sigma Aldrich), 5.35 μg/mL linoleic acid (Sigma Aldrich), 1.25 μg/mL bovine serum albumin (Sigma Aldrich), 1 mM Pyruvate (Sigma Aldrich) 37.5 μg/mL Ascorbic acid (Sigma Aldrich), 10-7 M dexamethasone (Sigma Aldrich) for the next 21 days. The induction media was changed twice a week. The formation of chondrocytes was visualized by Alcian Blue (Sigma Aldrich) staining.
Colony Forming Unit (CFU) Assay
The colony forming unit (CFU) assay was determined by re-plating 100 cells in a 35-mm dish (BD Bioscience), followed by 14 days of culturing at 37°C with 5% CO2 . Then, the cells were rinsed from growth media twice using DPBS -Ca2+, -Mg2+ (Invitrogen) and fixed with 100% methanol (Mallindkrodt, Hazelwood, USA, http://pharmaceuticals.covidien.com) for 20 minutes at room temperature, followed by 3% crystal violet (Sigma Aldrich) staining. Next, the blue stain was rinsed out using tap water for four times until the dishes became colourless. The dishes were then inverted downwards on a clean cloth, and allowed to air-dry for several minutes. Stained colonies with sizes larger than 2 mm were counted. The CFU of ACSs was then calculated using the formula;
CFU = (the total number of colonies stained / the initial number of cells) X 100%.
Gene profiling
The expression of a focused panel of pluripotent and early lineage stem cell markers were analyzed using the Human Taqman Low Density Array (TLDA) (Applied Biosystems, USA; www.appliedbiosystems.com) which contains a well-defined set of validated gene expression markers. The fluorogenic probes and primers (Applied Bioystems) were preloaded in the 384 wells of each TLDA card. Total RNA was extracted using Trizol (Invitrogen) according to the manufacturer's instructions and was stored at -80 °C. The RNA was subjected to DNase I treatment (Ambion) to eliminate any traces of contaminating DNA. A total RNA of 1µg was then reverse-transcribed into cDNA by using Superscript II reverse transcriptase (Invitrogen) after treatment with RNase- OUT ribonuclease inhibitor according to the manufacturer's instructions. cDNAs were loaded on to the microfluidic cards for thermal cycling on an ABI PRISM 7900HT Sequence Detection System (Applied Biosystems). Expression values for target genes were normalized to the expression of 18s rRNA. Transcriptional analysis was performed for ASCs (biopsy and liposuction) and BM-MSCs. For data analysis, The ABI PRISM 7900HT sequence detection system software (SDS) were used to calculate the levels of target ASC (liposuctions and biopsy) gene expression in samples relative to the level of expression in the calibrator (BM-MSCs) with comparative CT Method (ΔΔCT). A cutoff cycle threshold (Ct) value of 35.0 was arbitrarily assigned for estimation of the fold change, such that a Ct value above 35 was considered to be undetected.
Confirmation of Differentiation Assay and Array using Reverse Transcriptase (RT)-Polymerase Chain Reaction (PCR) and Real time PCR (qPCR)
PCR was performed in 0.2 mL Eppendorf tubes (Axygen) with a final volume of 12.5 μL. cDNA amplification was performed in a thermocycler using Taq polymerase supplied with KCl buffer and 1.5mM MgCl2 (Invitrogen) at 94°C for 1 min, 58°C for 30 s and 72°C for 1 min. PCR products were resolved on 1.5% agarose (Invitrogen) gel run in 1x Tris borate-EDTA buffer. The expression of the genes were also quantified in duplicates, using SYBR Green Master Mix (Applied Biosystems). PCR reactions were run on an ABI 7900HT RT-PCR system (Applied Biosystems) and the SDS v 2.1 software was used to analyze the results. Gene expression were analyzed via comparative CT Method (ΔΔCT) and were normalized to 18s rRNA. The primer sequences are listed in Table 1.
List of genes with primer sequence and the product size
| Gene name | Forward | Reverse | Base pair |
|---|---|---|---|
| SOX17 | GTACGCTGTAGACCAGACCG | CTCGCCCTTCACCTTCATGT | 314 |
| ISL1 | AGCCCTAATCCTCTCCCGCT | TTGCCGCAACCAACACATAG | 512 |
| AFP | AGAACCTGTCACAAGCTGTG | GACAGCAAGCTGAGGATGTC | 675 |
| POU5F1 | CGACCATCTGCCGCTTTGAG | CCCCCTGTCCCCCATTCCTA | 572 |
| OLIG2 | GGAAAGATGAGTCGGTGGGG | GGAAAGATGAGTCGGTGGGG | 311 |
| T (brachury) | CAGAATAGGATTGGGAGTACCCAG | CAGAATAGGATTGGGAGTACCCAG | 298 |
| NANOG | CCTCCTCCATGGATCTGCTTATTCA | TCGGCGCCGGGGAGATACAT | 259 |
| RUNX2 | GTCACTGTGCTGAAGAGGCT | GTCACTGTGCTGAAGAGGCT | 119 |
| HNF-3 Beta | GACAAGTGAGAGAGCAAGTG | ACAGTAGTGGAAACCGGAG | 234 |
| LAMA1 | AGTTCGAACGCTCTGCTGAA | AGTTCGAACGCTCTGCTGAA | 297 |
| RUNX2 | CACTGGCGCTGCAACAAGA | CATTCCGGAGCTCAGCAGAATAA | 127 |
| OSTEOCALCIN | CAGAGGTGCAGCCTTTGTGTC | TCACAGTCCGGATTGAGCTCA | 150 |
| PPARγ2 | ACAGCAAACCCCTATTCCATGCTGT | TCCCAAAGTTGGTGGGCCAGAA | 159 |
| LPL | TGGACTGGCTGTCACGGGCT | GCCAGCAGCATGGGCTCCAA | 167 |
| AGGRECAN | AGGGCGAGTGGAATGATGTT | GGTGGCTGTGCCCTTTTTAC | 68 |
| COLLAGEN 2A1 | CTGCAAAATAAAATCTCGGTGTTCT | GGGCATTTGACTCACACCAGT | 101 |
Ingenuity Pathway Analysis (IPA)
The ''Core Analysis' function included in IPA (Ingenuity® Systems Inc., California, USA; http://www.ingenuity.com) [20] was used to interpret the data in the context of biological processes, pathways and networks. The genes that were selected for analysis were of RQ value > 2.0 as compared to BM-MSC. After the analysis, generated networks are ordered by a significance score. On the other side, significance of the biological functions and the canonical pathways were tested by the right-tailed p-value from the Fisher Exact test. Selected networks were then converted to form pathways via Path Designer to show relationships between genes or proteins.
Statistical methods
Data are presented as mean ± standard deviation. The descriptive statistical tests were performed using the SPSS software for Windows (version 11.0, SPSS Predictive Analytics, Chicago, IL and http://www.spss.com). Homogeneity of variance and normality were also tested. The data were analyzed using two-way analysis of variance. Tukey's post hoc multiple comparison tests were carried out to determine the differences between groups. The significance level was set at p=0.05.
Results
Basic characterizations of BM-MSCs, ASCs (liposuction) and ASCs (biopsy)
ASCs from both liposuction and biopsy technique showed a spindle and elongated morphology resembling fibroblastic appearance of BM-MSCs (Fig. 2A). Stromal vascular fraction (SVF) count obtained from both methods revealed insignificant difference with an average of 171500 for ASCs (biopsy) and 197400 for ASCs (liposuction) (Fig. 2B). Steady increments in cell number were seen in BM-MSCs, being the highest (a five-fold increase in cell number from sub-culture SC-1: 2.6±0.62 to SC-5: 10±1.2; p<0.05), followed by ASCs obtained through liposuction (a five-fold increase in cell number from SC-1:0.91±0.25 to SC-5: 4.4±0.72; p<0.05) and ASCs from biopsy (a three-fold increment in cell number from SC-1 2.5±0.5 to SC-5: 7.15±1; p<0.05) (Fig. 2C-2D). Nevertheless, there was no significant increment in terms of cell number between BM-MSC and ASCs (liposuction). However, a significant increment was observed between BM-MSCs, ASCs (biopsy) and ASCs (liposuction). Further, average cumulative PD time for BM-MSCs was 2.25±0.36, ASCs (liposuction) was 2.7±0.49 and ASCs (biopsy) was 3.05±0.35.
Basic characterisations of ASCs. (A) Morphological features of BM-MSCs, ASCs (liposuction) and ASCs (biopsy) at 10X magnification, via phase contrast microscope; (B) SVF count for both ASCs (n=5); (C) and (D) Cell count and Cumulative Population Doubling (CPD), for ASCs (liposuction) and ASCs (biopsy), against BM-MSCs as control (* indicates p-value < 0.05); (E) Senescence assay to evaluate the activity of β-galactosidase in cells of BM-MSCs, ASCs (liposuction), and ASCs (biopsy); and (F) Cell cycle analysis describing the DNA content in cells from BM-MSCs, ASCs (liposuction) and ASCs (biopsy). Bar = 100 µm.
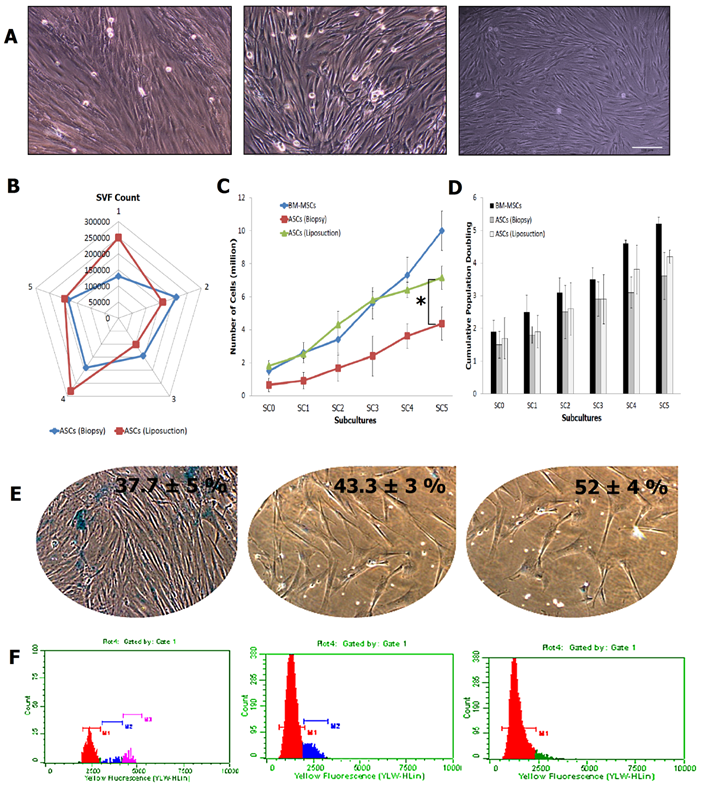
The senescence assay as shown in Figure 2E describes the activity of β-galactosidase due to cell ageing. BM-MSCs has the lowest activity for the β-galactosidase assay at 35 ± 6%, followed by ASCs (liposuction) with 42 ± 2% and ASCs (biopsy) with 50 ± 2%. This was further revealed in the cell cycle analysis whereby as shown in Figure 2F, BM-MSCs were actively proliferating (S2 + G2 + M = 12.2 % ± 1.43; G1/G0: 89%) followed by ASCs (liposuction) (S2 + G2 + M = 7.8 % ± 1.43; G1/G0: 91%) and ASCs (biopsy) (S2 + G2 + M = 5 % ± 1.43; G1/G0: 95%). In addition, the colony-forming unit assay (Fig. 3A) revealed ASCs (biopsy) to be slightly better than that of ASCs (liposuction). Immunophenotyping analysis further described surface marker expression level between all cell lines as depicted in Fig 3B. All cell lines were positive (>85%) for CD44, CD73, CD90, and CD166 markers but negative (<2%) for CD45 and HLA-DR. CD34 marker however has shown a slightly higher percentage (~5%) and this could be due to contamination of hematopoietic cells as well as perivascular stem cells during the analysis. Subsequently, both ASCs from liposuction and biopsy have shown good response towards the trillineage differentiation. Lipid accumulations were relatively higher in BM-MSCs, followed by ASCs (liposuction) and ASCs (biopsy). However, in osteogenic differentiation, ASCs (liposuction) presented more calcium deposits, followed by BM-MSCs and ASCs (biopsy). A similar pattern was also seen in chondrogenesis whereby ASCs (liposuction) were shown to have more proteoglycan formation, followed by BM-MSCs and ASCs (biopsy), as depicted in Figure 3C.
Immunophenotyping and trillineage differentiation. (A) Colony-forming unit (CFU) of both ASCs (liposuction) and ASCs (biopsy). Pictures represent triplicates taken at 4x magnification. (B) Fluorescence-activated cell sorting (FACS) analysis describing presence or absence of cell surface markers in both ASCs, with BM-MSCs as control. Cells were tested against human antigens CD34, CD44, CD45, CD73, CD90, CD166, and HLA-DR. 7-Amino-actinomycin D (7-AAD) was used to check for cell viability. CD, cluster of differentiations. (C) Mesoderm differential potentiality of ASCs in vitro. Adipogenesis was detected by neutral oil droplet formation stained with Oil red O at day 21 in ASCs (liposuction) and ASCs (biopsy). Osteogenesis was confirmed by mineralized matrix deposition stained with von Kossa staining at day 21 in ASCs (liposuction) and ASCs (biopsy). Chondrogenesis was detected by the presence of proteoglycans stained with Alcian blue at day 21 in ASCs (liposuction) and ASCs (biopsy). All experiments were conducted at sub-culture 4. Results represent average of 5 culture replicates. Bar = 100 µm. (D) The gene expression profile for mesoderm differentiation capacity using real-time as well as reverse-transcription PCR (* indicates p-value < 0.05).
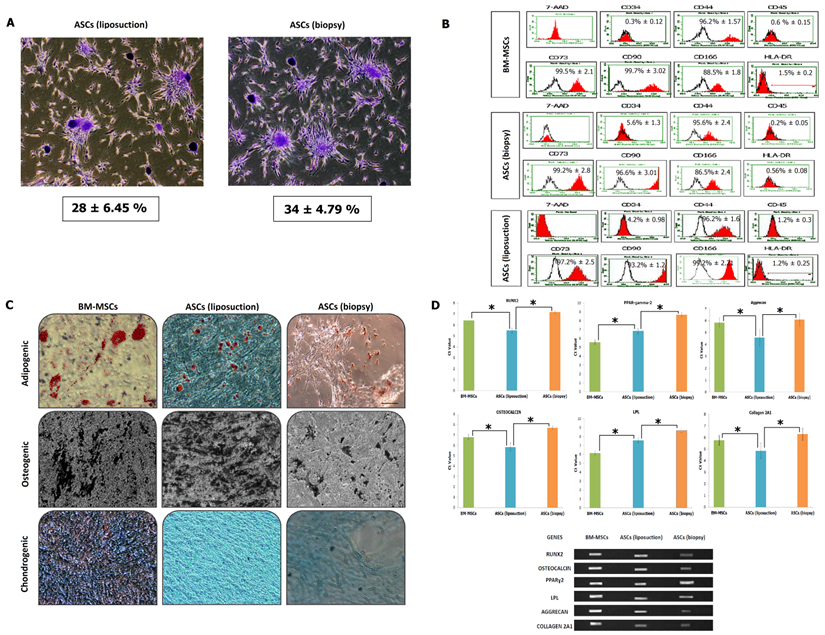
Further validation was carried out by means of gene expression study of both reverse-transcription and real-time PCR to detect as well as quantify the presence of related genes to mesodermal differentiation, namely Runx2, Osteoclacin, PPAR-gamma-2, LPL, Aggrecan and Collagen 2A1. In general, ASCs (liposuction) had a lower Ct value compared to ASCs (biopsy).
Gene clustering based on expression profile
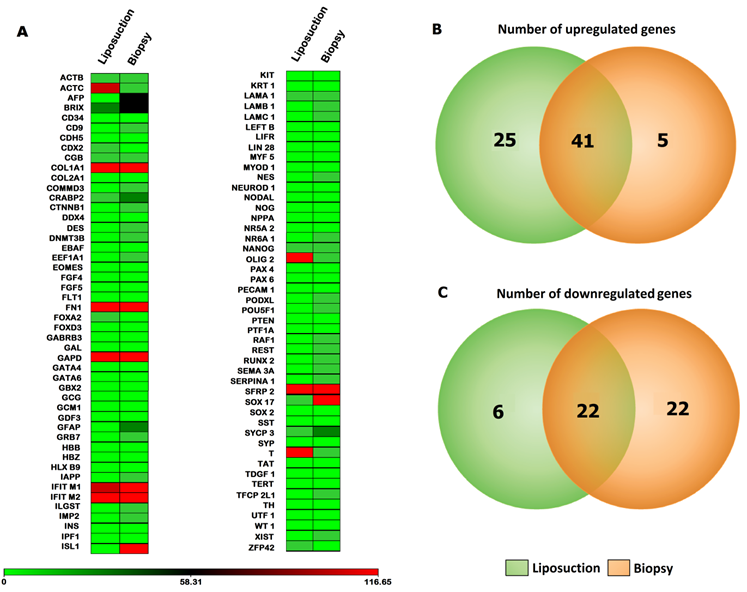
In order to visualize the global gene expression patterns exhibited by all three-cell lines, a heat map analysis was performed independently for the Taqman Low Density Array (TLDA). For TLDA array, increasing (black) and decreasing (green) gene expression over time were evident, while a number of genes also appeared relatively unchanged compared to BM-MSCs. In this array, 18.5% of the molecules (71 genes) increased in ASCs compared to BM-MSCs, while 13% (50 genes) were consistently decreased in BM-MSCs. The remaining 68.5% (263 genes) exhibited nominal changes roughly equivalent to baseline value of BM-MSCs. Among the up-regulated genes, 10.67% (41 genes) were common to both ASCs (liposuction) and ASCs (biopsy), 6.5% (25 genes) were only present in ASCs (liposuction) and only 1.3% (5 genes) were unique to ASCs (biopsy). On the contrary, out of 50 down-regulated genes, 5.7% (22 genes) were common to both groups whereas 1.6% (6 genes) and 5.7% (22 genes) were unique to ASCs (liposuction) and ASCs (biopsy), respectively (Fig. 4A-4C).
Diagram summarizing gene expression patterns of ASCs (liposuction) and ASCs (biopsy). (A) Heat map defining gene expressions via Taqman® Low Density Array (TLDA) of both ASCs (liposuction) and ASCs (biopsy) with BM-MSCs as control. The gene expression fold change from both sources with BM-MSCs as control is depicted from lowest (in green) to highest (in red). (B) and (C) Venn diagram describing number of up-regulated as well as down-regulated genes with BM-MSCs as control.
Pathway Analysis
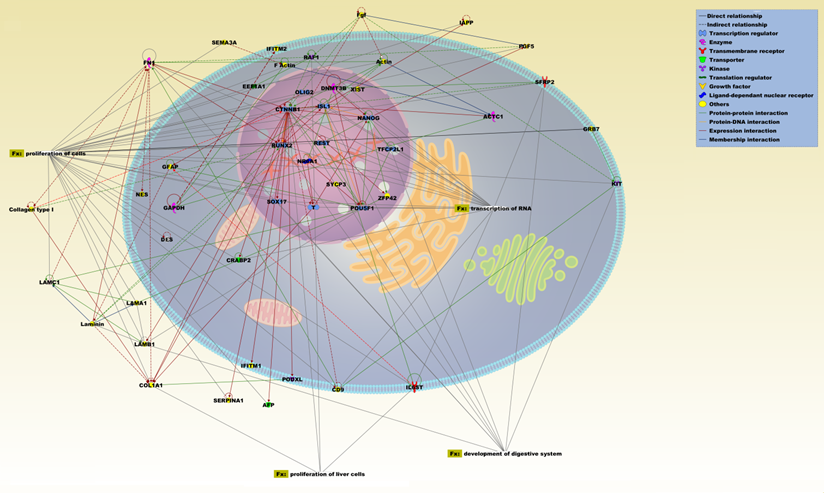
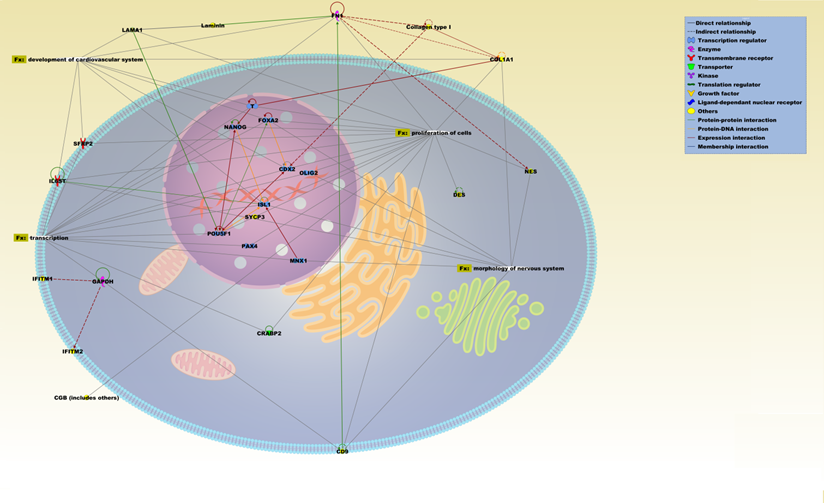
Network analysis was performed using only the genes that were up-regulated in both ASCs from liposuction and biopsy and which exhibited more than two-fold expression changes compared to BM-MSCs. Using the IPA database, a total of four significant biofunctions were seen, namely proliferation of cells (p value: 7.31E-13), transcription of RNA (4.97E-8), development of digestive system (3.46E-7) and proliferation of liver cells (4.32E-5). Across this network, several genes exhibited a pivotal role and connected all the networks. This includes genes such as CTNNB1, POU5F1, DNMT3B, RUNX2, Nanog, and NR6A1 which are related to stemness/pluripotency [32]. Besides that, the presence of a few endoderm related genes such as SOX17, ISL1, and AFP were also observed. Similarly, network analysis on up-regulated genes from ASCs (biopsy) revealed a total of four significant functions namely transcription (7.23E-16), proliferation of cells (1.36E-14), morphology of nervous system (1.39E-11), and development of cardiovascular system (1.73E-14). A number of key genes significantly related to mesodermal/ectodermal lineage were highlighted during the analyses which includes OLIG2, FOXA2, MNX1, CDX2, and LAMA1.
IPA pathway representation of the molecular relationships among differentially expressed genes and proteins of ASCs (liposuction). The network is displayed graphically as nodes (proteins) and edges (the biological relationships between the nodes). Various shapes of the nodes represent the functional class of the proteins. Edges are displayed with various labels that describe the nature of the relationship between the nodes. Names of proteins corresponding to the abbreviations are as follows: ACTC1, actin, alpha, cardiac muscle 1; ACTIN; AFP, alpha-fetoprotein; CD9, CD9 molecule; COL1A1, collagen, type I, alpha 1; Collagen type 1; CRABP2, cellular retinoic acid binding protein 2; CTNNB1, catenin (cadherin-associated protein), beta 1, 88kDa; DES, desmin; DNMT3B, DNA (cytosine-5-)-methyltransferase 3 beta; EEF1A1, eukaryotic translation elongation factor 1 alpha 1; F Actin; FGF, fibroblast growth factor; FN1, fibronectin 1; GAPDH, glyceraldehyde-3-phosphate dehydrogenase; GFAP, glial fibrillary acidic protein; GRB7, growth factor receptor-bound protein 7; IAPP, islet amyloid polypeptide; IFITM1, interferon induced transmembrane protein 1; IFITM2, interferon induced transmembrane protein 2; IL6ST, interleukin 6 signal transducer (gp130, oncostatin M receptor); ISL1, ISL LIM homeobox 1; KIT, v-kit Hardy-Zuckerman 4 feline sarcoma viral oncogene homolog; LAMA1, laminin, alpha 1; LAMB1, laminin, beta 1; LAMC1, laminin, gamma 1; Laminin; NANOG, Nanog homeobox; NES, nestin; NR6A1, nuclear receptor subfamily 6, group A, member 1; OLIG2, oligodendrocyte lineage transcription factor 2; PGF5, placental growth factor; PODXL, podocalyxin-like; POU5F1, POU class 5 homeobox 1; RAF1, v-raf-1 murine leukemia viral oncogene homolog 1; REST, RE1-silencing transcription factor; RUNX2, runt-related transcription factor 2; SEMA3A, sema domain, immunoglobulin domain (Ig), short basic domain, secreted, (semaphorin) 3A; SERPINA1, serpin peptidase inhibitor, clade A (alpha-1 antiproteinase, antitrypsin), member 1; SFRP2, secreted frizzled-related protein 2; SOX17, SRY (sex determining region Y)-box 17; SYCP3, synaptonemal complex protein 3; T, brachyury homolog; TFCP2L1, transcription factor CP2-like 1; XIST, X (inactive)-specific transcript (non-protein coding); ZFP42, zinc finger protein 42 homolog.
Confirmation of array analysis
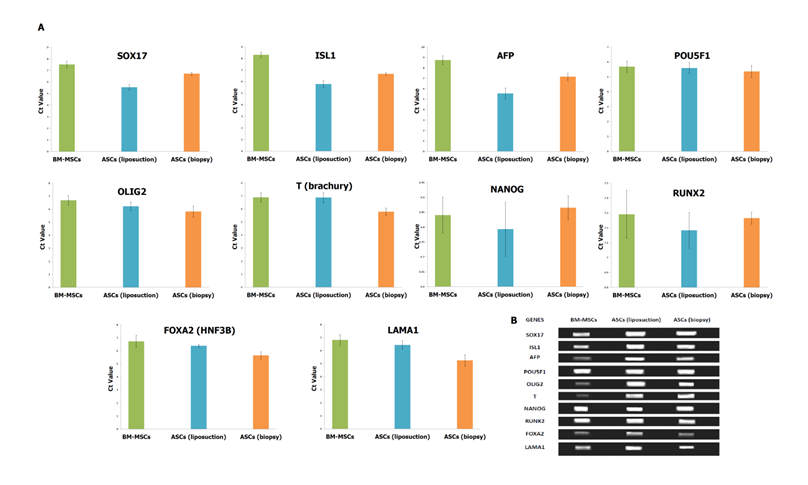
Pluripotent markers such as POU5F1, NANOG and RUNX2 were shown to be comparable across all the cell lines. The Ct value of POU5F1 (OCT4) was 5.684±0.32, 5.591±0.362 and 5.358±0.4 for BM-MSCs, ASCs (liposuction) and ASCs (biopsy), respectively. In addition, the Ct value for NANOG was reported as 6.84±0.06, 6.793±0.09, and 6.865±0.04, for BM-MSCs, ASCs (liposuction) and ASCs (biopsy), respectively. The RUNX2 gene on the other hand was shown to express Ct value of 7.291±0.16 (BM-MSCs), 7.183±0.12 (ASCs [liposuction]), and 7.265±0.04 (ASCs [biopsy]). Furthermore, the mesoderm marker FOXA2 was reported as 6.721±0.46, 6.383±0.12, and 5.651±0.27 for BM-MSCs, ASCs (liposuction) and ASCs (biopsy), respectively. Endoderm markers like SOX17, ISL1, and AFP have shown similar patterns whereby ASCs (liposuction) were highly expressed, followed by ASCs (biopsy) and BM-MSCs. For example, expression of SOX17 for ASCs (liposuction), ASCs (biopsy) and BM-MSCs were at 5.483±0.239, 6.7168±0.1448 and 7.508±0.2711, respectively. Gene ISL1 was in the range of 5.783±0.32 for ASCs (liposuction), 6.668±0.13 for ASCs (biopsy) and 8.314±0.23 for BM-MSCs. Likewise, Ct values for the AFP gene were 5.539±0.53 for BM-MSCs, 7.158±0.34 for ASCs (liposuction), and 8.748±0.41 ASCs (biopsy), respectively. In contrast, ectodermal markers such as OLIG2, T, and LAMA1 were seen to be highly expressed in ASCs (biopsy) followed by ASCs (liposuction) and BM-MSCs. Ct value for OLIG2 was reported as 5.815±0.42 (ASCs [biopsy]), 6.218±0.32 (ASCs [liposuction]) and 6.684±0.37 (BM-MSCs). Gene T was seen to express Ct value of 5.795±0.28 for ASCs (biopsy), 6.873±0.39 for ASCs (liposuction) and 6.894±0.35 for BM-MSCs. The Ct value for LAMA1 was reported as 5.2519±0.44 (ASCs [biopsy]), 6.439±0.32 (ASCs [liposuction]), and 6.816±0.43 (BM-MSCs), respectively.
IPA pathway representation of molecular relationships among differentially expressed genes and proteins of ASCs (biopsy). The network is displayed graphically as nodes (proteins) and edges (the biological relationships between the nodes). Various shapes of the nodes represent the functional class of the proteins. Edges are displayed with various labels that describe the nature of the relationship between the nodes. Names of proteins corresponding to the abbreviations are as follows: CD9, CD9 molecule; CDX2, caudal-related homeobox 2; CGB, chorionic gonadotropin, beta polypeptide; COL1A1, collagen, type I, alpha 1; COLLAGEN TYPE 1; CRABP2, cellular retinoic acid binding protein 2; DES, desmin; FN1, fibronectin 1; FOXA2, forkhead box A2; GAPDH, glyceraldehyde-3-phosphate dehydrogenase; IFITM2, interferon induced transmembrane protein 2; IFITM4, interferon induced transmembrane protein 4; IL6ST, interleukin 6 signal transducer (gp130, oncostatin M receptor); ISL1, ISL LIM homeobox 1; LAMA1, laminin, alpha 1; LAMININ; MNX1, motor neuron and pancreas homeobox 1; NANOG, Nanog homeobox; NES, nestin; OLIG2, oligodendrocyte lineage transcription factor 2; PAX4, paired box 4; POU5F1, POU class 5 homeobox 1; SFRP2, secreted frizzled-related protein 2; SYCP3, synaptonemal complex protein 3; T, brachyury homolog.
Expression profile of pluripotent and lineage-specific stem cell markers of MSCs. (A) The Ct value of genes analysed in the study by SYBR green-based qRT-PCR for BM-MSCs, ASCs (liposuction) and ASCs (biopsy). The lower a cycle threshold (CT) value, the more copies are present in the specific sample. Values are presented after normalization to 18s mRNA levels. (B) Semi-quantitative RT-PCR of selected genes for BM-MSCs, ASCs (liposuction) and ASCs (biopsy). Average of three replicates is displayed.
Discussion
In the present study, we performed side-by-side comparison between three groups of stem cells derived from bone marrow; adipose tissue obtained using liposuction and adipose tissue from biopsy. BM-MSCs were observed to proliferate better than both groups of ASCs, which was corroborated by a battery of experiments (higher cell count, population doubling as well as lower senescence assay). Our results were similar to many established studies [21; 22]. In regards to ASCs from liposuction and biopsy, the former was better in terms of proliferation rate than the latter. Surprisingly, our result contradicts with previous research that reported a non-significant difference in regards to cell count between ASCs from liposuction and biopsy [22]. However, this study did not include a comprehensive experiment related to cell proliferation, making it difficult to compare their work with ours. Further, trypan blue may not be a sensitive method to evaluate cell proliferation [23]. BM-MSCs as well as both ASCs were consistent in terms of immunophenotyping analysis and were in accordance to many previous studies [12; 24]. In addition, it is worth to note that only 1% of ASCs expressed the HLA-DR molecule, suggesting their prospects for allogeneic transplantation [22]. Further, as expected, all cell lines were able to differentiate into all three mesoderm lineages, given the fact that the cells are from mesoderm origin [25]. Nevertheless, ASCs (liposuction) was seen to perform relatively better than ASCs (biopsy) and it can be inferred that the former has a more homogenous population of stem cells [26].
Pathway analysis revealed that ASCs (liposuction) expressed a few specific genes related to proliferation/stemness; among these genes are CTNNB1, POU5F1 (OCT4), DNMT3B and NANOG. We have previously reported the expression of Nanog, Oct4, and DNMT3B in ASCs [18]. Surprisingly, we also noticed the expression of CTNNB1. Several studies have found that this gene plays a significant role in WNT signaling in promoting cell proliferation. It also acts together with WNT1 and WNT3A genes to inhibit osteogenesis differentiation of MSCs [27]. This might also explain the reduced degree of differentiation for ASCs (liposuction) towards osteogenesis that we observed in this study. The expression of RUNX2 was also significant in this study. Besides regulating osteogenesis differentiation and bone formation, it also suppresses osteoblast differentiation by affecting cell cycle progression in the G1 phase [28]. Hence, we postulate that RUNX2 plays a bigger role in cell proliferation.
Gene expressions in ASCs (liposuction) were focused towards endoderm lineage. This is based on the expression of SOX17 and ISL1. SOX17 plays an important role in the formation of beta cell lines [29]. Besides that, another endoderm gene related to beta cell line was noticed, which is ISL1 [29]. It is also indirectly involved in digestive system formation [30]. AFP gene, which is the entry point towards liver formation, was also seen [31]. EEF1A gene is however involved in enzymatic delivery of aminoacyl tRNAs to the ribosome and is expressed highly in internal organs. This indicates that ASCs (liposuction) may be a better source in endoderm related diseases. Our results correlate with previous studies which suggest that ASCs might be a better stem cell source than BM-MSCs for beta cell line [32; 33].
It is not surprising to see ASCs (biopsy) expressing large number of cells linked to mesoderm lineage. Neural fate is regarded as the default pathway of mouse embryonic stem cells (ESCs) [34]. Further, Pal et al [35] reported that human (h) ESCs (HUES)-9 follows a neural pathway whereas HUES-7 is present in mesodermal which spontaneously indicates the existance of default pathways in all cell lines. Likewise, our data strongly indicates there is a natural default pathway embedded in ASCs (biopsy) and the pathway is most likely related to the microenvironment that these cells originated from [36]. Both ASCs from liposuction and biopsy expressed primary as well as mature neuro-ectoderm markers including OLIG2, GFAP, and NESTIN. Uniquely, the expression of GFAP is only present in ASCs (liposuction) and OLIG2 in ASCs (biopsy). OLIG2 is highly related to oligodendrocyte formation which also encodes for an essential regulator of ventral neuroectodermal progenitor cell fate [37]. GFAP gene on the other hand plays an important role in neurogenesis [38]. This shows that these cells may rise to different types of neuronal cells although further studies needs to be done to prove our hypothesis.
Our findings have relevance in regenerative medicine particularly in the usage of ASCs. We have compelling evidence demonstrating that isolating method plays a crucial role in deciding the fate of stem cells. In this study, two methods of isolation were employed on the same donor. We have isolated biopsy specimens based on previous study [39; 40] on the principles that perforating vessels of the abdominal wall do not need to be cut, consequently preserving the arterial, venous, and lymphatic networks. The main principle is to maintain the normal blood supply to the panniculus, avoiding major complications during and after surgery. In contrast to a previous report stating that yield for liposuction samples were significantly lower compared to biopsy sources, we on the other hand did not find any statistically significant difference for both group of cells. Nevertheless, upon culturing we found that the proliferation of ASCs (liposuction) was significantly higher compared to ASCs (biopsy). The main reason behind this phenomenon remains unanswered. However, Buschmann et al, [41] have reported that adherent ASC fractions influence floating cells from attaching to the plastic surface. It is well known that stromal vascular fraction (SVF) contains not only ASCs but also vascular endothelial cells (VECs), resident macrophages, lymphocytes, vascular pericytes and fibroblasts [42]. Based on this, we postulate that non-stem cells such as fibroblasts attaches more quickly, preventing other cells from attaching by secreting paracrine factors. Perhaps the amount of these cells may be less in ASC (liposuction) as compared to (biopsy), which ultimately impacts the proliferation rate, differentiation capacity and gene profiling in subsequent sub-cultures.
Sub-cultures are necessary in a clinical set-up since large numbers of cells are required for transplantation. It was reported that a 70kg patient would need approximately 2 x 10⁶ MSCs/kg body weight for transplantation [43]. Furthermore, presence of significant differences in terms of molecular phenotype between ASCs (liposuction) and ASCs (biopsy) in the present study shows that utmost vigilance need to be given not only on the choice of cell source for a particular clinical application, but also in isolating and maintaining the cells with good tissue practises.
Key points
- We found that the basic characteristics (cell proliferation, differentiation and cell surface antigen profile) of ASCs (liposuction) and ASCs (biopsy) were comparable.
- Differentially regulated genes from ASCs (liposuction) that were up-regulated suggest endoderm lineage propensity.
- Differentially regulated genes from ASCs (biopsy) that were up-regulated indicate tendency towards mesoderm/ectoderm lineage.
Acknowledgements
This work is part of research collaboration between Hygieia Innovation and the Faculty of Dentistry, University of Malaya. This work is supported by the University of Malaya, High Impact Research Grant, Ministry of Higher Education, Malaysia (Grant No UM.C/HIR/MOHE/DENT/01).
Conflict of interest
The authors declare no conflicts of interest.
References
1. Ishikawa T, Hagiwara K, Ochiya T. Generation and Hepatic Differentiation of Human iPS Cells. Meth Mol Biol. 2012;826:103-114 doi: 10.1007/978-1-61779-468-1_9
2. Schambach A, Cantz T, Baum C, Cathomen T. Generation and genetic modification of induced pluripotent stem cells. Expet Opin Biol Ther. 2010;10(7):1089-1103
3. Rodríguez JP, Astudillo P, Ríos S, Pino AM. Involvement of adipogenic potential of human bone marrow mesenchymal stem cells (MSCs) in osteoporosis. Curr Stem Cell Res Ther. 2008;3(3):208-218
4. Shetty P, Cooper K, Viswanathan C. Comparison of proliferative and multilineage differentiation potentials of cord matrix, cord blood and bone marrow mesenchymal stem cells. Asian J Transfus Sci. 2010;4(1):14-24
5. Gimble JM, Katz AJ, Bunnell BA. Adipose-Derived Stem Cells for Regenerative Medicine. Circ Res. 2007;100(9):1249-1260
6. Anghileri E, Marconi S, Pignatelli A, Cifelli P, Galié M, Sbarbati A, Krampera M, Belluzzi O, Bonetti B. Neuronal differentiation potential of human adipose-derived mesenchymal stem cells. Stem Cells Dev. 2008;17(5):909-916
7. Fonseca-Alaniz MH, Takada J, Alonso-Vale MI, Lima FB. Adipose tissue as an endocrine organ: from theory to practice. J Pediatr (Rio J). 2007;83(5 Suppl):S192-203
8. Yoshimura K, Sato K, Aoi N, Kurita M, Inoue K, Suga H, Eto H, Kato H, Hirohi T, Harii K. Cell-assisted lipotransferfor facial lipoatrophy: Efficacy of clinical use of adipose derived stem cells. Dermatol Surg. 2008;34(9):1178-1185
9. Rigotti G, Marchi A, Galie M, Baroni G, Benati D, Krampera M, Pasini A, Sbarbati A. Clinical treatment of radiotherapy tissue damage by lipoaspirate transplant: A healing process mediated by adipose-derived adult stem cells. Plast Reconstr Surg. 2007;119(5):1409-1422 discussion 1423-1424
10. Fang B, Mai L, Li N, Song Y. Favorable response of chronic refractory immune thrombocytopenic purpura to mesenchymal stem cells. Stem Cells Dev. 2012;21(3):497-502
11. Kuhbier JW, Weyand B, Radtke C, Vogt PM, Kasper C, Reimers K. Isolation, Characterization, Differentiation, and Application of Adipose-Derived Stem Cells. Adv Biochem Eng Biotechnol. 2010;123:55-105 doi: 10.1007/10_2009_24
12. Peng L, Jia Z, Yin X, Zhang X, Liu Y, Chen P, Ma K, Zhou C. Comparative analysis of mesenchymal stem cells from bone marrow, cartilage, and adipose tissue. Stem Cells Dev 17. 2008(4):761-773
13. Schipper BM, Marra KG, Zhang W, Donnenberg AD, Rubin JP. Regional anatomic and age effects on cell function of human adipose-derived stem cells. Annals of Plastic Surgery. 2008;60(5):538-544
14. Van Harmelen V, Rohrig K, Hauner H. Comparison of proliferation and differentiation capacity of human adipocyte precursor cells from the omental and subcutaneous adipose tissue depot of obese subjects. Metabolism. 2004;53(5):632-637
15. Oedayrajsingh-Varma MJ, van Ham SM, Knippenberg M, Helder MN, Klein-Nulend J, Schouten TE, Ritt MJ, van Milligen FJ. Adipose tissue-derived mesenchymal stem cell yield and growth characteristics are affected by the tissue-harvesting procedure. Cytotherapy. 2006;8(2):166-177
16. Torio-Padron N, Huotari AM, Eisenhardt SU, Borges J, Stark GB. Comparison of Pre-Adipocyte Yield, Growth and Differentiation Characteristics from Excised versus Aspirated Adipose Tissue. Cells Tissues Organs. 2010;191(5):365-371
17. Govindasamy V, Abdullah AN, Ronald VS, Musa S, Che ZA, Aziz Ab, Zain RB, Totey S, Bhonde RR, Abu Kasim NH. Inherent Differential Propensity of Dental Pulp Stem Cells Derived from Human Deciduous and Permanent Teeth. J Endodont. 2010;36(9):1504-1515
18. Abu Kasim NH, Govindasamy V, Gnanasegaran N, Musa S, Pradeep PJ, Srijaya TC, Aziz ZA. Unique molecular signatures influencing the biological function and fate of post-natal stem cells isolated from different sources. J Tissue Eng Regen Med. 2012 doi: 10.1002/term.1663
19. Cho JA, Park H, Lim EH, Lee KW. MicroRNA expression profiling in neurogenesis of adipose tissue-derived stem cells. J Genet. 2011;90(1):81-93
20. Monaco E, Bionaz M, Rodriguez-Zas S, Hurley WL, Wheeler MB. Transcriptomics Comparison between Porcine Adipose and Bone Marrow Mesenchymal Stem Cells during In Vitro Osteogenic and Adipogenic Differentiation. PLoS ONE. 2012;7(3):e32481. doi:10.1371/journal.pone.0032481
21. Ledoux S, Queguiner I, Msika S, Calderari S, Rufat P, Gasc JM, Corvol P, Larger E. Angiogenesis Associated With Visceral and Subcutaneous Adipose Tissue in Severe Human Obesity. Diabetes. 2008;57(12):3247-3257
22. Schreml S, Babilas P, Fruth S, Orsó E, Schmitz G, Mueller MB, Nerlich M, Prantl L. Harvesting human adipose tissue-derived adult stem cells: resection versus liposuction. Cytotherapy. 2009;11(7):947-957
23. Garzón I, Pérez-Köhler B, Garrido-Gómez J, Carriel V, Nieto-Aguilar R, Martín-Piedra MA, García-Honduvilla N, Buján J, Campos A, Alaminos M. Evaluation of the cell viability of human Wharton's jelly stem cells for use in cell therapy. Tissue Eng Part C: Methods. 2012;18(6):408-419
24. Hausman GJ, Dodson MV. Stromal Vascular Cells and Adipogenesis: Cells within Adipose Depots Regulate Adipogenesis. J Genomics. 2013;1:56-66 doi:10.7150/jgen.3813
25. Gaiba S, de França LP, de França JP, Ferreira LM. Characterization of human adipose-derived stem cells. Acta Cir Bras. 2012;27(7):471-476
26. Scherberich A, Maggio NDD, Mc Nagny KM. A familiar stranger: CD34 expression and putative functions in SVF cells of adipose tissue. World J Stem Cells. 2013;5(1):1-8
27. Boland GM, Perkins G, Hall DJ, Tuan RS. Wnt 3a promotes proliferation and suppresses osteogenic differentiation of adult human mesenchymal stem cells. J Cell Biochem. 2004;93(6):1210-1230
28. Lucero CM, Vega OA, Osorio MM, Tapia JC, Antonelli M, Stein GS, van Wijnen AJ, Galindo MA. The cancer-related transcription factor Runx2 modulates cell proliferation in human osteosarcoma cell lines. J Cell Physiol. 2013;228(4):714-723
29. Chandra VGS, Muthyala S, Jaiswal AK, Bellare JR, Nair PD, Bhonde RR. Islet-Like Cell Aggregates Generated from Human Adipose Tissue Derived Stem Cells Ameliorate Experimental Diabetes in Mice. PLoS ONE. 2011;6(6):e20615. doi:10.1371/journal.pone.0020615
30. Guo T, Wang W, Zhang H, Liu Y, Chen P, Ma K, Zhou C. ISL1 Promotes Pancreatic Islet Cell Proliferation. PLoS ONE. 2011;6(8):e22387. doi:10.1371/ journal.pone.0022387
31. Usdin TB, Mezey E, Button DC, Brownstein MJ, Bonner TI. Gastric inhibitory polypeptide receptor, a member of the secretin-vasoactive intestinal peptide receptor family, is widely distributed in peripheral organs and the brain. Endocrinology. 1993;133(6):2861-2870
32. Lee J, Han DJ, Kim SC. In vitro differentiation of human adipose tissue-derived stem cells into cells with pancreatic phenotype by regenerating pancreas extract. Biochem Biophys Res Commun. 2008;375(4):547-551
33. MacLaren R, Cui W, Simard S, Cianflone K. Influence of obesity and insulin sensitivity on insulin signaling genes in human omental and subcutaneous adipose tissue. Journal of Lipid Research. 2008;49(2):308-323
34. Tropepe V, Hitoshi S, Sirard C. Mak TW, Rossant J, van der Kooy D. Direct neural fate specification from embryonic stem cells: a primitive mammalian neural stem cell stage acquired through a default mechanism. Neuron. 2001;30:65-78
35. Pal R, Totey S, Mamidi MK, Bhat VS, Totey S. Propensity of human embryonic stem cell lines during early stage of lineage specification controls their terminal differentiation into mature cell types. Exp Biol Med (Maywood). 2009;234(10):1230-1243
36. Burdick JA, Vunjak-Novakovic G. Engineered microenvironments for controlled stem cell differentiation. Tissue Eng Part A. 2009;15(2):205-19
37. Haflera BP, Surzenkoa N, Beiera KT, Punzoa C, Trimarchia JM, Kong JH, Cepko CL. Transcription factor Olig2 defines subpopulations of retinal progenitor cells biased toward specific cell fates. P Natl Acad Sci USA. 2012;109(20):7882-7887
38. Garcia AD, Doan NB, Imura T, Bush TG, Sofroniew MV. GFAP-expressing progenitors are the principal source of constitutive neurogenesis in adult mouse forebrain. Nat Neurosci. 2004;7(11):1233-1241
39. Avelar JM. A new technique for abdominoplasty-closed vascular system of subdermal flap folded over itself combined to liposuction. Rev Bras Cir Cardiovasc. 1999;88:3-20
40. Avelar JM. Aesthetic plastic surgery of the axilla. Rev Bras Cir Cardiovasc. 1999 88/89 (1/6): 41-54
41. Buschmann J, Gao S, Harter L. Yield and proliferation rate of adipose-derived stromal cells as a function of age, body mass index and harvest site-increasing the yield by use of adherent and supernatant fractions? Cytotherapy. 2013;0:1-8
42. Yohimura K, Shiguera T, Matsumoto D. Characterization of freshly isolated and cultured cells derived from the fatty and fluid portions of liposuctions aspirates. J Cell Physiol. 2006;208:64-76
43. Govindasamy V, Ronald VS, Abdullah AN, Ganesan Nathan KR, Aziz ZA, Abdullah M, Zain RB, Kasim NH, Musa S, Bhonde RR. Human platelet lysate permits scale-up of dental pulp stromal cells for clinical applications. Cytotherapy. 2011;13(10):1221-1233
Author contact
![]() Corresponding authors: Vijayendran Govindasamy, PhD, Hygieia Innovation Sdn. Bhd, Lot 1G-2G, Lanai Complex No.2, Persiaran Seri Perdana, Percint 10, 62250, Federal Territory of Putrajaya, Malaysia. Phone: +60388902968, fax: +60388902969; Email: vijaycom. Or Noor Hayaty Abu Kasim, BDS, Ph.D, Department of Conservative Dentistry, Faculty of Dentistry, University of Malaya, 50603 Kuala Lumpur, Malaysia. Phone: +603 79674806/4543 Fax: 603 79674533; Email: nhayatyedu.my.
Corresponding authors: Vijayendran Govindasamy, PhD, Hygieia Innovation Sdn. Bhd, Lot 1G-2G, Lanai Complex No.2, Persiaran Seri Perdana, Percint 10, 62250, Federal Territory of Putrajaya, Malaysia. Phone: +60388902968, fax: +60388902969; Email: vijaycom. Or Noor Hayaty Abu Kasim, BDS, Ph.D, Department of Conservative Dentistry, Faculty of Dentistry, University of Malaya, 50603 Kuala Lumpur, Malaysia. Phone: +603 79674806/4543 Fax: 603 79674533; Email: nhayatyedu.my.