Impact Factor ISSN: 1449-1907

 Global reach, higher impact
Int J Med Sci 2014; 11(4):327-336. doi:10.7150/ijms.7373 This issue Cite
Research Paper
Antibacterial Activity of a Cardanol from Thai Apis mellifera Propolis
Pattaraporn Boonsai1, Preecha Phuwapraisirisan2, Chanpen Chanchao1 ![]()
1. Department of Biology, Faculty of Science, Chulalongkorn University, 254 Phayathai Road, Bangkok 10330, Thailand;
2. Department of Chemistry, Faculty of Science, Chulalongkorn University, 254 Phayathai Road, Bangkok 10330, Thailand.
Received 2013-8-9; Accepted 2014-1-24; Published 2014-2-7
Abstract
Background: Propolis is a sticky, dark brown resinous residue made by bees that is derived from plant resins. It is used to construct and repair the nest, and in addition possesses several diverse bioactivities. Here, propolis from Apis mellifera from Nan province, Thailand, was tested for antibacterial activity against Gram+ve (Staphylococcus aureus and Paenibacillus larvae) and Gram-ve (Escherichia coli) bacteria.
Materials and methods: The three bacterial isolates were confirmed for species designation by Gram staining and analysis of the partial sequence of 16S rDNA. Propolis was sequentially extracted by methanol, dichloromethane and hexane. The antibacterial activity was determined by agar well diffusion and microbroth dilution assays using streptomycin as a positive control. The most active crude extract was further purified by quick column and adsorption chromatography. The apparent purity of each bioactive fraction was tested by thin layer chromatography. The chemical structure of the isolated bioactive compound was analyzed by nuclear magnetic resonance (NMR).
Results: Crude methanol extract of propolis showed the best antibacterial activity with a minimum inhibition concentration (MIC) value of 5 mg/mL for S. aureus and E. coli and 6.25 mg/mL for P. larvae. After quick column chromatography, only three active fractions were inhibitory to the growth of S. aureus and E. coli with MIC values of 6.25 and 31.3 µg/mL, respectively. Further adsorption chromatography yielded one pure bioactive fraction (A1A) with an IC50 value of 0.175 µg/mL for E. coli and 0.683 µg/mL for P. larvae, and was determined to be cardanol by NMR analysis. Scanning and transmission electron microscopy analysis revealed unusual shaped (especially in dividing cells), damaged and dead cells in cardanol-treated E. coli.
Conclusion: Thai propolis contains a promising antibacterial agent.
Keywords: Antibacterial activity, Apis mellifera, Cardanol, Propolis, Nan province, Pathogen.
Introduction
Apis mellifera is native to the continents of Europe and Africa and introduced almost worldwide. Within Thailand it was imported for bee farming about 70 years ago, and established in the 1970's with further importations, due to its ease of cultivation and excellent honey production, which is its main economic product in the country. Excluding its role in crop pollination, other than honey the commercial bee products are royal jelly, bee pollen, bee venom, wax, and propolis. Propolis, a sticky and usually dark brown resinous material, is used by bees for construction and repair of the hive [1], and is derived from plant resins, tree buds, sap flows, and other botanical sources collected by honeybees. It is created as an amalgamation of sap, pollen, wax, and other substances, which the bees accumulate during their foraging activities and is then harvested from the foraging bees on their return to the hive [1]. Propolis is not only used structurally to fill out cracks in the bee hive but it also has antimicrobial properties and is used to defend against pathogenic microorganisms [2], suggesting its potential interesting bioactivities.
Propolis has been reported to be comprised of about (v/v) 50% resin, 30% wax, 10% oil, 5% pollen, and 5% other compounds, depending upon the source [3], and to contain diverse chemical compounds. These include those families known to have biological activity, such as aromatic acids, aromatic esters, phenolic acids, flavonoids in many forms (flavonoles, flavones, flavonones, dihydroflavonoles and chalcones), terpenes, beta-steroids, aromatic aldehydes and alcohols, sesquiterpenes, stibene, terpenes, ketones, fatty acids and aromatic alcohols [4,5].
Bioactivities have long been reported for propolis, such as anti-inflammatory [6], anti-oxidative [7], antiproliferation [8], anti-diabetic [9], and antimicrobial [10-12] activities. The latter includes antiviral, antifungal and anti-bacterial activities.
For antiviral activity, the ethanol and water extracts of propolis (EEP and WEP, respectively) from A. mellifera from Moravia (Czech Republic) were reported to inhibit the growth of herpes simplex virus type 1 with IC50 values of 0.0004% and 0.000035% (w/v) for WEP and EEP, respectively [10]. Galangin and chrysin were the two isolated active ingredients in the extract, but did not account for all of the antiviral activity suggesting the existence of other active compounds.
For antifungal activity, galangin and pinocembrin were found to be the active compounds in A. mellifera propolis, in terms of the inhibition of the growth of Phomopsis spp., Fusarium sp., Trichoderma spp., and Penicillium notatum, with galangin being better than ketoconazole [11], a recently used fungicide drug. However, the antifungal activity of galangin against the growth of Schizophyllum commune and Pycnoporus sanguineus was inferior to that of ketoconazole.
For antibacterial activity, the in vitro inhibition of growth of methicillin-resistant Staphylococcus aureus (MRSA) by the EEP from bees originating in the Solomon Islands was shown against 15 MRSA clinical isolates using an agar dilution assay [12]. Subsequent purification of the crude EEP revealed the active components were likely to be prenylflavanones, such as propolins C, D, G, and H. For example, the minimum inhibition concentration (MIC) of propolins C and D against MRSA was 8-32 and 8-16 mg/L, respectively.
Since propolis is primarily plant-derived and actively collected by bees, then the bee species (foraging preference and distance), geographic location of the hive (plant species available to the bees) and the season (sap (etc) availability at that time), are likely to be important determinants in the propolis composition [13]. In accord, it has been reported that propolis has many bioactivities and various chemical compounds that depend mainly on the bee species, season, harvesting periods, geographical areas, and other external factors [14,15]. For example, the propolis from Bornes and Fundao in the Northeast and Central Portugal, respectively, were reported to have different antioxidant activities as well as different plant origins [15], as determined for the later by analysing the pollen content within the propolis [16]. The Bornes propolis contained pollen from Populus tremula (30%), Castanea sativa (45%), Pinus sp. (0%), and others (25%), while the latter contained pollen from P. tremula (50%), C. sativa (0%), Pinus sp. (15%), and others (35%).
These variations in biodiversity of propolis, from changes in its composition, with season, phytogeographic location and bee species are complicating factors for developing propolis as a commercial drug, but at the same time, since such plant sources have been preselected over evolutionary time for bioactivity by the bees, the screening of multiple geographic and seasonal sources of propolis provides a greater potential diversity of candidate bioactive compounds.
This biogeographic diversity in propolis composition and bioactivity led us to search for new antibacterial agent(s) from the propolis of A. mellifera in Thailand which hopefully would be fruitful for the health of people themselves and bees in the future. Thus, the purpose of this research was to determine the antibacterial activity of A. mellifera propolis from Nan province against S. aureus, Escherichia coli and Paenibacillus larvae using the agar well diffusion and microbroth dilution assays. The active compound was enriched by chromatography, and its chemical structure analyzed for provisional identification.
Materials and Methods
Propolis collection
Propolis of Apis mellifera was collected from a bee farm in Pua district, Nan province, Thailand in January, 2011 (winter). It was wraped in aluminum foil and kept in the dark at -20 °C until used.
Crude extraction
Propolis (90 g) was cut into small pieces and extracted in 400 mL of 80% (v/v) aqueous methanol (MeOH) by shaking at 100 rpm, 15 °C for 18 h. The extract was clarified by centrifugation at 7,000 rpm, 20 °C for 15 min. The supernatant (extract) was then harvested, evaporated by a rotary evaporator (Buchi Rotavapor R-114) to remove the solvent and the resulting crude MeOH extract (CME) kept in the dark at -20 °C until used. The pellet (residual propolis) was then sequentially extracted in a similar manner with dichloromethane (CH2Cl2) and hexane to yield the crude CH2Cl2 (CDE) and hexane (CHE) extracts, respectively. The antibacterial activity of the CME, CDE and CHE extracts were then assayed for antibacterial activity by the agar well diffusion and microbroth dilution assays.
Chromatography
Quick column chromatography
A column was tightly packed with 500 g silica gel 60 G (0.063-0.2 mm) into the sintered glass column to a final bed volume of 250 mL using a vacuum pump. The CME resin was mixed with silica gel 60 until it was not sticky and placed on top of the packed gel, followed by a piece of filter paper (Whatman, qualitative circle of 110 mm in Ø, cat. # 1003110). The column was then sequentially eluted with 1.5 L each of 100% (v/v) hexane, 1:3 (v/v) CH2Cl2: hexane, 1:1 (v/v) CH2Cl2: hexane, 3:1 (v/v) CH2Cl2: hexane, 100% (v/v) CH2Cl2, 1:29 (v/v) MeOH: CH2Cl2 and 3:7 (v/v) MeOH: CH2Cl2, collecting 500 mL fractions. The antibacterial activity of each fraction was then assayed by agar well diffusion and microbroth dilution assays. The chemical profile of fractions was checked by one dimensional thin layer chromatography (1D-TLC).
Adsorption chromatography
The antibacterial-activity containing fractions after quick column chromatography were pooled, evaporated to remove the solvent and mixed with silica gel 60 (5-7 g) at room temperature (RT) until dry. The dry mixture was then applied on top of a 250-mL bed volume silica gel 60 gel adsorption chromatography column (presoaked in hexane). Additional silica gel was placed on top in order to make the layer containing the sample smooth and then followed by cotton. The column was sequentially eluted with 500 mL each of 100% (v/v) hexane, 1:1 (v/v) CH2Cl2: hexane, 3:1 (v/v) CH2Cl2: hexane and 100% (v/v) MeOH, collecting 2.5 mL fractions. The chemical profile of each of the 400 fractions was determined by 1D-TLC, and fractions with a similar profile were pooled and evaporated to remove the solvent. The antibacterial activity of each resulting (pooled) fraction was then assayed by agar well diffusion and microbroth dilution assays.
One dimensional-thin layer chromatography (1D-TLC)
A silica coated TLC plate was cut into 5 × 5 cm pieces, with the samples loaded 0.5 cm above one edge and the mobile phase run for 4 cm above that. Samples were each loaded onto and run on five separate plates (one per mobile phase, see below). If the sample was too sticky to apply neat, it was diluted as required in the solvent. Each sample-spotted TLC plate was air dried and then resolved in a glass chamber with one of 100% (v/v) hexane, 1:1 (v/v) CH2Cl2: hexane, 1:3 (v/v) CH2Cl2: hexane, 100% (v/v) CH2Cl2 and 1:49 (v/v) MeOH: CH2Cl2, respectively (one mobile phase for each of the five replicate plates). The pattern of migrated compounds on each TLC plate was visualized under ultraviolet light and marked.
Bacterial cultures
Representative Gram+ve (S. aureus (ATCC 20651) and P. larvae (PL 44)) and Gram-ve (E. coli O157: H7) bacteria were used to evaluate the antimicrobial activity. S. aureus and E. coli were obtained from the Department of Medical Sciences, Ministry of Public Health, Thailand while the nominate P. larvae larvae (referred to hereafter as P. larvae, see [17] for the rational of collapsing subspecies designation to species) was obtained from the Honeybee Research Group, National Institute of Livestock and Grassland Sciences, Tsukuba, Japan. The three bacterial isolates were confirmed for likely species designation by Gram staining and sequence analysis of a fragment of the 16S rRNA gene.
Glycerol stocks of S. aureus and E. coli were streaked on Luria-Bertani (LB) agar (1% (w/v) bacto-tryptone, 0.5% (w/v) bacto-yeast extract, 1% (w/v) NaCl and 4.5% (w/v) nutrient agar) and incubated aerobically at 37 °C overnight. The glycerol stock of P. larvae was streaked on brain heart infusion agar (BHI agar) and anaerobically cultured at 35 °C for 48 h.
A selected single colony of each bacterial isolate was separately inoculated into 5 mL of media, LB for S. aureus and E. coli or BHI broth for P. larvae. The cultures were then incubated aerobically with shaking at 130 rpm, 37 °C for 48 h for S. aureus and E. coli, or anaerobically at 35 °C overnight for P. larvae. The turbidity of each culture was then adjusted with fresh medium to match the turbidity of 0.5 McFarland (OD of 0.08-0.1 at 625 nm).
Strain verification
Gram staining
Gram staining was performed as reported [18]. Briefly, a targeted colony was picked up, smeared onto a H2O drop on a glass slide, heat dried / fixed and stained in crystal violet solution for 1 min before being rinsed in H2O. It was then stained in iodine solution for 1 min, rinsed by H2O, decolorized in 95% (v/v) ethanol (EtOH) and rinsed in H2O before staining in safranin O for 20-30 s and rinsed by H2O. After air drying, the shape and Gram stain of bacteria was observed under a light microscope.
Sequence analysis of a partial fragment of the 16S rRNA gene
Genomic DNA extraction from a single E. coli colony for PCR was performed by suspending a small amount of a colony in 20 µL of TE buffer (10 mM Tris-HCl and 1 mM EDTA, pH 7.5), incubating at -20 °C for 30 min followed by 95 °C for 5 min, and vortexing. This step was repeated three times and then the genomic DNA extract was kept at -20 ºC until used. Genomic DNA from S. aureus and P. larvae was performed using a QIAMP mini kit (Qiagen, cat. # 27104) according to the manufacturer's instructions. The concentration and purity of the extracted DNA were estimated after measuring the absorbance at 260 and 280 nm using Eqs. (1) and (2), respectively. The quality of the extracted DNA was visually inspected (in terms of apparent mass) after resolution by 1.2% (w/v) agarose gel electrophoresis, staining with 10 µg/mL of ethidium bromide for 10 min, destained in d-H2O for 20 min and visualized by UV transillumination.
Concentration of DNA (μg/mL) = (A260)(dilution factor)(50) (1)
DNA purity = A260/A280 (2)
where A260 and A280 are the absorbance at 260 nm and 280 nm, respectively. Note that the term 50 in Eq. (1) is the molar extinction coefficient for double-stranded DNA.
PCR amplification
Each PCR reaction (20 μL) was comprised of 1 U of Ex Taq DNA polymerase and 1x buffer, 2.5 mM MgSO4, 1.0 mM dNTP, 500 nM of each primer and ~200 ng DNA template. The primer pair (eu27F and eu1495R) were designed to amplify a portion (bp 27-1495 in the E. coli sequence) of the 16S rRNA [19]. PCR reactions were performed at 95 °C for 60 s, followed by 35 cycles of 95 °C for 60 s, 55 °C for 60 s and 72 °C for 60 s, followed by a final 72 oC for 10 min. After 1% (w/v) agarose-TBE electrophoresis of the PCR products, the desired band was purified using a QIAquick® PCR purification kit (Cat. # 28104, Qiagen) as per the manufacturer's protocol and direct sequenced by BigDye Terminator Cycle Sequencing Kit methods and resolved using a DNA sequencer (ABI 3730; Applied Biosystems). After that, the obtained nucleotide sequence was searched for homologs in GenBank using the online BLASTn software.
DNA sequencing
Each sequencing reaction was composed of 2 μL of d-H2O, 5 μL of 5x sequencing buffer (ABI 3730; Applied Biosystems), 10 μL of DNA template (300 ng), 2 μL of Big-Dye enzyme (ABI 3730; Applied Biosystems) and 1 μL of 3.3 µM of primer (either eu27F or eu1495R, and was performed at 96 °C for 60 s followed by 25 cycles of 96 °C for 12 s, 50 °C for 7 s, and 60 °C for 3 min 45 s, and then followed by a final 60 °C for 30 s. After thermal cycling the PCR reaction mixture was mixed with 2 μL of 3 M NaOAc (pH 5.2) and 50 μL of 95% (v/v) EtOH and incubated at RT for 1 min, before being centrifuged at 10,000 rpm, RT for 15 min and discarding the supernatant. The pellet was washed with 100 μL of 70% (v/v) EtOH, air dried and resuspended in 20 μL of Hi-Di formamide prior to resolution by capillary electrophoresis on a 3730 DNA analyzer.
Agar well diffusion assay
For each bacterial culture, 106 colony forming units or CFU in 1 mL were spread onto either a LB agar plate (S. aureus and E. coli) or a BHI agar plate (P. larvae) and left at RT until dry. A well in the centre of the agar plate was created using a sterile cork borer (9 mm Ø). Each test sample was prepared at various concentrations by dissolving in 10% (v/v) DMSO in sterile water containing 5% (v/v) Tween 80. Then 100 µL of the test sample, or solvent only (negative control) or streptomycin sulphate (200 μg/mL) as a positive control was transferred into the well and the plates incubated aerobically at 37 °C for 12 h (S. aureus and E. coli) or anaerobically at 35 °C for 24 h (P. larvae). After that the diameter of the clear zone (inhibition zone) around the well was measured.
Microbroth dilution assay
A single colony of the bacterial isolate was inoculated into LB or BHI broth, as appropriate, and a liquid suspension culture prepared as above. The culture together with the test sample at the desired concentration in a final volume of 100 µL was transferred into each of three wells of a 96-well plate. The culture with solvent added only was used as a negative control and that with streptomycin sulfate (5-50 μg/mL) was used as a positive control. Each 96-well plate was incubated with shaking at 80 rpm, either aerobically at 37 °C for 18-24 h (S. aureus and E. coli) or anaerobically at 35 °C for 18-24 h (P. larvae). After that, 5 µL of 4 mg/mL 2-(4-iodophenyl)-3-(4-nitrophenyl)-5-phenyl-2H-tetrazolium chloride was added into each well. The lowest concentration of test sample that made the culture not red was defined as the MIC. Each of these (5 µL) were also spread onto a LB or BHI agar plate, as appropriate, and incubated as above. The lowest concentration of test samples on which no colonies were detected was defined as the minimal bactericidal concentration (MBC).
Inhibition concentration at 50% (IC50)
The absorbance at 600 nm (A600) of the culture treated with various concentrations of test sample (treated groups) was measured along with that exposed to the solvent only (control) or no treatment. The percentage cell viability of any treated group was calculated by Eq. (3):
Cell viability (%) = [(A600 of treated group) x 100]/(A600of untreated group) (3)
The obtained values were standardized to the cell viability of the control group (set at 100%) and then the IC50 value was derived graphically from the plot of the test sample concentration against the cell viability (%). In addition, the IC50 values were statistically analyzed using the SPSS (version 17.0) software.
Chemical structure analysis
The selected enriched test sample was analyzed by nuclear magnetic resonance (NMR). The selected samples (those with antibacterial activity) after being enriched by adsorption chromatography and solvent removal, were each dissolved (2-3 mg) in 500 µL of deuterated chloroform (CDCl3), transferred into an NMR tube, and then analyzed and interpreted to search for functional groups by a Varian Mercury+ 400 NMR spectrometer operated at 400 MHz for 1H and 2D NMR (COSY, HSQC, HMBC) and 100 MHz for 13C nuclei at the Department of Chemistry, Faculty of Science, Chulalongkorn University. The chemical shift in δ (ppm) was used to describe the signals in the remaining protons in deuterated solvents and TMS was used as an internal standard.
Morphology changes in E. coli
Scanning and transmission electron microscopy
E. coli O157: H7 was treated with the most active fraction at a final concentration of 10x the IC50 value at 37 °C for 4 h with shaking at 130 rpm. They were commercially analyzed for their morphology by scanning electron microscopy (SEM), at the Scientific and Technological Research Equipment Centre of Chulalongkorn University, and by transmission electron microscopy (TEM), at the Central Laboratory and Greenhouse Complex, Kasetsart University, Kampangsaen campus.
Results
The three selected bacterial strains were confirmed for the identity by Gram staining and sequence analysis of a fragment of the 16S rRNA gene. By Gram staining, S. aureus and P. larvae appeared as violet cocci, consistent with their being Gram+ve and their known cell morphologies, respectively. Likwise, E. coli appeared as red rods, consitent with it being Gram-ve and its known cell morphology.
With respect to the 16S rRNA sequence, a PCR product of ~1,400 bp was obtained for both S. aureus and E. coli, and ~400 bp for P. larvae. The partial sequence of 16S rRNA of S. aureus showed a 97% nucleotide identity to the sequence of S. aureus H0596 0412 (accession # HE681097.1) whilst that of E. coli had 99% sequence identity to E. coli HM01 (accession # JN811622.1) consistent with their identity. The partial sequence of 16S rRNA of P. larvae was 86% identical to that for P. larvae (accession # AB680856.1). Thus, these three pathogens were continued to use for the antimicrobial assay later.
Crude solvent extract of propolis from A. mellifera
The CME, CDE and CHE extracts of the propolis were obtained at a yield of 21.72, 36.31 and 22.5 g, respectively, which represents 24.1%, 40.3% and 25.0% by weight of the initial propolis. All three crude extracts were sticky resins, CME looked yellow-brown and CDE and CHE looked dark brown.
Screening for antibacterial activity
With respect to the antibacterial activity of CME, CDE and CHE, as evaluated by the agar well diffusion assay, only the CME at 100 mg/mL showed any significant antibacterial activity, and was at some 66-81% of the level seen with streptomycin at the 500-fold lower concentration of 200 μg/mL (Table 1). Thus, the Gram+ve S. aureus was the most sensitive to CME, followed by the Gram+ve positive P. larvae with the Gram-ve E. coli the least sensitive. Since no discernible anti-bacterial activity was detected at these concentrations in the CDE and CHE, then CME was used for further purification.
Inhibition zone diameter (cm) of the crude propolis extracts of A. mellifera, evaluated by the agar well diffusion assay.
| Sample | Inhibition zone diameter (cm) | ||
|---|---|---|---|
| S. aureus | E. coli | P. larvae | |
| Streptomycin (200 µg/mL) | 2.13 ± 0.05 | 2.07 ± 0.05 | 2.07 ± 0.09 |
| CME (100 mg/mL) | 1.73 ± 0.05 | 1.37 ± 0.05 | 1.53 ± 0.05 |
| CDE (100 mg/mL) | 0 | 0 | 0 |
| CHE (100 mg/mL) | 0 | 0 | 0 |
Data are shown as the mean ± 1 SD, derived from three repeats.
CME was then fractionated using quick column chromatography. Seven fractions (fractions Q1-Q7) were collected, ranging in yield from 0.087-2.59% (total of all seven is only 3.87%) of the original CME extract (Table 2). The appearance and TLC pattern of each fraction is also summarized in Table 2.
Characteristic, yield and TLC patterns of the seven fractions obtained from the CME after quick column chromatography.
| Fraction | Appearance | Weight (mg) / yield (%) | TLC pattern |
|---|---|---|---|
| Q1 | Yellow, sticky resin | 42.4 / 0.195 | No band |
| Q2 | Yellow, sticky resin | 18.9 / 0.087 | No band |
| Q3 | Yellow, sticky resin | 133.2 / 0.613 | Separated bands |
| Q4 | Yellow, sticky resin | 25.5 / 0.117 | Smear |
| Q5 | Yellow, sticky resin | 33.6 / 0.155 | Smear |
| Q6 | Brown, sticky resin | 25.3 / 0.116 | No band |
| Q7 | Brown, sticky resin | 561.7 / 2.586 | No band |
Of these seven fractions, only three fractions (Q3-5) revealed any effective growth inhibition of E. coli, as evaluated by the agar well diffusion assay, with an inhibition zone of 56.5% (Q4) to 71% (Q3) of that seen with streptomycin at the same concentration (Table 3).
Inhibition zone diameter (cm) of fractions obtained by quick column chromatography of CME (Q1-Q7) or of Q3 (A1A).
| Sample (200 μg/mL) | Inhibition zone diameter (cm) | ||
|---|---|---|---|
| S. aureus | E. coli | P. larvae | |
| Streptomycin (200 µg) | 2.13 ± 0.05 | 2.07 ± 0.05 | 2.07 ± 0.09 |
| Fraction Q1 | 0 | 0 | - |
| Fraction Q2 | 0 | 0 | - |
| Fraction Q3 | 0 | 1.47 ± 0.05 | - |
| Fraction Q4 | 1.50 ± 0.00 | 1.17 ± 0.05 | - |
| Fraction Q5 | 1.57 ± 0.05 | 1.43 ± 0.05 | - |
| Fraction Q6 | 0 | 0 | - |
| Fraction Q7 | 0 | 0 | - |
| Purified fraction A1A | 0 | 1.30 ± 0.08 | 1.43 ± 0.06 |
Data are shown as the mean ± 1 SD, derived from three repeats. The diameter of each well was 9 mm. The symbol “-” means not tested.
However, only two of these fractions (Q4 and Q5) were active against S. aureus, although to a slightly greater level than that against E. coli, with an inhibition zone of 70-74% of that seen with streptomycin at the same concentration (Table 3). In contrast, fractions Q1, Q2, Q6 and Q7 (at this concentration of 200 μg/mL) presented no detectable antibacterial activity against these two bacterial isolates in this assay.
Considering the 1D-TLC pattern of each fraction (Table 2), the absence of any band in fractions Q1, Q2, Q6 and Q7 coincided with no detectable growth inhibitory activity against E. coli and S. aureus. The thick smear on the 1D-TLC plate for fractions Q4 and Q5 suggested the components were too difficult to be fractionated (further enriched) by adsorption chromatography although they contained clear anti-bacterial activity. In contrast, well separated bands were revealed in fraction Q3 and so this fraction was further enriched by adsorption chromatography.
After adsorption chromatography of fraction Q3, over a hundred fractions were obtained and then evaporated to remove the eluting solvent. The chemical profile of each fraction was checked by 1D-TLC. A single dominant spot was evident in fraction A1A, and this fraction also had antibacterial activity and so was processed further. Fraction A1A, a sticky yellow resin with a smell of wax, had a yield of 0.1 g. It was effective at inhibiting the growth of E. coli and P. larvae with an inhibition zone of 62.8% and 69%, respectively, of that for streptomycin at the same concentration in the agar well diffusion assay (Table 3). In contrast, no activity could be observed against S. aureus (Table 3). Note that at the same concentration the inhibition zone obtained with fraction A1A against E. coli was smaller than that for fraction Q3. Assuming equal diffusion rates, and so on, this may imply the presence of other components in fraction Q3 (with additive or synergistic antibacterial activities) that are excluded in A1A.
MIC of propolis extracts
The MIC of the crude propolis extracts (CME, CDE and CHE), quick column chromatography fractions (Q1-Q7) and fraction A1A against the three bacterial strains using the microdilution method are summarized in Table 4, along with values taken from the literature for other antibiotics.
Minimum inhibition concentration (MIC) of samples against bacterial strains.
| Sample | MIC | ||
|---|---|---|---|
| S. aureus (μg/mL) | E. coli (μg/mL) | P. larvae | |
| Streptomycin | 12.5 | 12.5 | 50 (μg/ml) |
| Ampicillin | ≤ 0.25 [20] | 2-8 [21] | [22] |
| Chloramphenicol | 2-16 [21] | 2-8 [21] | 25 (μg) [22] |
| Ciprofloxacin | ≤ 1 [20] | 0.004-0.015 [20] | - [22] |
| Tetracyclin | ≤ 4 [20] | [21] | 0.04 (μg) [22] |
| Vancomycin | ≤ 2 [20] | [21] | 0.4 (μg) [22] |
| CME | 5,000 | 5,000 | 6,250 |
| CDE | ND1 | ND1 | ND1 |
| CHE | ND1 | ND1 | ND1 |
| Fraction Q1 | ND2 | ND2 | ND2 |
| Fraction Q2 | ND2 | ND2 | ND2 |
| Fraction Q3 | ND2 | 6.25 | ND2 |
| Fraction Q4 | 31.25 | 6.25 | ND2 |
| Fraction Q5 | 31.25 | 6.25 | ND2 |
| Fraction Q6 | ND2 | ND2 | ND2 |
| Fraction Q7 | ND2 | ND2 | ND2 |
| Purified fraction A1A | ND3 | ND3 | ND3 |
ND indicates the MIC was not determinable (> 500 mg/mL for ND1, > 100 µg/mL for ND2 and > 50 µg/mL for ND3).
No MIC value could be determined (i.e. MIC > 500 mg/mL) for the CDE and CME, as well as fractions Q1, Q2, Q6 and Q7 in agreement with their absence of detectable inhibitory activity at 200 mg/mL (CDE and CHE) or 200 μg/mL (Q fractions) in the agar well diffusion assay. Enrichment of the CME by quick column chromatography reduced the MIC ~800-fold against E. coli (Q3-5) and 160-fold against S. aureus (Q4 and Q5) compared to a ~650- to 850-fold reduced yield, but caused a loss of detectable activity against P. larvae. Thus, as already mentioned, it is likely that other antibacterial compounds are in the propolis.
Although over 100 fractions were obtained from Q3, including fraction A1A, the MIC values could not be determined (i.e. MIC > 50 µg/mL). Thus, the IC50 value of fraction A1A was calculated instead and found to be 0.175 µg/mL for E. coli and 0.683 µg/mL for P. larvae.
Chemical structure analysis
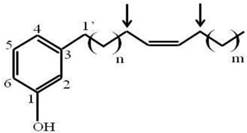
Since fraction A1A was enriched to apparent homogeneity (single spot on 1D-TLC), it was further analyzed for chemical structure by NMR. The data obtained from NMR were as follows. 1H NMR (CDCl3, 400 MHz) δH: 7.05 (1H, t, J = 7.6 Hz, H-5), 6.67 (1H, d, J = 7.6 Hz, H-6), 6.58 (1H, s, H-2), 6.57 (1H, d, J = 8.0 Hz, H-4), 5.36 (1H, br s, OH), 5.28 (2H, m, olefinic proton), 2.46 (2H, t, J = 7.6 Hz, H-1'), 1.95 (4H, br s), 1.48-1.52 (2H, m), 1.18-1.25 (30H, br s) and 0.82 (3H, t, J = 6.8 Hz). 13C NMR (CDCl3, 100 MHz) δC: 155.4, 145.0, 130.0, 129.9, 129.4, 120.9, 115.3, 112.5, 35.9, 32.0, 31.4, 29.8, 29.7, 29.7, 29.6, 29.6, 29.5, 29.4, 29.3, 27.2, 26.9, 22.4 and 14.1. ESIMS m/z [M+H]+ in the range of 400-500. Thus, the active compound was a phenolic compound in the cardanol group (Fig. 1). Phenolic compounds are typically plant-derived and included in esters and glycosides [23], and so it is highly likely that this bioactive compound (A1A) from the propolis was plant-derived.
The chemical structure of A1A (cardanol), as deduced from the NMR analysis.
Effect of A1A (cardanol) on the morphology of E. coli
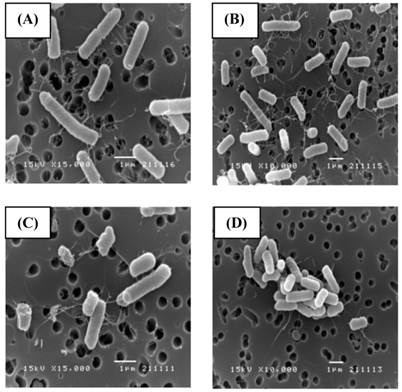
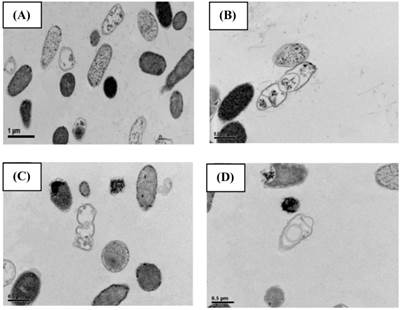
SEM (Fig. 2) and TEM (Fig. 3) analyses of E. coli before and after culture for 4 h at 37 oC with or without exposure to A1A at 1.75 μg/mL (10 x IC50) revealed that untreated E. coli maintained a normal appearance (separate long rod shaped cells with normal growth). However, the A1A treated group displayed an unusual and smaller shape (especially in dividing cells), with the cells tending to clump together in culture, and some cells looked damaged and dead.
SEM images showing the effect of CME fraction A1A (cardanol) at 1.75 μg/mL for 4 h at 37 oC on the morphology of E. coli. (A, B) Untreated and (C, D) treated cells at (A, C) 15,000x and (B, D) 10,000x magnification. Images shown are representative of those seen from at least five such fields of view per sample and three independent samples.
TEM images showing the effect of CME fraction A1A (cardanol) at 1.75 μg/mL for 4 h at 37 oC on the morphology of E. coli. (A, B) Untreated and (C, D) treated cells at (A, C) 10,000x and (B, D) 15,000x magnification. Images shown are representative of those seen from at least five such fields of view per sample and three independent samples.
Discussion
In this research, propolis was collected from Nan province (northern Thailand), a forested and mountainous region, although most of the lowlands have been modified for agriculture. The region has different annual weather patterns (summer and winter), and a diverse plant biodiversity that may provide interesting bioactive compounds in the propolis. For example, the anti-S. aureus activity of propolis collected from different regions in Basque, northeastern Spain, varied according to their origin [24], whilst the precise phenolic compounds found in propolis from Greece and East Cyprus were different [25]. Accordingly, the propolis of A. mellifera used in this research was tested for antibacterial activity against S. aureus (ATCC 20651), E. coli O157: H7, and P. larvae (PL 44), the last being a pathogen that causes American foulbrood disease in honeybees.
The S. aureus and P. larvae (Gram+ve) isolates were more sensitive to CME than E. coli (Gram-ve), although further screening of bacteria would be required to support any Gram-based generalizations. Regardless, these results are in agreement with previous studies, such as that the EEP from Mongolia, Albania, Egypt, and Brazil were more effective against S. aurues than E. coli [26], and that the EEP from Brazil showed a better anti-S. aureus activity than anti-E. coli activity [27]. Furthermore, the alcoholic extract of propolis from Argentina presented a better antimicrobial activity against Gram+ve bacteria [28].
That only the CME was found to be effective at inhibiting the growth of these bacteria, but not CDE and CHE at the tested range (1-500 mg/mL), could imply that the active compound(s) are polar, given that methanol is of a fairly high polarity whilst CH2Cl2 and hexane are of medium and low polarity, respectively.
Although the hexane extraction of propolis and beeswax yielded bromfenvinphos [29], a compound with several interesting bioactivities, and pentacyclic triterpenoid alkanoates with a broad range of bioactivites [30], no antibacterial activity was detected in the Thai CHE of propolis in this research. Besides hexane, seven new p-coumaric acid derivatives along with seventeen known compounds, including four flavonoids, one prenylated phenolic acid, four diterpenoic acids, one lignan, two p-coumaric acid esters and five cinnamic acid derivatives, were isolated from the relatively polar ethyl acetate soluble fraction of a 75% (v/v) EEP of Brazilian propolis [31].
Although an improved anti-E. coli growth activity was observed after the CME of this Thai propolis was enriched, the enriched fractions typically showed a lower specific inhibitory activity on S. aureus than the crude CME and so it is likely that other bioactive components were lost, although whether they are relatively common components with additive effects or less common ones with synergistic effects is unknown. In some previous cases the crude extract of natural products have been shown to provide a better activity than the enriched or purified form, such as the antibacterial activity of crude Tetragonula laeviceps honey versus that of the purified components [32].
Following enrichment of the CME, two (Q4, Q5) or three fractions (Q3-Q5) were found to be effective at inhibiting S. aureus and E. coli, respectively, with MIC values of 31.3 µg/mL in S. aureus and 6.3 µg/mL in E. coli. The enriched bioactive compound from other propolis have been reported to be active against both Gram+ve and Gram-ve bacteria [33,34], but in contrast some enriched froms of propolis have been reported to have no detectable activity against E. coli [25,27].
After adsorption chromatography, fraction A1A could inhibit the growth of E. coli and P. larvae, but not S. aureus, although the MIC values could not be estimated. The decrease in activity with increasing enrichment could suggest the removal of other bioactive components, perhaps even synergistic ones. Synergism of active compounds in the EEP of propolis and some anti-tuberculosis drugs on tuberculosis mycobacteria with different degrees of virulence has been reported previously [35]. Furthermore, EEP was found to have a synergistic effect with antibiotics (ethambutol) on the growth of S. aureus [35].
After NMR analysis, the active compound in fraction A1A was found to likely be a member of the cardanol group. It was previously reported that a cardanol from Brazilian propolis could inhibit the growth of bacteria [36]. In addition, it was previously reported that cardanol could have a broader antimicrobial effect against Gram positive bacteria [37]. Cardanol belongs to the phenolic compound group and in general the higher the level of phenolic compounds the better should be the antimicrobial activity. This notion was supported in the Basque propolis, where those samples with the highest total phenolic content showed the best antimicrobial activity, compared to propolis from other parts of Spain [38].
Due to the different distribution of plants across the globe, propolis has been divided into two main broad groups. The former one is Brazilian type (Baccharis-type) which is mainly composed of terpenoids and prenylated derivatives of p-coumaric acid [39], whilst the latter one is the European-type (poplar-type) in which the dominant plant is Populus nigra L. This propolis is rich in flavonoids and phenolic acid esters [40,41]. Within the popular type, Bonvehı´ and Gutie´rrez [42] also reported that Spanish propolis had an active antioxidant activity that originated from poplars (Populus sp.), ash trees (Fraxinus sp.), elms (Ulmus sp.), willows (Salix sp.), chestnuts (C. sativa), blackberries (Rubus ulmifolius), oaks (Quercus sp.), and birches (Betula sp.).
Cardanols are found worldwide in tropical plants of the family Anacardiaceae, both in their native and cultivated culture [43]. Economic cultivated plants in this family include cashew nut, mango, and ginkgo [44]. Thus, finding the potential original source of this phenolic compound in propolis from Nan province is possible.
The mechanism on how cardanol affects the bacteria is unknown but a change in the morphology of E. coli, especially in the cell membrane and cell division, was observed (Figs. 2 and 3). These results agree with that reported for the antibacterial activity of the EEP from Korea against the growth of Bacillus cereus, where the morphology of the propolis-treated B. cereus cells changed, and the cell membrane was damaged [45], perhaps due to the inhibition of enzymes involved in the DNA repair pathway. Also, cell death can occur due to the malfunction of poly ADP ribose polymerase [45]. Clearly this requires further investigation.
Fraction Q3 gave a better MIC value (6.25 μg/mL) than streptomycin (12.5 μg/mL) against E. coli and so may be a promising new source for the treatment of E. coli infections.
Acknowledgements
We wish to thank the National Research Council of Thailand; the Japan Society for the Promotion of Science; the Graduate School of Chulalongkorn University Fund; the National Research University Project of Thailand (AS613A); and the Ratchadaphiseksomphot Endowment Fund of Chulalongkorn University (RES560530041-FW) for financial support. We are particularly grateful to Prof. Dr. Kiyoshi Kimura of the National Institute of Livestock and Grassland Sciences, Tsukuba, Japan for his generous help and advice. We also thank Dr. Robert Butcher for manuscript preparation. The helpful suggestions of anonymous referees and the Editor are acknowledged.
Competing Interests
The authors have declared that no competing interest exists.
References
1. Wolfe D. Superfoods: the food and medicine of the future. California, USA: North Atlantic Books. 2009
2. Marcucci MC, Ferreres F, García-Viguera C. et al. Phenolic compounds from Brazilian propolis with pharmacological activities. J Ethnopharmacol. 2001;74:105-12
3. Katircioglu H, Mercan N. Antimicrobial activity and chemical compositions of Turkish propolis from different region. Afr J Biotechnol. 2006;5:1151-3
4. Aga H, Shibuya T, Sugimoto T. et al. Isolation and identification of antimicrobial compounds in Brazilian propolis. Biosci Biotechnol Biochem. 1994;58:945-6
5. Russo A, Longo R, Vanella A. Antioxidant activity of propolis: role of caffeic acid phenethyl ester and galangin. Fitoterapia. 2002;73:S21-9
6. Paulino N, Lemos Abreu SR, Uto Y. et al. Anti-inflammatory effects of a bioavailable compound, Artepillin C, in Brazilian propolis. Eur J Pharmacol. 2008;587:296-301
7. Gregoris E, Stevanato R. Correlations between polyphenolic composition and antioxidant activity of Venetian propolis. Food Chem Toxicol. 2010;48:76-82
8. Kouidhi B, Zmantar T, Bakhrouf A. Anti-cariogenic and anti-biofilms activity of Tunisian propolis extract and its potential protective effect against cancer cells proliferation. Anaerobe. 2010;16:566-71
9. Kang L, Lee HB, Bae H. et al. Antidiabetic effect of propolis: reduction of expression of glucose-6-phosphatase through inhibition of Y279 and Y216 autophosphorylation of GSK-3α/β in HepG2 cells. Phytother Res. 2010;24:1554-61
10. Schnitzler P, Neuner A, Nolkempor S. et al. 2010. Antiviral activity and mode of action of propolis extracts and selected compounds. Phytother Res. 2010;24:S20-8
11. Quiroga EN, Sampietro DA, Soberón JR. et al. 2006. Propolis from the northwest of Argentina as a source of antifungal principles. J Appl Microbiol. 2006;101:103-10
12. Raghukumar R, Voli L, Watson D. et al. Antimethicillin-resistant Staphylococcus aureus (MRSA) activity of 'Pacific propolis' and isolated prenyl flavanones. Phytother Res. 2010;24:1181-7
13. Shahidi F, Ho C. Phenolics in food and natural health products: an overview. In: (ed.) Shahidi F, Ho CC. Phenolic Compounds in Foods and Natural Health Products. Washington, D.C: American Chemical Society. 2005:1-8
14. Trusheva B, Popova M, Bankova V. et al. Bioactive constituents of Brazilian red propolis. ECAM. 2006;3:249-54
15. Moreira L, Dias LG, Pereira JA. et al. Antioxidant properties, total phenols and pollen analysis of propolis samples from Portugal. Food Chem Toxicol. 2008;46:3482-5
16. Barth OM, Dutra VML, Justo RL. Pollen analysis of some samples of propolis from Southern Brazil. Ciência Rural. 1999;29:663-7
17. Genersch E, Forsgren E, Pentikainen J, Ashiralieva A, Rauch S, Kilwinski J, Fries I. Reclassification of Paenibacillus larvae subsp. pulvifaciens and Paenibacillus larvae subsp. larvae as Paenibacillus larvae without subspecies differentiation. Int J Syst Evol Microbiol. 2006;56:501-11
18. Gram HC. Über die isolierte Färbung der Schizomyceten in Schnitt-und Trockenpräparaten (in German). Fortschritte der Medizin. 1884;2:185-9
19. Yoshiyama M, Kimura K. Bacteria in the gut of Japanese honeybee, Apis cerana japonica, and their antagonistic effect against Paenibacillus larvae, the causal agent of American foulbrood. J Invertebr Pathol. 2009;102:91-6
20. NCCLS. Performance standards for antimicrobial susceptibility testing. National Committee for Clinical Laboratory Standards. 1999(Suppl 9):M100-S9
21. CLSI. Performance standards for antimicrobial susceptibility testing. Clinical and Laboratory Standards Institute document. 2011(Suppl 20):M100-S21
22. Kochansky J, Knox DA, Feldlaufer M. et al. Screening alternative antibiotics against oxytetracycline-susceptible and -resistant Paenibacillus larvae. Apidologie. 2001;32:215-22
23. Vermerris W, Nicholson RL. Phenolic compounds and their effects on human health. In: (ed.) Vermerris W, Nicholson R. Phenolic Compound Biochemistry. New York: Springer. 2008:235-55
24. Bonvehí JS, Gutiérrez AL. The antimicrobial effects of propolis collected in different regions in the Basque country (Northern Spain). World J Microb Biot. 2011;28:1351-8
25. Kalogeropoulos N, Spyros J, Konteles SJ. et al. Chemical composition, antioxidant activity and antimicrobial properties of propolis extracts from Greece and Cyprus. Food Chem. 2009;116:452-61
26. Kujumgiev A, Tsvetkova I, Serkedjieva Y. et al. Antibacterial, antifungal and antiviral activity of propolis of different geographic origin. J Ethnopharmacol. 1999;64:235-40
27. Gonsales GZ, Orsi RO, Fernandes A. et al. Antibacterial activity of propolis collected in different regions of Brazil. J Venom Anim Toxins Incl Trop Dis. 2006;12:276-84
28. Nieva Moreno MI, Isla MI, Cudmani NG. et al. 1999. Screening of antibacterial activity of Amaicha del Valle (Tucuman, Argentina) propolis. J Ethnopharmacol. 1999;68:97-102
29. Nowacka-krukowska H, Ludwicki JK. Determination of bromfenvinphos in bee products. Part II. Beeswax and propolis. Chemia Analityczna. 1999;44:235-42
30. Pereira AS, Silva JFM, Kiltzke R. et al. Pentacyclic triterpenoid alkanoates in propolis. Verlag der Zeitschrift für Naturforschung. 1999;54C:1115-8
31. Tazawa S, Warashina T, Noro T. Studies on the constituents of Brazilian propolis II. Chem Pharm Bull. 1999;47:1388-92
32. Chanchao C. Bioactivity of honey and propolis of Tetragonula laeviceps in Thailand. In: (ed.) Vit P, Pedro SRM, Roubik D. Pot-Honey, a Legacy of Stingless Bees. New York: Springer. 2013:495-506
33. Koru O, Toksoy F, Tunca YM. et al. In vitro antimicrobial activity of propolis samples from different geographical origins against certain oral pathogens. Anaerobe. 2007;13:140-5
34. Hegazi AG, Hady FK, Alloh FA. Chemical composition and antimicrobial activity of Uropean propolis. Verlag der Zeitschrift für Naturforschung. 2000;55C:70-5
35. Scheller S, Dworniczak S, Waldemar KK. et al. Synergism between ethanolic extract of propolis (EEP) and anti-tuberculosis drugs on growth of mycobacteria. Zeitschrift für Naturforschung C. 1999;54:549-53
36. Silva MSSS, de Lima G, Oliveira EH. et al. Anacardic acid derivatives from Brazilian propolis and their antibacterial activity. Ecletica Quimica. 2008;33:53-8
37. Celis C, Garcia A, Sequeda G. et al. Antimicrobial activity of extracts obtained from Anacardium excelsum against some pathogenic microorganisms. EJFA. 2011;23:249-57
38. da Silva JF, Sourza MC, Ramalho Matta SR. et al. Correlation analysis between phenolic levels of Brazilian propolis extracts and their antimicrobial and antioxidant activities. Food Chem. 2006;99:431-5
39. Bankova V, Popova M, Bogdanov S. et al. Chemical composition of European propolis: expected and unexpected results. Z Natuforsch. 2002;57c:530-3
40. Ahn MR, Kumazawa S, Usui Y. et al. Antioxidant activity and constituents of propolis collected in various areas of China. Food Chem. 2007;101:1383-92
41. Bonvehı´ JS, Gutie´rrez AL. Antioxidant activity and total phenolics of propolis from the Basque Country (Northeastern Spain). Am Oil Chem Soc. 2011;88:1387-95
42. Trevisan MTS, Pfundstein B, Haubner R. et al. Characterization of alkyl phenols in cashew (Anacardium occidentale) products and assay of their antioxidant capacity. Food Chem Toxicol. 2006;44:188-97
43. Gellerman JL, Anderson WH, Schlenk H. Synthesis of anacardic acids in seeds of Ginkgo biloba. Biochim Biophys Acta, Lipids Lipid Metab. 1976;431:16-21
44. Kim Y, Chung H. The effects of Korean propolis against foodborne pathogens and transmission electron microscopic examination. New Biotechnol. 2011 doi: 10.1016/j.nbt.2010.12.006
45. Satoh MS, Lindahl T. Role of poly(ADP-ribose) formation in DNA repair. Nature. 1992;356:356-8
Author contact
![]() Corresponding author: Chanpen Chanchao, Ph.D. Department of Biology, Faculty of Science, Chulalongkorn University, 254 Phayathai Road, Bangkok 10330, Thailand. E-mail: chanpenchula.ac.th; Tel.: +66 2 218 5380; Fax: +66 2 218 5386.
Corresponding author: Chanpen Chanchao, Ph.D. Department of Biology, Faculty of Science, Chulalongkorn University, 254 Phayathai Road, Bangkok 10330, Thailand. E-mail: chanpenchula.ac.th; Tel.: +66 2 218 5380; Fax: +66 2 218 5386.