Impact Factor ISSN: 1449-1907

 Global reach, higher impact
Int J Med Sci 2013; 10(13):1830-1836. doi:10.7150/ijms.6184 This issue Cite
Research Paper
Spontaneous Weight Change during Chronic Hepatitis C Treatment: Association with Virologic Response Rates
Hany R. Alwakeel1, Hasan E. Zaghla1, Nabeel A. Omar1, Hasan A. Alashinnawy1, Eman A. Rewisha1, Laura E. Matarese2, Azza A. Taha3, Hossam M. Kandil2 ![]()
1. Hepatology Department, National Liver Institute, Monufia University, Shibin Alkom, Egypt.
2. Brody School of Medicine, East Carolina University, Greenville, NC, USA.
3. Public Health Department, Medical College, Monufia University, Shibin Alkom, Egypt.
Received 2013-3-4; Accepted 2013-5-28; Published 2013-10-31
Abstract
Objective: We examined weight changes during chronic hepatitis C (CHC) therapy and association with virologic response.
Methods: Weight changes were compared between subjects achieving rapid, early, and sustained virologic response rates (RVR, EVR, and SVR). RVR, EVR and SVR were compared among patients with or without weight loss of ≥ 0.5 body mass index (BMI) units (kg/m2) at 4, 12, 48 weeks.
Results: CHC therapy was initiated in 184 cases. Median pretreatment BMI was 27.7 (18.4-51.3) with 38% overweight and 31% obese (BMI ≥25 and ≥ 30, respectively). Among patients with liver biopsies (n = 90), steatosis was present in 31.6%; fibrosis grade of 1-2/6 in 46%, 3-4 in 37.3% and 5-6 in 14.7%. Mean weight loss at 4, 12, 24 and 48 weeks of therapy were 1.2, 2.6, 3.8 and 3.3 kg, respectively. After 4 and 12 weeks of treatment, 38% and 54.3% had a BMI decrement of ≥ 0.5 kg/m2. For genotype 1, weight loss at 4 weeks was associated with significantly higher EVR (90.0% vs. 70%, p = 0.01) and a tendency towards better RVR and SVR (42.9% vs. 26.0% and 55.2% vs. 34.8%, respectively, p = 0.08). In multivariate analysis, weight loss at 4 weeks was independently associated with EVR (OR 6.3, p = 0.02) but was not significantly associated with RVR or SVR
Conclusions: Spontaneous weight loss at 4 and 12 weeks of CHC therapy was associated with improved EVR. Weight loss at 4 weeks was an independent predictor of EVR but not SVR.
Keywords: Weight change, hepatitis C, treatment outcomes, virologic response
Introduction
An estimated 3% of the world's population (170+ million persons) is infected with the hepatitis C virus (HCV) 1, 2. Of those infected, 20% to 50% will develop cirrhosis and its related complications 3. The recent addition of protease inhibitors has significantly improved the response rate to hepatitis C therapy 4,5. However, combination treatment with pegylated IFN alpha and Ribavirin remains a critical element in new treatment regimens 6 and identifying the predictors of viral response may be important in order to optimize triple combination therapy 7-9.
Several factors have been associated with treatment response including virologic and pharmacodynamic factors in response to interferon based therapy. The therapeutic effect of PEG-IFN plus Ribavirin therapy is dependent on the rapidity of the virologic response. RVR has been shown to predict SVR and is strongly associated with treatment response whereby patients who achieve RVR have a significantly higher chance of achieving SVR 10-12. In addition, pharmacodynamic factors reflected in cytopenias and weight loss encountered during therapy have been associated with higher treatment response 13-15. Higher SVR was associated with maximum weight loss 13, more than 5 kg weight loss 14 and with BMI ≤ 27 kg/m2 15 during PEG-IFN + Ribavirin therapy of CHC. Alternatively, blunted treatment response with less weight loss and less cytopenias were independent predictors of null response at week 20 of interferon therapy 16. Other factors associated with response include genetic factors such as Interleukin 28B polymorphism 17 patient race, age or HCV viral genotype, as well as potentially modifiable factors such as obesity and other metabolic syndrome components, particularly insulin resistance7.
Early predictors of treatment response before or early after start of therapy have the best chance of impacting treatment decisions. In this report, we examined the extent of weight change during the first 12 weeks of PEG-IFN + Ribavirin hepatitis C therapy and its relation to virologic response.
Materials and Methods
Patients
A retrospective review of electronic medical records of treatment-naïve hepatitis C patients with chronic hepatitis C confirmed by HCV-RNA referred between 2001 and 2009 for hepatitis C management to a single tertiary center was conducted. The study was approved by the Institutional Review Board (IRB).
In order to evaluate the effect of early weight loss on HCV therapy, patients were categorized into two weight loss groups (WL; those whose BMI decreased by 0.5 or more kg/m2 from pre-treatment BMI) and non-weight loss group (NWL; those whose BMI decreased less than 0.5 kg/m2, didn't change or increased). The cutoff point of 0.5 BMI was chosen as it represented the median loss in BMI at 4 weeks for the whole study group. Body mass index (BMI) was calculated as weight in kg divided by square meter of the height (kg/m2). Overweight or obesity was defined as BMI ≥ 25 or ≥ 30, respectively, for both men and women. Subjects were considered to have metabolic syndrome if they were obese (BMI ≥ 30 kg/m2) in addition to 2 or more of the following disorders: dyslipidemia, systemic hypertension, and diabetes.
Data analyzed included sex, race, liver steatosis type (micro, macro and mixed steatosis), presence of liver steatosis (fat globules involving more than 5% of liver parenchyma), percentage of liver parenchyma with steatosis, HCV genotype, peg-IFN type (α2a or α2b), virologic response rates by PCR, age, weight and BMI pre-treatment and at 1, 3, 6 and 48 weeks of therapy, treatment duration, pretreatment HCV RNA, liver fibrosis grade and pre-treatment ALT and AST. Cases with a history of alcohol or drug abuse, other etiologies of chronic liver disease or viral co-infection with hepatitis B or HIV were excluded. Pre-treatment data were used if they were within 3 months preceding the initiation of treatment. Post-treatment variables were taken at exact time ± 1 month.
Hepatitis C Therapy
Hepatitis C therapy consisted of peg-IFN-α2a at a dosage of 180 µg/week or 1.5 µg /kg/week for peg-IFN-α2b in combination with Ribavirin at a weight-based daily oral dose of 800 mg for <65 kg, 1000 mg for >65-85 kg, 1200 mg for >85-105 and 1400 mg for >105 kg body weight. Treatment doses were adjusted as clinically indicated.5 The completion of the HCV therapy course was defined as 80% or more of the IFN and Ribavirin doses. Rapid virologic response (RVR) was defined as an undetectable serum HCV RNA at 4 weeks. Early virologic response (EVR) was defined as ≥ 2 log drop of HCV RNA at 12 weeks of anti HCV therapy in relation to pretreatment RNA. Patients with undetectable virus at the end of treatment and again 24 weeks after completion of treatment were considered to have achieved a sustained virologic response (SVR).
Quantitative assessment of HCV RNA was done by in-house quantitative real-time RT-PCR assay, (version 2.0; Roche Diagnostics, Branchburg, NJ) and HCV genotyping was performed by sequence analysis of a portion of the 5`untranslated region of the viral genome using Inno-Lipa HCV2 Line Probe Assay (Innogenetics, Ghent, Belgium).
Statistical Analysis
Data analysis was completed using SPSS for Windows, version 17 (SPSS Inc. Chicago, IL). Descriptive statistics are presented as mean ± standard deviation for quantitative variables and as percentages for qualitative variables. Intent to treat analysis was used where data of all patients who received at least one dose of hepatitis C therapy was included in the analysis. The categorical variables were compared with Pearson's Chi-squared test or Fisher's Exact test as appropriate and, the continuous variables were compared with student t-test or Mann Whitney test according to the distribution type of data. In order to determine independent predictors of HCV response, factors significantly associated with virologic responses by univariate analysis were included in multivariate logistic regression model. Statistical significance was set at p value of 0.05 (two-tailed).
Results
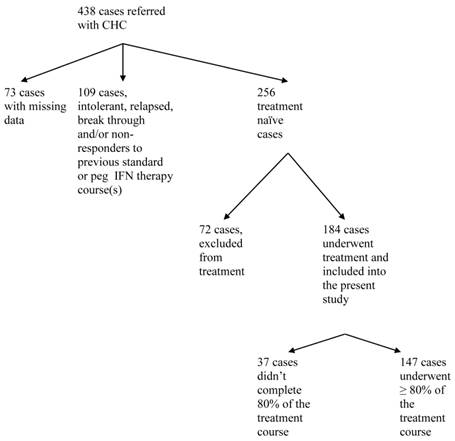
Between 2001 and 2009, 438 patients with chronic hepatitis C were referred to our center and consented to release their information for research purposes (Figure 1). Data were missing in 73 patients; 256 were treatment-naïve, of whom 184 cases (72 %) underwent treatment for Hepatitis C and were included in the study population. Hepatitis C therapy was not considered in 72 (16%) out of 438 patients. The decision not to start treatment was not affected by pre-treatment weight or BMI. The percentage of patients who were not treated was 31.9% and 27.8% for normal pre-treatment weight (BMI < 25) and overweight/obese (BMI ≥25) subjects, respectively, p = 0.52. The most common causes of non-treatment were, uncontrolled or active psychiatric disorders (n=12), alcohol abuse (n=11), decompensated liver disease (n=8), and refusal to receive current therapy or preferring to wait for a new regimen (n=7). Decompensated liver disease was a significantly more common cause for non-treatment among patients with BMI ≥ 25 kg/m2 versus those with BMI < 25 (p = 0.04). Other causes for non-treatment were not different among the various BMI groups. Out of 184 treatment naïve subjects, treatment was discontinued in 37 (20.1%) cases due to lack of tolerance and adverse effects associated with the therapy. The most common of these were psychiatric disorders (n=15, 8%), blood cytopenia (n=10, 9%), fatigue and eye disorders (n=8, 4%). There was no difference in the percentage of patients completing 80% or more of therapy among normal weight and overweight groups (80% and 78.9%, respectively, p = 0.9).
Study flow chart
Demographics
Demographic information is summarized in Table 1. The mean age was 47.7 ± 11.4 years (range 20.5 - 71.6) and 106 (57.6%) were males. There were more Caucasians n=146 (79.3%) than African Americans n= 19 (10.3%). The majority of the subjects had HCV genotype 1 (n=130, 70.7%) and the remainder had type 2 or 3. Pre-treatment body weight was 85.5 kg ± 21.2 (range 47.1 - 152.8). Overweight and obesity were observed in 70 (38%) and 57 (31%), respectively. Liver biopsies, available in 90 patients, demonstrated advanced fibrosis of 4-6/6 in 26 (19.5%) and steatosis in 37 (31.6%).
Baseline demographic and clinical characteristics of 184 treatment-naïve patients who underwent treatment for chronic hepatitis C and were included in the study.
| Variable | No (%) |
|---|---|
| Number of patient | 184 |
| Mean age in years ± SD, (range) | 47.7 ± 11.4 , (20.5-71.6) |
| Sex: Male, n (%) | 106 (57.6) |
| Race: n, (%) | |
| Caucasian | 146 (79.3) |
| African American | 19 (10.3) |
| Oriental | 14 (7.6) |
| Hispanic | 1 (0.54) |
| Unknown | 4 (2.2) |
| HCV Genotype: n, (%) | |
| 1 | 130 (70.7) |
| 2 | 35 (19) |
| 3 | 19 (10.3) |
| Mean pre-treatment weight (kg) ± SD, (range) | 85.5 ± 21.2, (47.1-152.8) |
| Median pre-treatment BMI (range) | 27.7 (18.4-51.3) |
| Metabolic Syndrome: n, (%) | 15 (8.2) |
| Categories based on pre-treatment BMI (kg/m2), n (%): | |
| Normal (BMI <25 kg/m2), | 49 (26.6) |
| Overweight (BMI ≥ 25 and < 30 kg/m2), n (%) | 70 (38) |
| Obese (BMI ≥ 30 kg/m2), n (%) | 57 (31) |
| Liver biopsy: n (%) | |
| Advanced Fibrosis of 4-6/6 | 26 (19.5) |
| Steatosis | 37 (31.6) |
Abbreviations: BMI = body mass index; n = number of patients; SD = standard deviation
Weight change during hepatitis C therapy
The mean weight change at 4 and 12 weeks of HCV therapy was -1.2 ± 3.7 and -2.6 ±5.2 kg, respectively (Table 2). Subjects with BMI ≥ 25 lost significantly more weight compared to normal weight subjects at all time points (Table 2). Thirty-eight percent (n = 70) and 54% (n = 100) had weight loss of 0.5 or more kg/m2 compared to pre-treatment BMI, at 4 and 12 weeks of HCV treatment, respectively (Table 3).
Mean weight changes in kg at different times of PEG-IFN and Ribavirin chronic hepatitis C therapy.
| Categories based on Pre-treatment BMI (kg/m2) | 4 weeks Mean ± SD | 12 weeks Mean ± SD | 24 weeks Mean ± SD | 48 weeks Mean ± SD |
|---|---|---|---|---|
| All patients | -1.2 ± 3.7 | -2.6 ± 5.2 | -3.8 ± 6.7 | -3.3 ± 6.6 |
| < 25, | -0.3 ± 2.8 | -0.9 ± 4.5 | -1.5 ± 5.4 | -1.0 ± 7.4 |
| ≥ 25 | -1.6 ± 3.9 | - 3.3 ± 5.3 | -4.7 ± 7.0 | -4.3 ± 8.1 |
| P value | 0.03 * | 0.00* | 0.00* | 0.04* |
All comparisons are made with respect to pre-treatment
P*: significant p value (< 0.05) for BMI < 25 versus ≥25.
Abbreviations: BMI, body mass index; PEG-IFN, pegylated interferon; m, meter; kg, kilogram.
Percentage of subjects who showed weight loss (≥ 0.5 BMI) at different times of chronic hepatitis C treatment.
| Categories based on pre-treatment BMI (kg/m2) | 4 weeks | 12 weeks | 24 weeks | 48 weeks |
|---|---|---|---|---|
| All, n (%) | 70 (38) | 100 (54.3) | 99 (58.8) | 61 (33.2) |
| <25, n (%) | 14 (31.1) | 23 (48.9) | 25 (54.3) | 15 (42.9) |
| ≥25, n (%) | 56 (48.7) | 77 (64.2) | 74 (64.9) | 46 (56.8) |
| P value | 0.04* | 0.07 | 0.21 | 0.16 |
Abbreviations: BMI, body mass index; n, number; m, meter; kg, kilogram.
Effect of weight loss on virologic responses
There was no significant difference in RVR, EVR or SV between patients with normal pre-treatment weight (BMI < 25) compared with overweight patients with pre-treatment BMI ≥ 25 (Table 4).
Effect of pre treatment BMI on virological responses.
| Pre-treatment BMI (kg/m2) | RVR | EVR | SVR | |||
|---|---|---|---|---|---|---|
| Genotype 1 | Genotype 2/3 | Genotype 1 | Genotype 2/3 | Genotype 1 | Genotype 2/3 | |
| < 25, n (%) | 10 (33.3) | 8 (88.9) | 31 (88.6) | 12 (100) | 13 (56.5) | 4 (80) |
| ≥ 25, n (%) | 21 (30.9) | 26 (92.9) | 60/81 (74.1) | 32/34 (94.1) | 22/60 (46.7) | 21/23 (91.3) |
| P value | 0.81 | 1.00 | 0.08 | 1.00 | 0.10 | 0.45 |
Abbreviations: BMI, body mass index; EVR, early virological response; n, number; RVR, rapid virological response; SVR, sustained virological response.
Weight change compared to pre-treatment weight was compared between patient with HCV genotype 1 with and without positive RVR, EVR and SVR (Table 5). Patients who achieved EVR lost significantly more weight at 4 and 12 weeks of therapy compared with those without EVR. Weight changes at 4, 12, and 48 weeks of therapy were not significantly different between those with or without RVR or SVR (Table 5). Virologic response rates were also compared between subjects with or without weight loss (>0.5 BMI) at 4 and 12 weeks of HCV therapy (Table 6). For hepatitis C genotype 1, WL group at 4 weeks was associated with significantly higher EVR versus NWL group (Table 6). The differences in RVR and SVR did not reach statistical significance (p = 0.08). The WL group at 12 weeks of therapy also had significantly higher EVR compared to NWL group (Table 6). There was no significant difference in SVR between WL and NWL at 12 weeks.
Weight changes from pre-treatment weight among subjects with chronic HCV Gen 1 with and without virologic response to HCV therapy with PEG-interferon + Ribavirin.
| RVR | EVR | SVR | ||||
|---|---|---|---|---|---|---|
| Negative | Positive | Negative | Positive | Negative | Positive | |
| Pre-treatment Weight P value | 83.2 ± 19.9 | 86.3 ± 18.8 0.5 | 87.0 ± 22.9 | 85.3 ± 19.8 0.5 | 85.7 ± 21.4 | 80.1 ± 19.9 0.5 |
| Wt change at 4 wks P value | -1.1 ± 0.5 | -1.7 ± 0.5 0.3 | 0.3 ± 0.5 | 1.5 ± 3.8 0.003 | 0.5 ± 3.6 | 1.3 ± 3.6 0.3 |
| Wt change at 12 wks P value | 0.9 ± 2.9 | 2.9 ± 5.5 0.01 | 1.9 ± 4.3 | 2.4 ± 5.4 0.3 | ||
| Wt change at 48 wks P value | 2.3 ± 6.7 | 2.1 ± 7.8 0.9 | ||||
P*: significant p value (< 0.05).
Data are mean + Standard deviation.
Positive = Pt achieved a positive response to HCV treatment
RVR = rapid virologic response, EVR = early virologic response and SVR = sustained virologic response
Virologic response rates in patients with HCV Genotype 1 with, versus those without, weight loss (BMI decrease by 0.5 or more kg/m2 from baseline pre-treatment BMI) at 4 and 12 weeks of PEG-IFN/Ribavirin therapy.
| RVR | EVR | SVR | |
|---|---|---|---|
| Weight changes at 4 weeks of HCV therapy | |||
| Weight Loss, n (%) | 18 (42.9%) | 40 (90.9%) | 16 (55.2%) |
| No weight loss, n (%) | 13 (26.0%) | 44 (71.0%) | 16 (34.8%) |
| P value | 0.08 | 0.01* | 0.08 |
| Weight changes at 12 weeks of HCV therapy | |||
| Weight Loss, n (%) | 55 (85.9%) | 18 (45%) | |
| No weight loss, n (%) | 34 (70.8)% | 15 (38.5%) | |
| P value | 0.049* | 0.55 | |
P*: significant p value (< 0.05).
Abbreviations: BMI, body mass index; EVR, early virologic response; NA, non-applicable; RVR, rapid virologic response; SVR, sustained virologic response; WL, weight loss.
RVR = rapid virologic response, EVR = early virologic response and SVR = sustained virologic response
Association of weight loss with virologic responses
Weight loss at 4 and 12 weeks of therapy was associated with EVR. Other factors associated with EVR were younger age, non-genotype 1, and lower liver fibrosis grade. In multivariate regression analysis, weight loss at 12 weeks remained an independent predictor of EVR (OR 6.25, 95% CI 1.3 - 33.3, p = 0.02). Weight loss at 4 and 12 weeks was not an independent predictor of RVR or SVR (Table 7).
Factors independently associated with virologic responses. All factors that were significantly associated with virologic responses by univariate correlation analysis were included in the multivariate regression analysis.
| Factor | OR | 95% CI | P value | |
|---|---|---|---|---|
| RVR | Age | 0.963 | 0.91 - 1.02 | 0.21 |
| Non genotype 1 HCV | 19.031 | 3.90 - 92.98 | 0.00* | |
| Pre-treatment HCV RNA load | 1.00 | 1.00 - 1.00 | 0.11 | |
| Pre treatment ALT | 6.25 | 1.3 - 33.3 | 0.02* | |
| EVR | Age | 0.975 | 0.91 - 1.04 | 0.45 |
| Non genotype 1 HCV | 8.906 | 0.98 - 81.02 | 0.05* | |
| Weight loss at 4 wks | 0.160 | 0.03 - 0 .77 | 0.02* | |
| Weight loss at 12 wks | 1.23 | 0.335 - 4.5 | 0.75 | |
| Liver fibrosis grade | 0.749 | 0.48 - 1.15 | 0.18 | |
| SVR | Non genotype 1 HCV | 15.152 | 3.394 - 67.642 | 0.00* |
| Age | 0.921 | 0.869 - 0.976 | 0.01* |
P*: significant p value (< 0.05).
Abbreviations: CI, confidence interval; OR, odds ratio.
RVR = rapid virologic response, EVR = early virologic response and SVR = sustained virologic response.
Discussion
Several studies have demonstrated that weight loss observed during hepatitis C Interferon based therapy is associated with response to therapy 13-15. Chung et al demonstrated a relation between maximum weight loss during therapy and treatment response (SVR, Relapse or breakthrough) versus non-responders. However, there was no weight loss between those with or without SVR13. On the other hand, Suwantarat et al demonstrated that weight loss of more than 5 kg at end of treatment was an independent predictor of SVR14. The timing of weight loss during HCV therapy and the relationship between early weight changes during the first 12 weeks of therapy and rapid and early virologic responses may be most valuable in optimizing treatment decisions. In addition, rapid and early virologic responses at 4 and 12 weeks of therapy are of great significance in predicting SVR 4,5,10-12 and determining the length of therapy in triple combination therapy4,5. The main objective of this study was to evaluate the relationship of spontaneous weight loss at different times of PEG-IFN plus Ribavirin therapy on treatment response.
In our study, overweight subjects at the start of therapy lost significantly more weight compared to subjects with normal weight. A similar observation was previously reported although not with statistical significance18. Our data indicate that among patients with HCV genotype 1, spontaneous weight loss of ≥ 0.5 kg/m2 at 4 and 12 weeks of PEG-IFN + Ribavirin therapy was associated with significantly higher EVR. In addition, after adjusting for other factors associated with EVR, weight loss at 4 weeks continued to be an independent predictor of achieving a positive EVR. Although not statistically significant, patients with weight loss at 4 weeks tended to have higher RVR and SVR versus patients without such weight loss. The mechanism of weight loss in PEG IFN + Ribavirin therapy is not well established. Loss of appetite and nausea are commonly encountered during HCV therapy. Changes in insulin, leptin and proinflammatory cytokines have been implicated18. Fioravante et al demonstrated that the weight loss during treatment was accompanied by a significant decrease in energy intake as assessed by 24-h recall. However, there was no change in resting energy expenditure19.
Several studies have shown obesity as a risk factor for non-response to IFN- based hepatitis C treatment. Obesity as indicated by body weight above 75 kg 7, body surface area above 2 meter square 17, and BMI ≥ 30 (kg/m2), 20,21 was an independent predictor of non-response to IFN- based HCV therapy. In our study, patients with normal pre-treatment BMI tended to have higher EVR and RVR compared to those with overweight or obesity with BMI ≥ 25 although these differences were not statistically significant. Other studies did not demonstrate a relationship between pre-treatment BMI and virologic response. For example, Zeuzem et al reported a negative effect of obesity as defined by surface area but not by weight or BMI 17.
Our study is limited by its retrospective design. Most of our patients were Caucasians (79%) with African Americans constituting only 10%. This may partially explain the higher rate of RVR and EVR in our study compared to previously reported rates.
Conclusion
In conclusion, spontaneous weight loss at 4 and 12 weeks of CHC therapy was associated with improved EVR and weight loss at 4 weeks was an independent predictor of EVR. However, weight loss at 4 and 12 weeks of therapy was not a predictor of SVR.
Acknowledgements
This study was supported by educational grant funded by the Egyptian ministry of the higher education.
Statement of authorship
Hossam Kandil and Eman Rewisha designed and conceived the study, developed the overall research plan and provided study oversight; Hany Alwakeel conducted the research, collected the data, provided suggestions for design, methodology and statistical analysis, interpreted the data and submitted the manuscript; Hasan Zaghla and Nabeel Omar wrote the paper; Azza Taha performed statistical analysis; Laura Matarese and Hossam Kandil reviewed and edited the manuscript, had primary responsibility for final content, provided the database essential for the research. All authors have read and approved the final manuscript.
Competing Interests
The authors have declared that no competing interest exists.
References
1. WHO. Global surveillance and control of hepatitis C. J Viral Hepat. 1999;6:35-47
2. NIH. NIH Consensus Statement on Management of Hepatitis C: 2002. NIH Consensus State Sci Statements. 2002;19:1-46
3. Liang TJ, Rehermann B, Seeff LB, Hoofnagle JH. Pathogenesis, natural history, treatment, and prevention of hepatitis C. Ann Intern Med. 2000;132:296-305
4. Poordad F, McCone J Jr, Bacon BR, Bruno S, Manns MP, Sulkowski MS. et al. Boceprevir for untreated chronic HCV genotype 1 infection. N Engl J Med. 2011;364:1195-1206
5. Sherman KE, Flamm SL, Afdhal NH, Nelson DR, Sulkowski MS, Everson GT. et al. Response guided telaprevir combination treatment for hepatitis C virus infection. New EnglJ Med. 2011;365:1014-24
6. Nelson D. Hepatitis C drug development at a crossroads. Hepatology. 2009;50:997-999
7. Fried MW, Shiffman ML, Reddy KR, Smith C, Marinos G, Goncales FL Jr. et al. Peginterferon alfa-2a plus ribavirin for chronic hepatitis C virus infection. N Engl J Med. 2002;347:975-982
8. Hadziyannis SJ, Sette H Jr, Morgan TR, Balan V, Diago M, Marcellin P. et al. Peginterferon-α2a and ribavirin combination therapy in chronic hepatitis C: a randomized study of treatment duration and Ribavirin dose. Ann Intern Med. 2004;140:346-355
9. Manns MP, McHutchison JG, Gordon SC, Rustgi VK. Shiffman M. Reindollar R. et al. Peginterferon alpha-2b plus Ribavirin compared with interferon alpha-2b plus Ribavirin for initial treatment of chronic hepatitis C: a randomized trial. Lancet. 2001;358:958-965
10. Davis GL, Wong JB, McHutchison JG, Manns MP. Harvey J. Albrecht J. Early virological response to treatment with peg-IFN-alfa-2b plus Ribavirin in patients with chronic hepatitis C. Hepatology. 2003;38:645-52
11. Jensen DM, Morgan TR, Marcellin P, Pockros PJ. Reddy KR. Hadziyannis SJ et al. Early identification of HCV genotype 1 patients responding to 24 weeks pegIFN alpha-2a (40 kd)/Ribavirin therapy. Hepatology. 2006;43:954-60
12. Yu JW, Wang GQ, Sun LJ, Li XG, Li SC. Predictive value of rapid virological response and early virological response on sustained virological response in HCV patients treated with pegylated IFN alpha-2a and Ribavirin. J Gastroenterol Hepatol. 2007;22:832-6
13. Chung RT, Poordad FF, Hassanein T, Zhou X. Lentz E. Prabhakar A. et al. Association of host pharmacodynamic effects with virologic response to pegylated interferon alpha-2a/Ribavirin in chronic hepatitis C. Hepatology. 2010;52:1906-14
14. Suwantarat N, Tice AD, Khawcharoenporn T, Chow DC. Weight loss, leucopenia and thrombocytopenia associated with sustained virological response to hepatitis C treatment. Int J Med Sci. 2010;7:36-42
15. Rodriguez-Torres M, Sulkowski MS, Chung RT, Hamzeh FM, Jensen DM. Factors associated with rapid and early virologic response to peginterferon alfa-2a/Ribavirin treatment in HCV genotype 1 patients representative of the general chronic hepatitis C population. J Viral Hepatitis. 2010;17:139-147
16. Lindsay K, Morishima C, Wright EC, Dienstag JL. Shiffman ML. Everson GT. et al. Blunted cytopenias and weight loss: new correlates of virologic null response to re-treatment of chronic hepatitis C. Clin Gastroenterol Hepatol. 2008;6:234-41
17. Zeuzem S, Feinman SV, Rasenack J, Heathcote EJ, Lai MY, Gane E, O'Grady J. et al. PegIFN alfa-2a in patients with chronic hepatitis C. N Engl J Med. 2000;343:1666-72
18. Seyam MS, Freshwater DA, O'Donnell K, Mutimer DJ. Weight loss during pegylated interferon and ribavirin treatment of chronic hepatitis C. J Viral Hepatitis. 2005;12:531-5
19. Fioravante M, Alegre SM, Marin DM, Silva Lorena SL, Periera TS, Soares EC. Weight loss and resting energy expenditure in patients with chronic hepatitis C before and during standard treatment. Nutrition. 2012;28:630-4
20. Bressler BL, Guindi M, Tomlinson G, Heathcote J. High body mass index is an independent risk factor for nonresponse to antiviral treatment in chronic hepatitis C. Hepatology. 2003;38:639-44
21. Walsh MJ, Jonsson JR, Richardson MM, Lipka GM. Purdie DM. Clouston AD et al. Non-response to antiviral therapy is associated with obesity and increased hepatic expression of suppressor of cytokine signaling 3 (SOCS-3) in patients with chronic hepatitis C, viral genotype 1. Gut. 2006;55:529-35
Author contact
![]() Corresponding author: Hossam M. Kandil, M.D, Ph.D. Brody School of Medicine, Division of Gastroenterology, Hepatology and Nutrition. 600 Moye Blvd, Greenville, NC 27834. Telephone: 252-744-4686 Fax: 252-744-8426. E-mail: kandilhedu
Corresponding author: Hossam M. Kandil, M.D, Ph.D. Brody School of Medicine, Division of Gastroenterology, Hepatology and Nutrition. 600 Moye Blvd, Greenville, NC 27834. Telephone: 252-744-4686 Fax: 252-744-8426. E-mail: kandilhedu