Impact Factor ISSN: 1449-1907

 Global reach, higher impact
Int J Med Sci 2013; 10(12):1746-1754. doi:10.7150/ijms.6887 This issue Cite
Research Paper
Circulating Progenitor and Mature Endothelial Cells in Deep Vein Thrombosis
Aline M Alessio1, Miriam P Beltrame3, Mariane C Flores Nascimento1 ![]() , Cristina P Vicente2, Juliana AP de Godoy2, Junia CR Santos Silva2, Luis Fernando Bittar1, Irene Lorand-Metze1, Erich V de Paula1, Joyce M Annichino-Bizzacchi1
, Cristina P Vicente2, Juliana AP de Godoy2, Junia CR Santos Silva2, Luis Fernando Bittar1, Irene Lorand-Metze1, Erich V de Paula1, Joyce M Annichino-Bizzacchi1
1. Hematology and Hemotherapy Center, University of Campinas, Campinas-SP, Brazil.
2. Department of Anatomy, Cell Biology, Physiology and Biophysics, Institute of Biology, University of Campinas, Campinas - SP, Brazil.
3. Department of Hematology, Federal University of Paraná, Curitiba-PR, Brazil.
Received 2013-6-11; Accepted 2013-10-7; Published 2013-10-14
Abstract
Introduction: Mature circulating endothelial cells (CEC) and circulating endothelial progenitor cells (EPC) have been described in several conditions associated with endothelial injury. Their role in deep vein thrombosis (DVT) has not been previously evaluated. Patients and Methods: In this pilot study we evaluated the time course of CEC and EPC release after vena cava experimental DVT in mice, using the FeCl3 model. We also evaluated their presence in patients with DVT at different phases of the disease (acute and chronic phase). CEC and EPC were evaluated by Flow Cytometry. Results: In mice, both CEC and EPC were increased 24 hours after DVT induction, peaking 48 hours thereafter. After 72 hours, CEC counts decreased sharply, whereas EPC counts decreased less substantially. In DVT patients we observed a significant increase in CEC counts immediately after DVT compared to healthy individuals. Patients with chronic disease also presented a significant elevation of these cell count. In a subgroup of patients for whom serial samples were available, CEC counts decreased significantly after 9-15 months of the acute event. Conclusions: Our results suggest the participation of these cells in the reparative processes that follows DVT, both at immediate and late time-points. The different kinetics of CEC and EPC release in experimental DVT suggests a heterogeneous role for these cells in the reparative events after DVT.
Keywords: progenitor endothelial cells, mature endothelial cells, flow cytometry, deep vein thrombosis, DVT animal model.
Introduction
Mature circulating endothelial cells (CEC) were first described in 1970 [1,2] and have been recognized as markers of vascular injury [3]. CEC can be derived from the vascular wall (mature CEC), or recruited from the bone marrow, as endothelial progenitor cells (EPC) [4], in response to various stimuli such as ischemia, vascular trauma [5], acute myocardial infarction [6], sickle cell anemia [7], vasculitis [8], and pulmonary hypertension [9]. The presence of these cells has also been associated with angiogenic potential [10].
CEC and EPC are extremely rare events in peripheral blood, where they represent between 0.01% and 0.0001% of mononuclear cells [10,11]. Despite the lack of a clear consensus on their phenotypic definition, CEC are generally identified as cells expressing endothelial markers (CD 146, CD 144, vWF, VEGFR-2) in the absence of hematopoietic (CD 45, CD 14) and progenitor (CD 34, CD 133) markers [8,10,12,13]. Similarly EPC are defined by the presence of at least one marker of immaturity and one marker of the endothelial lineage [14-16]. However, although many different panels have been proposed to characterize EPC, no consensus has been reached about their precise phenotype.
The pathogenesis of deep vein thrombosis (DVT) involves alterations of blood flow, blood components and endothelial injury. Previous studies have shown that cells derived from the bone marrow can be identified within a venous thrombus 7 and 14 days after partial ligation of the inferior vena cava in mice, and that CEC counts increase after thrombus induction [17]. However, to our knowledge, no study investigated the presence of CEC in with DVT in the clinical setting. Therefore, the aim of our study was to investigate the presence of CEC and EPC after DVT in humans in different time-points of their disease course, and to correlate our findings with the time-course of CEC and EPC detection in an experimental model of DVT in mice.
Methods
Patients with DVT
Patients with DVT at diagnosis (acute DVT), between 18 and 60 years of age, were recruited from 3 hospitals in Campinas, SP, Brazil. Samples were collected between December 2007 and May 2008. The diagnosis of DVT was confirmed by Doppler ultrasonography. Patients in whom DVT was associated with endothelial injury, such as trauma, cancer, antiphospholipid antibodies, surgery within the last 3 months, pregnancy, renal or hepatic disease were excluded from the study. The pre-existing conditions presented by patients with acute DVT were: Factor V Leiden mutation in one patient and oral contraceptive use in two patients. In addition, 3 patients presented hypertension, 2 presented diabetes and 1 presented obesity.
A second group of patients (chronic DVT) was composed by individuals 1-3 years after withdrawal of warfarin therapy, which were recruited from the Outpatient Clinic of Hemocentro de Campinas / UNICAMP, between February and September 2009. In this group of patients, two presented the Factor V Leiden mutation, and two were using oral contraceptives at the moment of DVT. In addition, 3 presented hypertension, 2 presented diabetes and 1 was obese.
In order to minimize the environmental interference, the control group was composed by healthy individuals who lived at the same geographic region of the patients, matched by age and gender. Individuals with a personal or familial history of DVT before the age of 50 years-old were not included as controls.
The clinical and demographic characteristics of all the individuals included in this study are shown in Table 1.
Clinical and demographic data from patients with deep vein thrombosis (DVT) and controls
| Control (n = 11) | Acute DVT (n = 9) | Chronic DVT (n = 11) | P | |
|---|---|---|---|---|
| Age* (years) | 29 (21 - 52) | 45 (26 - 54) | 44 (28 - 56) | 0.5** |
| Time between DVT and sample collection* (months) | - | - | 10.5 (4 - 36) | - |
| Gender (female:male) | 9:2 | 7:2 | 6:4 | 0.4† |
| DVT site (distal:proximal) | - | 1:8 | 6:4 | 0.06† |
| Use of OC | 1 (9.0%) | 2 (22.2%) | 2 (18.2%) | 0.1† |
| Previous history of DVT | 0 | 1 (11.1%) | 1 (9.0%) | 0.5† |
OC (oral contraceptives); * Median (range); ** Mann-Whitney test; † Fisher's exact test.
Whole blood (10mL) samples were collected from all individuals into EDTA-containing tubes. In addition, a second sample was obtained from patients from the acute DVT group between 9-15 months after the diagnosis (follow-up). A complete blood count was performed immediately after sample collection on Cell Dyn 1700® (Abott Laboratories, North Chicago, IL, USA).
The study was approved by the Local Ethics Committee and all the individuals signed a written informed consent. All the procedures utilized in this study were in agreement with the Declaration of Helsinki.
FeCl3-induced vein thrombosis model in mice
Vein thrombosis was induced in 8-weeks old C57Bl/6 male mice with FeCl3, according to a previously described method [18]. Briefly, after intramuscular anesthesia with ketamine (100mg/kg) and xylazine (20mg/kg), the inferior vena cava (IVC) was exposed by blunt dissection between the renal and the iliolumbar veins. A piece of filter paper (3mm x 1mm) presaturated with a 15% FeCl3 solution was placed over the IVC for 30 seconds. IVC occlusion by the thrombus was confirmed using a perivascular flow probe (Model 0.5 PB, Transonic Systems, Ithaca, NY, USA). The incisions were closed after the procedures, and the animals were monitored for specific time-points (15, 30 and 45 minutes; 1, 24, 48 and 72 hours; n=5-8 animals per time-point), at which the abdominal was re-opened, and blood and histological samples were collected. During these periods, the animals were treated with analgesic if they presented signs of pain. At each time-point, 800 µL of blood was collected by cardiac puncture in EDTA and immediately processed. In addition, a 10-mm sample of the IVC containing the thrombus and the abdominal aorta was cut out and embedded in OCT compound. Next, transverse 10 μm frozen sections were obtained at 100 μm intervals. Verhoff van Gienson staining was applied in order to measure the size of IVC lumen and to estimate its occupation by the vein thrombus. The total thrombus area was calculated using ImageJ software® (U. S. National Institutes of Health, Bethesda, MD, USA).
CEC and EPC were analyzed inside the thrombus by immunofluorescence, based on a previously described protocol [10]. Briefly, samples were fixed with acetone at 4ºC for 20 minutes and washed for 5 minutes with PBS. After that, samples were incubated with boiling and cold 10mM of sodium citrate (pH=6) solutions, for 30 minutes each. After washing with PBS for 5 minutes, blockage was performed for 20 minutes with 0.05% PBS/BSA. The primary antibodies were diluted with PBS/BSA 0.05% and incubated at 37ºC for 1 hour, or overnight at 4ºC. Finally, anti-rat secondary antibodies conjugated with FITC (cat. 81-9511, Invitrogen, Carlsbad, US), Cy5 (cat. 81-9516, Invitrogen) and DAPI were used. CEC were identified by the positivity for CD 31, whereas EPC were identified by the positivity for CD 34 and Sca1.
For the histochemical staining, slides were fixed in acetone at 4°C for 20 minutes, and incubated in a 5% hematoxylin, 29% FeCl3, Weigerts solution and deionized water at 25°C for 10 minutes. Next, slides were incubated with 2% FeCl3, washed in 95% ethanol and water, stained with Van Gienson solution and dehydrated.
All animal experiments were approved by the University Committee of Ethics in Animal Experimentation (protocol 2121-1).
Monoclonal antibodies
The following antibodies were used in immunohistochemistry studies: CD 31 monoclonal antibody (clone 390, Caltag-Medsystems Ltda., Buckingham, UK), CD 34 (clone RAM34, eBioscience, San Diego, USA) and Sca1 (clone D7, Becton Dickinson, Sparks, USA). Antibodies used for flow cytometry are listed in table 2.
List of antibodies used in flow cytometry studies.
| Antigen | Species | Clone | Fluorochrome* | Manufacturer |
|---|---|---|---|---|
| CD31 | Human | MBC78.2; PECAM1.2 | FITC | Invitrogen |
| CD31 | Mouse | 390 | FITC | Caltag-Medsystems |
| CD34 | Human | 8G12 | FITC | BD |
| CD34 | Mouse | RAM34 | FITC | eBioscience |
| CD45 | Human | 2D1 | PerCP | BD |
| CD45 | Mouse | 30-F11 | PerCP | BD |
| CD133 | Human | AC133 | APC | Miltenyi |
| CD144 | Human | TEA1/31 | PE | Beckman Coulter |
| CD146 | Human | P1H12 | PE | BD |
| VEGFR-2 | Human | 89106 | PE | R&D |
| VEGFR-2 | Mouse | AVAS 12α1 | PE | BD |
| Sca1 | Mouse | D7 | FITC | BD |
| IgGs | Human | - | FITC | Dako |
| PE | ||||
| PerCP | ||||
| APC |
* FITC: Fluorescein isothiocyanate , PE: Phycoerthrin; PerCP: Peridinim chlorophyll, APC: Allophycocyanin.
Quantification of CEC and EPC in humans and mice
In humans, leukocyte counts were adjusted to 5 - 10 x 103/μL on blood samples. Blood (100 µL) and the previously titrated monoclonal antibodies (5 µL) were incubated for 20 minutes at 4°C in the dark. After the incubation, erythrocytes were lysed with 2 mL of 1:10 diluted FACS lysing buffer (Becton Dickinson) and incubated again for 10 minutes. The remaining leukocytes were washed with 2 mL 2% PBS/BSA (pH=7.4) and the tubes were centrifuged 500 g for 5 minutes and finally resuspended in 500 μL of wash buffer. The acquisition was performed by a FACScalibur flow cytometer (Becton Dickinson, San Jose, CA, USA) and analyzed by Cell-Quest and Paint-a-Gate softwares (BD, Bioscences).
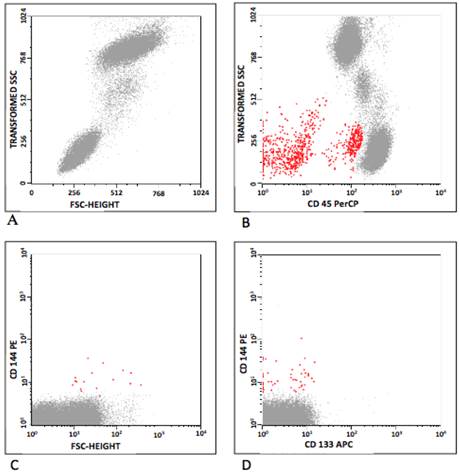
In humans, CEC and EPC were defined according to Khan and colleagues [10], and the classification is summarized in Table 3. CEC were defined as positive events to CD 31, CD 144, CD 146 and negative to CD 45 and CD 133. As CD 34 may be positive or negative [4,19,20] EPC were defined as positive events to CD 34, CD 133, CD 144, CD 146, VEGFR-2, and negative to CD 34, CD 45 and CD 31. Figure 1 represents some flow cytometry steps during the CEC and EPC analyses, where the selected populations are shown in red. Initially, the background was removed by the analyses of isotype control antibodies. The debris were excluded on the FSC/SSC plot (Figure 1A), and so were leukocytes on CD 45/SSC plot (Figure 1B). The CEC were gated on CD 31/CD 45, CD 144/CD 45 and CD 146/CD 45 plots (Figure 1C). The analysis for EPC was similar, observing the positivity for CD 133. Then, a gate was drawn in the CD45-/dim, CD144+ (CD146 or VEGFR-2) and CD31+ plots. EPC were classified into CD133+ and/or CD34+ (Figure 1D).
Characterization of CEC and EPC in mice and humans by flow cytometry.
| Mice | Mice (alternative panel) | Humans | Humans (alternative panel) | ||||||
|---|---|---|---|---|---|---|---|---|---|
| ( + ) | ( - ) | ( + ) | ( - ) | ( + ) | ( - ) | ( + ) | ( - ) | ||
| CEC | VEGFR-2 | CD45 | CD31 | CD45 | CD31 | CD45 | CD31 | CD45 | |
| Sca1 | CD34 | CD144 | CD133 | CD34 | |||||
| VEGFR-2 | CD146 | CD34 (sub) | VEGFR-2 | ||||||
| CD34 | |||||||||
| EPC | CD34 | CD45 | CD34 | CD45 | CD34 | CD45 | CD34 | CD45 | |
| VEGFR-2 | VEGFR-2 | CD31 | CD133 | CD31 | VEGFR-2 | CD31 | |||
| Sca1 | CD144 | ||||||||
| CD146 | |||||||||
| VEGFR-2 | |||||||||
Flow cytometry analyses, showing (A) distribution by forward-scatter (FSC) vs side-scatter (SSC); (B) CD 45 vs SSC (red); (C) EPC population (CD 144 vs FSC) and (D) CEC population (CD 144 vs CD 133). Debris were excluded on the FSC/SSC plot (A), as were leukocytes on CD 45/SSC plot (B). The CEC were gated on CD 31/CD 45, CD 144/CD 45 and CD 146/CD 45 plots (C). The analysis for EPC was similar, observing the positivity for CD 133. A gate was then drawn in the CD45-/dim, CD144+ (CD146 or VEGFR-2) and CD31+ plots. EPC were classified into CD133+ and/or CD34+ (D).
In mice, CEC were defined as positive cells to VEGFR-2 and negative to Sca1 and CD 45 [21]. EPC were defined as positive events to CD 34, VEGFR-2, Sca1 and negative to CD 45.
Due the multiplicity of antibodies available to the CEC and EPC analyses, and the lack of consensus about the best choice to their characterization, alternative panels were also applied in an attempt to confirm the CEC and EPC data in the analyses. In humans and mice, CEC were also analyzed as positive events to CD 31, CD 34 and VEGFR-2, and negative to CD 45, and the EPC were analyzed as positive events to CD 34 and VEGFR-2 and negative to CD 45 and CD 31.
During standardization, 300.000 cells were acquired and the percentage of CEC and EPC were very similar to results obtained during acquisition of 50,000 and 100,000 cells in mice and humans samples, respectively. So, these lower counts were subsequently used. In animals, the results of CEC and EPC were expressed as percentage, since the blood volume was not sufficient to perform all analyses and leukocyte counting. In humans, the percentage of CEC and EPC were calculated separately, by multiplying the percentage of positive events to the number of leukocytes/μL and dividing the result per 100.
Statistical Analysis
Data are presented as means ± SEM, or as medians and ranges. Fisher or chi-square tests were applied to compare categorical variables, and Mann-Whitney test was used to compare continuous variables. For comparison of paired variables, the Wilcoxon test was applied. Analyses were performed using the R Development Core Team 2010 software (Vienna, Austria), and the P < 0.05 values were considered statistically significant.
Results
CEC and EPC in patients with DVT
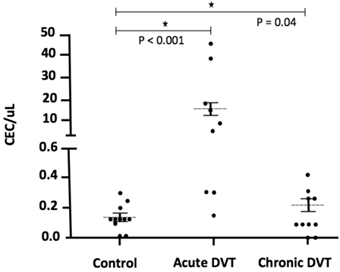
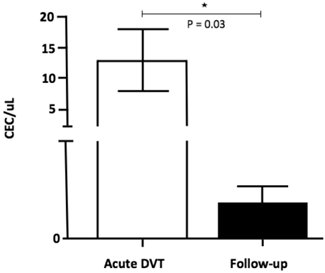
The number of CEC was significantly higher 24-72 hours after the DVT episode [5.0 (0.3 - 45.0)] when compared to healthy individuals [0.1 (0 - 0.3); p <0.001] and to chronic patients [0.2 (0.1 - 0.5); p = 0.04] (Figure 2). In addition, CEC count was significantly higher at diagnosis when compared to the follow-up collection after 9-15 months in four of the five patients for whom serial samples were available [0.4 (0 - 0.7); p = 0.03] (Figure 3). EPC were consistently absent during the entire experiments, despite the use of several markers.
CEC counts in DVT patients at specific time-points, as on acute DVT (24-72 hours after the episode) and on chronic DVT patients). A significant elevation of CEC counts can be observed in six of nine patients, both at immediate and late time-points after DVT compared to healthy controls.
CEC counts in patients at specific time-points: on acute DVT (24-72 hours after the episode) and on the follow-up (9-15 months after the diagnosis). A significant increase in CEC (CD 31+ CD 146+ CD 45- CD 133-) counts was observed at immediate DVT in comparison to the late episode (P = 0.03; Willcoxon test).
Time-course of CEC release in a mouse model of DVT
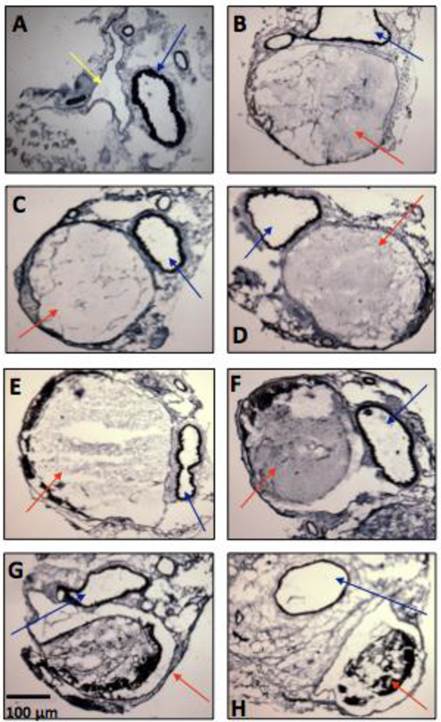
Thrombus formation was observed in all mice. The Verhoff van Gienson coloration allowed the observation of the vein thrombus inside the IVC (15, 30 and 45 minutes; 1, 24, 48 and 72 hours (Figure 4). Total occlusion occurred between 15 minutes and 1 hour. After that, the IVC showed a partial occlusion, decreasing from from 85.4% after 24h to 65.3% after 48h, and to 51.1% after 72h. Signs of recanalization could be observed by histological analyses, 24 hours after DVT induction. The analysis of the total area of the thrombus showed a decrease from 100% after 1 hour to 80.35 ± 4.27 % at 24h; 63.50 ± 5.06 % at 48h and 54.95 ± 3.44 % at 72h (n=4 per time-point).
Representative microphotographs of vein thrombosis in mice inferior vena cava, several time-points after thrombosis induction with FeCl3 (n = 5-8 animals per time-point). (A) Baseline, (B) 15 minutes, (C) 30 minutes, (D) 45 minutes, (E) 1 hour, (F) 24 hours, (G) 48 hours, (H) 72 hours. Color arrows indicate the inferior vena cava (yellow arrow), the thrombi (red arrows) and the descending aorta artery (blue arrows).
The immunofluorescence staining did not show endothelial (CD 31+) and progenitor cells (CD 34+/Sca1+) inside and on the periphery of the vein thrombus. Endothelial cells could be visualized on the endothelial surface of the abdominal aorta and on the arterioles, after 1 hour (n = 5-8 animals per time-point; data not shown).
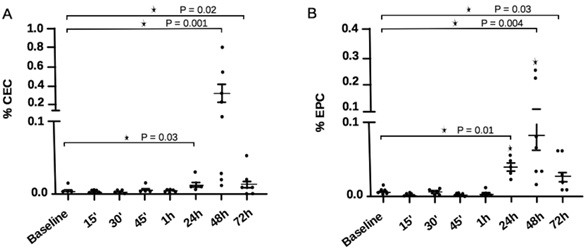
The percentage of CECs and EPCs in experimental DVT are shown in Figure 5 as determined by FACS analysis. CEC counts were significantly higher 24 hours after DVT induction [0.01 (0.006 - 0.03)] in comparison to baseline [0.004 (0.002 - 0.02); P = 0.03], reaching peak values 48 hours after DVT [0.115 (0.01 - 0.87); P = 0.001], and decreasing substantially after 72 hours [0.007 (0 - 0.04); P = 0.03]. EPC presented a similar behavior to CEC, with higher counts 24, 48 and 72h after DVT. However, at the 24 and 72h time-points, counts were slightly higher in comparison to CEC levels at similar time-points. When data were analyzed using the alternative panels, CEC and EPC results were similar to those obtained on the standard panels, except for the fact that EPC peaked 48h after DVT induction, and remained significantly higher until the 72 hour time-point (data not shown).
CEC and EPC counts in experimental DVT at different time-points. (A) CEC showed a significant elevation 24 hours after DVT induction, with peak counts after 48 hours. After 72 hours, CEC counts decreased sharply. (B) EPC showed significant elevation at 24 hours, peaking after 48 hours after DVT induction. EPC counts also decreased at 72 hours, less sharply than CEC. *P<0.05, Mann-Whitney test.
Discussion
Hypercoagulability, alterations in blood flow and endothelial injury/dysfunction have been recognized as key elements on the pathogenesis of DVT since 1856 [22]. Among these elements, endothelial alterations are probably the less studied due do intrinsic difficulties of such investigation. Endothelial cells produce prostacyclin and nitric oxide, which show anti-thrombotic effects by increasing platelet cellular cyclic adenosine monophosphate (cAMP) and cyclic guanosine monophosphate (cGMP) [23]. It has also been suggested that EPC participate in the processes of post-natal angiogenesis [24-27]. Accordingly, despite difficulties in the characterization of these cells, it is possible to speculate that CEC and EPC participate in processes such as vessel recanalization and repair after DVT.
Prior studies in animal models of normal or induced vascular growth after injury suggest that proliferating clusters of endothelial cells are apparent in vessels without signs of vascular denudation, supporting the theory of endogenous endothelial replacement [28-30]. Moreover, Rafii and collegues [31] suggested that if large areas of endothelium are removed and/or damaged, greater influx of circulating cells ensues as a first response to injury. In this instance, a host of circulating hematopoietic cells, along with platelets, would readily attach to damaged areas. Accordingly, these cells could also play a role on reparative events following the DVT. So, to gain further knowledge about the participation of CEC and EPC in venous thromboembolism, we evaluated their presence in several phases after DVT in humans and also explored the time-course of CEC and EPC release in a mouse model of DVT.
The total occlusion of the lumen of mice IVC by the thrombus, between 15 minutes and 1 hour, occurred as previously described [18]. The total thrombus area decreased after 1 hour, and continued to do so until the last time-point (72h), indicating the occurrence of recanalization. The presence of the CEC and EPC on regions where the flow were reestablished after 1 hour suggest a role for these cells at some part of this process. Li and coworkers [32] observed a substantial increase in VEGF, angiopoietin-1 and monocyte chemotactic protein-1 (MCP-1) levels by real-time PCR and Western blotting, when bone marrow-derived EPCs were transplanted into a rat model of venous thrombosis. These microenvironment changes culminated in thrombi organization and recanalization, but it remains speculative if these changes were part of the reparative processes or only biomarkers of endothelial injury.
In our animal analyses, EPC counts were higher in comparison to CEC at 24 and 72 hours. The persistence of EPC elevation, even after CEC counts returned to the baseline could indicate a more active participation of EPC in the response to injury after DVT, and a more passive role of CEC. In acute myocardial infarction (MI), the number of circulating EPCs was markedly increased from the early phase of the disease, with peak values on day 7, that returned to baseline within 60 days [33]. In addition, plasma VEGF levels were closely related to circulating EPC numbers. In addition, the active participation of EPC in regenerative processes has been demonstrated during revascularization in response to tissue ischemia [34].
To our knowledge, CEC and EPC have not been previously evaluated in humans in the context of venous thromboembolism. In this study, both groups of DVT patients presented higher CEC counts in comparison to healthy individuals, and the acute DVT group showed higher counts than chronic DVT patients. These results are in accordance with our results obtained in the animal model. Our results do not define whether CECs are associated with vessel injury and repair, or represent a biomarker of inflammation associated with DVT. Results obtained in the chronic DVT group suggest that inflammation is at least in part associated with increased CEC counts in the context of DVT. In the future, similar studies in patients with post-thrombotic syndrome, in which the process of vessel repair is no longer active, could further clarify this issue.
As on previous studies, the EPCs were extremely rare in our patients. The literature has shown an inverse correlation between the number of EPCs and presence of atherosclerosis and cardiovascular dysfunction in human subjects [35-37]. However, it has also been speculated that the studies with EPC might not really reflect the number of these cell in the circulation, due to difficulties in characterizing these cells [10].
Studies with CEC and EPC are always complicated by the lack of consensus regarding the surface markers that identify these [38-40]. As Timmermans and coworkers [41] appropriately pointed, if an EPC is defined as an immature precursor cell that displays postnatal vasculogenic activity, they should be capable for forming new CECs and blood vessels in vivo. However, this definition has often yielded conflicting results and created obstacles to the direct comparison of data. Nevertheless, several investigators have suggested that haematopoietic-derived cells may contribute to vascular [42-44].
Despite this lack of consensus, and the fact that antigen expression may be variable on endothelial cells, and that other cell lines with overlapping phenotypes have been described, we obtained similar results in mice and in DVT patients, supporting the biological relevance of our data, as well as the definition of CEC and EPC used in this study. Moreover, in order to minimize the impact of these potential biases, all analyses of this study were performed using a co-called alternative panel for both CEC and EPC, with which similar results were obtained.
Our study has several limitations. The most important one is the already mentioned difficulty in characterizing CEC and EPC. We tried to minimize this by confirming our results with an alternative panel. In addition, the fact that we obtained similar results in humans and mice strengthens our results. Second, the use of beads to isolate CEC and EPC could have strengthened our results. Third, the number of patients included in this study is relatively small to make definitive conclusions. However, our idea was to perform a pilot and exploratory study comparing results obtained in humans with those obtained in animal models. We do not intend by any means to suggest that CEC and EPC should be considered biomarkers of DVT, or that our data define the roles of these cells in DVT.
In conclusion, we demonstrated an increase in CEC count in humans after an acute episode of DVT. We also demonstrated that these cell counts remain significantly elevated at later time-points (chronic DVT and acute DVT at follow-up), when compared to healthy individuals. Overall, these trends were confirmed in a more controlled model of experimental DVT in mice, in which both CEC and EPC counts were increased after DVT induction peaking 48 hours after the acute event. Together, these data suggest that EPC and CEC might have a role in the early and late phases of vessel repair in the context of DVT, as mentioned in other conditions associated with endothelial injury. However, the precise role of these cells in these processes, whether as active players in vessel repair, or as mere biomarkers of endothelial injury, remains to be determined.
Abbreviations
CEC: mature circulating endothelial cells; CEP: endothelial progenitor cells; DVT: deep vein thrombosis; FITC: fluorescein isothiocyanate; PE: phycoerthrin; PerCP: peridinim chlorophyll; APC: allophycocyanin; IVC: inferior vena cava; FSC: forward-scatter; SSC: side-scatter; cAMP: cyclic adenosine monophosphate; cGMP: cyclic guanosine monophosphate; MCP-1: monocyte chemotactic protein-1; OC: oral contraceptives.
Acknowledgements
The authors would like to thank Roberto Zulli for the statistical analyses, and the staff of the Molecular Markers and Hemostasis Laboratory for their expert technical assistance. This work was supported by research funds from FAPESP and CNPq, Brazil. The Hematology and Hemotherapy Center (UNICAMP) are part of the National Institute of Blood, Brazil (INCT de Sangue, CNPq/MCT/FAPESP).
Competing Interests
The authors have declared that no competing interest exists.
References
1. Bouvier CAGE, Cintron JR, Bernhardt B. et al. Circulating endothelium as an indicator of vascular injury. Thromb Diath Haemorrh. 1970;40:163-8
2. Hladovec J, Rossamann P. Circulating endothelial cells isolated together with platelets and the experimental modification of their counts in rats. Thromb Res. 1973;3:665-74
3. Dignat-George F, Sampol J. Circulating endothelial cells in vascular disorders: new insights into an old concept. Eur J Haematol. 2000;65:215-20
4. Asahara T, Murohara T, Sullivan A. et al. Isolation of putative progenitor endothelial cells for angiogenesis. Science. 1997;275:964-7
5. Rafii S, Lyden D, Benezra R. et al. Vascular and haematopoietic stem cells: novel targets for anti-angiogenesis therapy? Nat Rev Cancer. 2002;2:826-35
6. Damani S, Bacconi A, Libiger O. et al. Characterization of circulating endothelial cells in acute myocardial infarction. Sci Transl Med. 2012;4(126):126ra33
7. Solovey A, Lin Y, Browne P. et al. circulating activated endothelial cells in sickle cell anemia. N Engl J Med. 1997;337:1584-1590
8. Woywodt A, Streiber F, de Groot K. et al. circulating endothelial cells as markers for ANCA-associated small-vessel vasculitis. Lancet. 2003;361:206-10
9. Bull TM, Golpon H, Hebbel RP. et al. circulating endothelial cells in pulmonary hypertension. Thromb Haemost. 2003;90:698-703
10. Khan SS, Solomon MA, McCoy JP Jr. Detection of circulating endothelial cells and endothelial progenitor cells by flow cytometry. Cytometry B Clin Cytom. 2005;64:1-8
11. Dignat-George F, Sampol J, Lip G. et al. circulating endothelial cells: realities and promises in vascular disorders. Pathophysiol Haemost Thromb. 2004;33(5-6):495-9
12. Peichev M, Naiyer AJ, Pereira D. et al. Expression of VEGFR-2 and AC133 by circulating human CD 34(+) cells identifies a population of functional endothelial precursors. Blood. 2001;95(3):952-8
13. Jacques N, Vimond N, Conforti R. et al. Quantification of circulating mature endothelial cells using a whole blood four-color flow cytometric assay. J Immunol Methods. 2008;337:132-43
14. Ziegler BL, Valtieri M, Porada GA. et al. KDR receptor: a key marker defining hematopoietic stem cells. Science. 1999;285:1553-8
15. Friedrich EB, Walenta K, Scharlau J. et al. CD 34-/CD 133+/VEGFR-2+ endothelial progenitor cell subpopulation with potent vasoregenerative capacities. Circ Res. 2006;98:E20-5
16. Fadini GP, Baesso I, Albiero M. et al. Technical notes on endothelial progenitor cells: ways to escape from the knowledge plateau. Atherosclerosis. 2008;197:496-503
17. Modarai B, Burnand KG, Sawyer B. et al. Endothelial progenitor cells are recruited into resolving venous thrombi. Circulation. 2005;111:2645-53
18. Wang X, Smith PL, Hsu MY. et al. Murine model of ferric chlorideinduced vena cava thrombosis: evidence for effect of potato carboxypeptidase inhibitor. J Thromb Haemost. 2006;4:403-10
19. Quirici N, Soligo D, Caneva L. et al. Differentiation and expansion of endothelial cells from human bone marrow CD 133(+) cells. Br J Haematol. 2001;115(1):186-94
20. Hur J, Yoon CH, Kim HS. et al. Characterization of two types of endothelial progenitor cells and their different contributions to neovasculogenesis. Arterioscler Thromb Vasc Biol. 2004;24:288-293
21. Strehlow K, Werner N, Berweiler J. et al. Estrogen increases bone marrow-derived endothelial progenitor cell production and diminishes neointima formation. Circulation. 2003;107:3059-65
22. Virchow R. Phlogose und Thrombose im GefäBsystem. Gesammelte abhaldungen zur Wissenchaftlichen Medizin. Staatsdruckerei, Frankfurt, Germany 1856
23. Massberg S, Gruner S, Konrad I. et al. Enhanced in vivo platelet adhesion in vasodilator stimulated phosphoprotein (VASP)-deficient mice. Blood. 2004;103:136-42
24. Tateishi-Yuyama E, Matsubara H, Murohara T. et al. Therapeutic Angiogenesis using Cell Transplantation (TACT) Study Investigators. Therapeutic angiogenesis for patients with limb ischemia by autologous transplantation of bone marrow cells: a pilot study and a randomised controlled trial. Lancet. 2002;360:427-35
25. Schächinger V, Assmus B, Britten MB. et al. Transplantation of progenitor cells and regeneration enhancement in acute myocardial infarction: final one-year results of the TOPCARE-AMI trial. J Am Coll Cardiol. 2004;44:1690-9
26. Rehman J, Li J, Orschell CM. et al. Peripheral blood “endothelial progenitor cells” are derived from monocyte/macro-phages and secrete angiogenic growth factors. Circulation. 2003;107:1164-9
27. Iba O, Matsubara H, Nozawa Y. et al. Angiogenesis by implantation of peripheral blood mononuclear cells and platelets into ischemic limbs. Circulation. 2002;106:2019-25
28. Yoder MC. Human endothelial progenitor cells. Cold Spring Harb Perspect Med. 2012;2(7):a006692
29. Prescott MF, Muller KR. Endothelial regeneration in hypertensive and genetically hypercholesterolemic rats. Arteriosclerosis. 1983;3:206-14
30. Taylor RG, Lewis JC. Endothelial cell proliferation and monocyte adhesion to atherosclerotic lesions of white carneau pigeons. Am J Pathol. 1986;125:152-60
31. Rafii S, Oz MC, Seldomridge JA. et al. Characterization of hematopoietic cells arising on the textured surface of left ventricular assist devices. Ann Thorac Surg. 1995;60:1627-32
32. Li XQ, Meng QY, Wu HR. Effects of bone marrow-derived endothelial progenitor cell transplantation on vein microenvironment in a rat model of chronic thrombosis. Chin Med J (Engl). 2007;120(24):2245-9
33. Shintani S, Murohara T, Ikeda H. et al. Mobilization of endothelial progenitor cells in patients with acute myocardial infarction. Circulation. 2001;103:2776-9
34. Tepper OM, Capla JM, Galiano RD. et al. Adult vasculogenesis occurs through in situ recruitment, proliferation, and tubulization of circulating bone marrow derived cells. Blood. 2005;105:1068-77
35. Vasa M, Fichtlscherer S, Aicher A. et al. Number and migratory activity of circulating endothelial progenitor cells inversely correlate with risk factors for coronary artery disease. Circ Res. 2001;89:E1-7
36. Schmidt-Lucke C, Rossig L, Fichtlscherer S. et al. Reduced number of circulating endothelial progenitor cells predicts future cardiovascular events: proof of concept for the clinical importance of endogenous vascular repair. Circulation. 2005;111:2981-7
37. Chironi G, Walch L, Pernollet M-G. et al. Decreased number of circulating CD 34+ KDR+ cells in asymptomatic subjects with preclinical atherosclerosis. Atherosclerosis. 2007;191:115-20
38. George F, Poncelet P, Laurent JC. et al. Cytofluorometric detection of human endothelial cells in whole blood using S-Endo 1 monoclonal antibody. J Immunol Methods. 1991;139:65-75
39. Mancuso P, Burlini A, Pruneri G. et al. Resting and activated endothelial cells are increased in the peripheral blood of cancer patients. Blood. 2001;97:3658-61
40. Mancuso P, Calleri A, Cassi C. et al. Circulating endothelial cells as a novel marker of angiogenesis. Adv Exp Med Biol. 2003;522:83-97
41. Timmermans F, Plum J, Yöder MC. et al. Endothelial progenitor cells: identity defined? J Cell Mol Med. 2009;13(1):87-102
42. Ziegelhoeffer T, Fernandez B, Kostin S. et al. Bone marrow-derived cells do not incorporate into the adult growing vasculature. Circ Res. 2004;94:230-8
43. Fazel S, Cimini M, Chen L. et al. Cardioprotective c-kit+ cells are from the bone marrow and regulate the myocardial balance of angiogenic cytokines. J Clin Invest. 2006;116:1865-77
44. Takakura N, Watanabe T, Suenobu S. et al. A role for hematopoietic stem cells in promoting angiogenesis. Cell. 2000;102:199-209
Author contact
![]() Corresponding author: Mariane Cristina Flores Nascimento, Hematology and Hemotherapy Center, University of Campinas, Zip Code: 13081-970, Campinas - SP, Brazil (FAX: 55-19-3289-1089; e-mail: mfloresunicamp.br).
Corresponding author: Mariane Cristina Flores Nascimento, Hematology and Hemotherapy Center, University of Campinas, Zip Code: 13081-970, Campinas - SP, Brazil (FAX: 55-19-3289-1089; e-mail: mfloresunicamp.br).