Impact Factor ISSN: 1449-1907

 Global reach, higher impact
Int J Med Sci 2013; 10(5):617-623. doi:10.7150/ijms.5773 This issue Cite
Research Paper
The Prognostic Value of Abdominal Aortic Calcification in Peritoneal Dialysis Patients
Hye Eun Yoon1,2, Bo Geun Park1, Hyeon Seok Hwang1, Sungjin Chung1, Cheol Whee Park1, Chul Woo Yang1, Yong-Soo Kim1, Seok Joon Shin1,2 ![]()
1. Department of Internal Medicine, College of Medicine, The Catholic University of Korea;
2. Division of Nephrology, Department of Internal Medicine, Incheon St. Mary's Hospital.
Received 2012-12-27; Accepted 2013-3-15; Published 2013-3-21
Abstract
Objective: This study evaluated the prognostic value of the aortic calcification index (ACI), an estimate of abdominal aortic calcification by plain abdominal computed tomography (CT), in terms of left ventricular (LV) diastolic dysfunction, mortality, and nonfatal cardiovascular (CV) events in peritoneal dialysis (PD) patients.
Method: PD patients who received both abdominal CT and echocardiography were divided into a low-ACI group (n=46) and a high-ACI group (n=46).
Results: During follow-up (median, 35.2 months; range, 3.6 - 111.3), 30 patients (32.6%) died and 10 patients (10.9%) developed nonfatal cardiovascular (CV) events. The 5-year event-free survival rates for mortality and nonfatal CV events were significantly lower in the high-ACI group compared with those in the low-ACI group (35.7% vs. 64.1%, P = 0.01). The ACI was positively correlated with left atrial diameter and ratio of peak early transmitral flow velocity to peak early diastolic mitral annular velocity (E/E' ratio; a marker of left ventricular diastolic function). Using multivariate analyses, the high-ACI group (vs. low-ACI group, HR 5.25, 95% CI 1.77 - 15.58, P = 0.003) and increased E/E' ratio (HR 1.16, 95% CI 1.03 - 1.31, P = 0.013) were independent predictors for mortality and CV events. The ACI provided a higher predictive value for adverse outcomes (AUC = 0.755, P = 0.002) than the E/E' ratio (AUC = 0.543, P = 0.61).
Conclusion: The ACI was significantly associated with left ventricular diastolic dysfunction and predicted all-cause mortality and nonfatal CV events in PD patients.
Keywords: Aortic calcification, cardiovascular disease, left ventricular diastolic dysfunction, mortality, peritoneal dialysis.
Introduction
Cardiovascular (CV) disease is the major cause of death in patients with end-stage renal disease (ESRD) (1), and vascular calcification is a non-traditional risk factor for CV events in these patients (2). Among the non-invasive methods of measuring the degree of vascular calcification, computed tomography (CT) is known to be the gold standard method with reproducibility (3). The presence of abdominal aortic calcification (AAC) is a marker of both subclinical atherosclerotic disease and arteriosclerosis, and is also an independent predictor of CV morbidity and mortality (4). The assessment of the degree of AAC may therefore provide additional prognostic value in ESRD patients.
The prognostic impact of vascular calcification in peritoneal dialysis (PD) patients has been demonstrated in previous reports (5-8). These studies included both haemodialysis and peritoneal dialysis (PD) patients, in whom vascular calcification was assessed using plain radiographs of chest and abdomen, or CT of femoral artery and coronary artery. Although there have been reports about the measurement of the AAC using plain abdomen CT in haemodialysis patients (9-14), no report has focused on PD patients. Previous studies with haemodialysis patients have demonstrated the association between vascular calcification and cardiac function in ESRD patients, including arterial stiffness, stroke volume, and left ventricular diastolic dysfunction (15-17). However, the association between AAC and cardiac function has not yet been demonstrated exclusively in PD patients.
The current study was conducted to investigate whether the degree of AAC can predict mortality and CV events in continuous ambulatory peritoneal dialysis (CAPD) patients, using the aortic calcification index (ACI) measured by plain abdomen CT scan, and the relationship between ACI and echocardiographic parameters.
Materials and Methods
Study Population
Ninety-two patients who initially started CAPD therapy and who took both an abdominal CT scan and an echocardiography between January 2005 and December 2011 were included. All patients continuously used four exchanges of 2 L glucose-based PD solution, with or without icodextrin. Exclusion criteria included ultrafiltration failure, on-going treatment of peritonitis, current malignancy, and previous history of parathyroidectomy. The medical records of these patients were retrospectively reviewed.
In line with the principles of the Declaration of Helsinki, the study protocol was approved by the institutional review board of the Catholic University of Korea (OC11RSSI0093), and all patients gave written informed consent to participate in the study.
Assessment of AAC
The abdominal aorta was examined on a consecutive, sequential, 8-mm section, non-contrast CT scans, and ACI was calculated as the proportion of aortic circumference covered by calcification, as previously described (9, 10). This method was used to morphometrically quantify arteriosclerosis in the cross-section which showed the most extensive aortosclerosis. The arithmetic mean values of three measurements were calculated and used for analysis. ACI was independently checked by two observers. To optimise reproducibility, all scans in the cross-sectional study were made using the same CT equipment. Patients were divided into two groups according to the median ACI value (18.9) in our population: the low-ACI group (n = 46) and the high-ACI group (n = 46).
Clinical Data
Differences between the low-ACI group and the high-ACI group were compared, including their demographic data and echocardiographic measurements at the time of CT scan, as well as the event-free survival rates for all-cause mortality and nonfatal CV events. Body mass index (BMI) was calculated by dividing weight (kg) by body height (m2). CV events included coronary heart disease (angina pectoris or myocardial infarction), cerebrovascular disease (transient ischemic attack, cerebral infarction, or cerebral haemorrhage), peripheral/pulmonary vascular disease, and heart failure. Prognostic factors affecting all-cause mortality and nonfatal CV events and the predictive value for all-cause mortality and nonfatal CV events were also assessed.
Echocardiography
A two-dimensional-guided M-mode echocardiography was performed by a cardiologist who was blind to the patient's clinical and laboratory data. M-mode measurements included left ventricular end-diastolic diameter (LVDd), left ventricular end-systolic diameter (LVDs), left ventricular posterior wall thickness (PWT), and interventricular septal thickness (IVST). Left ventricular mass (LVM) was calculated by means of the Devereux formula and indexed to height2.7 to determine the left ventricular mass index (LVMI), expressed in g/m2.7 (18). Left ventricular end-diastolic volume (LVEDV), left ventricular end-systolic volume (LVESV), left ventricular stroke volume (LVSV), left ventricular ejection fraction (LVEF), and left atrial diameter (LAD) were determined from apical 2- and 4-chamber views by the Simpson's biplane formula, based on the recommendations of the American Society of Echocardiography (19). To estimate diastolic function, mitral inflow velocities, and myocardial velocities were recorded using pulsed wave Doppler and the tissue Doppler, respectively. From the mitral valve inflow velocity curve using pulsed wave Doppler, peak early diastolic flow velocity (MV-E), peak late diastolic flow velocity (MV-A), a ratio of E wave, and A wave (E/A ratio) were measured (20). From tissue Doppler imaging, septal mitral annular early peak velocity (E') was measured. A ratio of peak early transmitral flow velocity (E) to peak early diastolic mitral annular velocity (E/E' ratio), that is an estimate of left ventricular filling pressure (LVFP), was also calculated (21). The intra-observer variability was determined by having an observer repeat the measurements of the mitral valve velocities in the same datasets from 10 randomly selected subjects 1 month later and it was 3.9 ± 2.2% (range, 0.5 - 7.8). Inter-observer measurement variability was determined by having a second observer and the variability values were calculated as the absolute difference between the corresponding 2 measurements and it was 3.5 ± 2.2% (range, 0.6 - 8.2).
Statistical Analysis
Continuous data were presented as mean ± standard deviation (SD) and were compared using Student's t test or Mann-Whitney U-test. Categorical data were compared using chi-square tests or Fisher's exact tests. Pearson's correlation analysis or Spearman correlation analyses determined the correlation between ACI and echocardiographic measurements. Kaplan-Meier curves and log-rank tests were used to describe and compare the event-free survival rates for all-cause mortality and nonfatal CV events. A multivariate Cox regression analysis identified the significant prognostic factors affecting all-cause mortality and nonfatal CV events. The estimated standard error of the coefficient (β1) established the confidence intervals (CI) of the hazard ratio (HR). The predictive value for all-cause mortality and nonfatal CV events was analysed by receiver operating characteristic (ROC) curve analysis with calculated area under the ROC curve (AUC). A P value of less than 0.05 indicated significance.
Results
Patient Characteristics
Mean patient age was 55 ± 13 years (range, 26 - 84), and median dialysis vintage was 11.5 months (range, 1.0 - 95.5 months). Forty-eight patients (52.2%) were male and fifty patients (54.3%) had diabetes. Twenty-six patients (28.3%) had a previous history of CV disease; 46.2% of patients (n = 12) had coronary artery disease, 19.2% (n = 5) had cerebrovascular disease, 19.2% (n = 5) had heart failure, and 15.4% (n = 4) had peripheral artery disease. The mean ACI was 21.2 ± 18.8 (range, 0 - 73.7). The median follow-up period was 35.2 months (range, 3.6 - 111.3 months).
Tables 1 and 2 show the comparison of patient characteristics and biochemical parameters between the low-ACI group and the high-ACI group. The high-ACI group was significantly older and had a longer duration of PD and a more prevalent history of diabetes and CV disease compared to the low-ACI group.
Demographic and clinical characteristics of the patients.
| Parameters | Low-ACI (N = 46) | High-ACI (N = 46) | P |
|---|---|---|---|
| Age | 49.4 ± 11.6 | 60.9 ± 11.1 | < 0.001 |
| Gender, male (%) | 26 (56.5) | 22 (47.8) | 0.40 |
| Dialysis vintage (mo) | 12.3 ± 13.9 | 25.5 ± 27.8 | 0.04 |
| Body mass index (kg/m2) | 24.0 ± 3.9 | 24.5 ± 4.2 | 0.56 |
| Follow-up months | 35.3 ± 22.1 | 42.0 ± 29.6 | 0.43 |
| History of CV disease (%) | 8 (17.4) | 18 (39.1) | 0.02 |
| Diabetes (%) | 19 (41.3) | 31 (67.4) | 0.01 |
| Hypertension (%) | 46 (100) | 45 (97.8) | 1.00 |
| Smoking (%) | 18 (40.9) | 16 (35.6) | 0.60 |
| ACE inhibitor and/or ARB use (%) | 32 (69.6) | 36 (78.3) | 0.34 |
| Calcium channel blocker use (%) | 20 (43.5) | 13 (28.3) | 0.13 |
| Beta-blocker use (%) | 16 (34.8) | 18 (39.1) | 0.67 |
| Statin use (%) | 22 (48.9) | 24 (52.2) | 0.75 |
| Phosphate binder use (%) | 27 (58.7) | 23 (50.0) | 0.40 |
| Active vitamin D use (%) | 8 (17.4) | 3 (6.5) | 0.20 |
| Icodextrin use (%) | 14 (30.4) | 20 (50.0) | 0.06 |
| Dialytic Uf (mL/day) | 1,454 ± 109 | 1,396 ± 124 | 0.12 |
| Urine output (mL/day) | 406.8 ± 43.8 | 330.8 ± 50.2 | 0.23 |
| RRF (mL/min/1.73m2) | 3.6 ± 1.5 | 3.4 ± 1.6 | 0.52 |
| Weekly CCr (L/1.73m2) | 94.0 ± 1.04 | 89.8 ± 11.1 | 0.21 |
| High and high average transporter (%) | 18 (39.1) | 22 (44.0) | 0.63 |
| ACI | 5.8 ± 7.3 | 36.6 ± 13.4 | < 0.001 |
ACI: aortic calcification index; CV: cardiovascular; ACE: angiotensin-converting enzyme; ARB: angiotensin II receptor blocker; Uf: ultrafiltration; RRF: residual renal function; CCr: creatinine clearance.
Biochemical parameters of the patients
| Low-ACI (N = 46) | High-ACI (N = 46) | P | |
|---|---|---|---|
| Hemoglobin (g/dL) | 10.2 ± 1.7 | 10.1 ± 1.1 | 0.84 |
| Albumin (mg/dL) | 3.5 ± 0.5 | 3.6 ± 0.5 | 0.61 |
| Calcium (mg/dL) | 8.2 ± 1.2 | 8.3 ± 1.2 | 0.71 |
| Phosphorus (mg/dL) | 5.4 ± 2.1 | 5.4 ± 2.0 | 0.96 |
| Intact parathyroid hormone (pg/mL) | 387.4 ± 264.4 | 365.9 ± 279.9 | 0.73 |
| Total cholesterol (mg/dL) | 169.4 ± 50.5 | 185.8 ± 83.1 | 0.27 |
| Triglyceride (mg/dL) | 193.2 ± 108.9 | 185.9 ± 176.3 | 0.82 |
| LDL-cholesterol (mg/dL) | 97.2 ± 38.3 | 99.2 ± 43.0 | 0.83 |
| Non-HDL cholesterol (mg/dL) | 129.2 ± 44.2 | 135.7 ± 51.7 | 0.59 |
| C-reactive protein (mg/L) | 19.2 ± 39.4 | 22.6 ± 48.4 | 0.72 |
LDL-cholesterol: low-density lipoprotein cholesterol; Non-HDL cholestserol: non-high-density lipoprotein cholesterol.
Echocardiographic Measurements
Table 3 shows the comparison of echocardiographic measurements between the low-ACI group and the high-ACI group. The high-ACI group showed significantly higher values of LVDd, LAD, E/A ratio and E/E' ratio than the low-ACI group. By contrast, the LVEF in the high-ACI group was lower than that in the low-ACI group. There was no significant difference in other echocardiographic measurements between the two groups.
Echocardiographic parameters of the patients.
| Low-ACI (N = 46) | High-ACI (N = 46) | P | |
|---|---|---|---|
| LVM (g) | 241.2 ± 81.4 | 285.8 ± 76.2 | 0.17 |
| LVM index (g/m2.7) | 66.0 ± 19.1 | 81.0 ± 18.2 | 0.05 |
| LVDd (mm) | 49.1 ± 7.0 | 52.7 ± 7.4 | 0.04 |
| LVDs (mm) | 33.9 ± 7.9 | 37.6 ± 8.7 | 0.06 |
| PWT (mm) | 15.0 ± 2.5 | 14.7 ± 3.0 | 0.66 |
| IVST (mm) | 15.1 ± 2.2 | 14.8 ± 2.5 | 0.65 |
| LVEDV (mm3) | 97.4 ± 40.8 | 105.8 ± 34.8 | 0.36 |
| LVESV (mm3) | 45.2 ± 25.1 | 58.0 ± 31.2 | 0.07 |
| LVSV (mm3) | 52.2 ± 20.8 | 47.8 ± 14.2 | 0.31 |
| LVEF (%) | 56.1 ± 10.3 | 50.1 ± 14.5 | 0.04 |
| LAD (mm) | 38.8 ± 5.2 | 43.3 ± 6.1 | 0.001 |
| E/A ratio | 0.8 ± 0.3 | 1.2 ± 0.8 | 0.02 |
| E/E' ratio | 12.7 ± 5.6 | 16.6 ± 6.2 | 0.02 |
LVM: left ventricular mass; LVDd: left ventricular end-diastolic diameter; LVDs: left ventricular end-systolic diameter; PWT: left ventricular posterior wall thickness; IVST: interventricular septal thickness; LVEDV: left ventricular end-diastolic volume; LVESV: left ventricular end-systolic volume; LVSV: left ventricular stroke volume; LVEF: left ventricular ejection fraction; LAD: left atrial diameter; E/A ratio: ratio of E wave (peak early diastolic flow velocity) and A wave (peak late diastolic flow velocity); E/E' ratio: a ratio of peak early transmitral flow velocity (E) to peak early diastolic mitral annular velocity (E').
Table 4 shows the relationship between the ACI and echocardiographic parameters. The ACI was positively correlated with LAD and the E/E' ratio, whereas there was no significant correlation with other parameters.
Relationship between abdominal aortic calcification index and echocardiographic measurements .
| Correlation coefficient | P | |
|---|---|---|
| LVM index (g/m2.7) | 0.281 | 0.16 |
| LVDd (mm) | 0.168 | 0.15 |
| LVDs (mm) | 0.177 | 0.14 |
| PWT (mm) | -0.101 | 0.39 |
| IVST (mm) | -0.063 | 0.59 |
| LVEDV (mm3) | 0.028 | 0.82 |
| LVESV (mm3) | 0.156 | 0.20 |
| LVSV (mm3) | -0.196 | 0.11 |
| LVEF (%) | -0.212 | 0.07 |
| LAD (mm) | 0.373 | 0.001 |
| E/A ratio | 0.150 | 0.22 |
| E/E' ratio | 0.304 | 0.03 |
LVMI: left ventricular mass index; LVEDV: left ventricular end-diastolic volume; LVESV: left ventricular end-systolic volume; LVEF: left ventricular ejection fraction; LAD: left atrial diameter; LVSV: left ventricular stroke volume; E/A ratio: ratio of E wave (peak early diastolic flow velocity) and A wave (peak late diastolic flow velocity); E/E' ratio: a ratio of peak early transmitral flow velocity (E) to peak early diastolic mitral annular velocity (E').
All-cause Mortality and Nonfatal CV Events
A total of 30 deaths occurred during follow-up. Sixteen deaths (53.3%) were due to fatal CV events, and 14 deaths (46.7%) were due to non-CV causes. CV-related deaths included coronary heart disease (n = 10, 62.5%), heart failure (n = 1, 6.3%), and cerebrovascular disease (n = 5, 31.3%). Non-CV-related deaths included infection (n = 7, 50.0%), gastrointestinal perforation (n = 6, 42.9%), and hepatic failure (n = 1, 7.1%). Ten nonfatal CV events were noted, including coronary heart disease (n = 3, 30.0%), heart failure (n = 5, 50.0%), and cerebrovascular disease (n = 2, 20.0%).
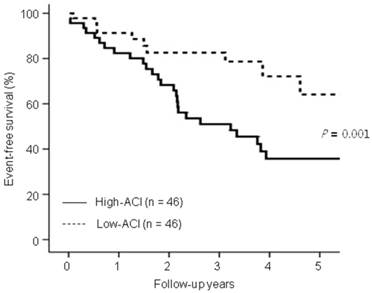
Kaplan-Meier analysis showed that the 5 year-event-free survival rates for all-cause deaths and nonfatal CV events were significantly lower in the high-ACI group compared with those in the low-ACI group (35.7% vs. 64.1%, P = 0.01; Figure 1).
Comparison of event-free survival rates for all-cause mortality and nonfatal cardiovascular (CV) events between the low-aortic calcification index (ACI) group and the high-ACI group. Note that the event-free survival rates for the high-ACI group were significantly lower than the low-ACI group at 5 years (P = 0.01).
Predictors of Mortality and Nonfatal CV events
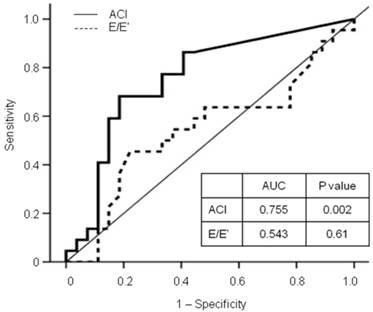
In the multivariate analyses, the high-ACI group (vs. low-ACI group, HR 5.25, 95% CI 1.77 - 15.58, P = 0.003) and increased E/E' ratio (HR 1.16, 95% CI 1.03 - 1.31, P = 0.013) were independent predictors for mortality and CV events, after adjustment for age, diabetes, previous CV disease, levels of hemoglobin, albumin, and C-reactive protein, LAD, and LVEF (Table 5). Furthermore, the ACI provided a higher predictive value for all-cause deaths and nonfatal CV events (AUC = 0.755, P = 0.002) than the E/E' ratio (AUC = 0.543, P = 0.61; Figure 2).
Receiver operating characteristic (ROC) curve for all-cause mortality and nonfatal cardiovascular events with calculated area under the ROC curve (AUC). The ACI provided a higher predictive value for adverse outcomes than the E/E' ratio. ACI: aortic calcification index; E/E' ratio: a ratio of peak early transmitral flow velocity (E) to peak early diastolic mitral annular velocity (E').
Multiple Cox regression models of abdominal aortic calcification for mortality and cardiovascular events.
| HR | 95% CI | P | |
|---|---|---|---|
| High-ACI group (vs. Low-ACI group) | 5.25* | 1.77 - 15.58 | 0.003 |
| E/E' | 1.16* | 1.03 - 1.31 | 0.013 |
*Adjusted for age, diabetes, previous cardiovascular disease, levels of hemoglobin, albumin, and C-reactive protein, left atrial diameter, and ejection fraction. ACI: aortic calcification index; E/E' ratio: a ratio of peak early transmitral flow velocity (E) to peak early diastolic mitral annular velocity (E').
Discussion
The current study demonstrates that ACI is an independent predictor for all-cause mortality and nonfatal CV events in CAPD patients. In addition, the ACI provided the highest predictive value for mortality and CV events among the echocardiographic parameters of left ventricular systolic or diastolic dysfunction. The results therefore suggest that the ACI can be as useful as an echocardiographic parameter for risk assessment of adverse outcomes in CAPD patients.
Risk factors implicated in vascular or tissue calcification in the PD population are known to be age, calcium-phosphorus balance, the duration of PD, lipid and C-reactive protein levels, the presence of diabetes, and malnutrition (22). The results of the present study are consistent with previous reports in that the high-ACI group was significantly older and had a longer dialysis vintage and a higher prevalence of diabetes compared with the low-ACI group. However, the biochemical measurements did not differ between the two groups, especially the lipid profiles and calcium and phosphorus levels, which are important for arterial calcification and as atherosclerotic risk factors. The reason for this discrepancy is unclear, but may be partially related to the use of drugs in the two groups. In this study, the patients' treatment was not standardised during the follow-up period. There is a possibility that drugs, such as those for dyslipidaemia or for calcium and phosphorus control, might have affected the laboratory results.
Previous studies have reported that vascular calcification is associated with cardiac changes in ESRD patients, including arterial stiffness, stroke volume, and left ventricular diastolic dysfunction. These reports have assessed calcification in the coronary artery, femoral artery, abdominal aorta, or aortic arch using plain radiograph or reconstituted CT (15-17). Recently, we have reported that ACI is associated with diastolic dysfunction in haemodialysis patients (14). However, the association between AAC and cardiac function has not yet been demonstrated exclusively in PD patients. In the current study, the high-ACI group showed significantly higher LVDd, LAD, E/A ratio and E/E' ratio, and lower EF than the low-ACI group. In addition, the ACI was positively correlated with the LAD and E/E' ratio. The E/E' ratio is an accurate estimate of LVFP and a reliable marker of diastolic dysfunction in ESRD patients (23). Therefore, our results suggest that ACI is associated with LV diastolic stiffness and limited diastoilc filling. Increased LVFP results from increased left ventricular diastolic stiffness and accompanies limited diastolic filling (24). Therefore, our results suggest that AAC is associated with limited diastolic filling in CAPD patients, which is consistent with the results in our previous study of haemodialysis patients (14). This may be because vascular calcification results in reduced compliance of large arteries and autonomic dysfunction (25), and increased arterial stiffness is associated with vascular calcification and diastolic dysfunction (15, 17). LAD has been used as a parameter of left atrium size, although the left atrial volume has become a preferred measurement. The left atrium contributes up to 30% of the total LVSV in the normal population, and enlarges in response to pressure and volume load (26). Therefore, an increased LAD may reflect an increase in pressure and/or volume overload. It was reported that enlarged left atrial volume is common in PD patients because of chronic volume overload and increased afterload due to left ventricular hypertrophy (27). In this study, LVMI and LVEF were not significantly correlated with ACI, which means that the AAC was not associated with LV hypertrophy or systolic dysfunction, respectively. As such, our results may reflect that AAC is more associated with chronic volume overload rather than afterload due to left ventricular hypertrophy in CAPD patients. Taken together, AAC was associated with diastolic dysfunction and volume overload.
There are some reports which have discussed the prognostic impact of vascular or tissue calcification in PD patients (5-8, 28). However, only two studies included PD patients exclusively, and these studies assessed calcification in the coronary artery by CT or the cardiac valve by echocardiography (8, 28). No previous reports have discussed the prognostic impact of AAC in PD patients, especially as assessed by pain abdomen CT scan. Our results showed that the ACI independently predicted all-cause mortality and nonfatal CV events. Previously it was reported that the E/E' ratio is an independent predictor of all-cause mortality and CV death in PD patients (29). Similarly, the present study showed that the E/E' ratio predicted adverse outcomes. Interestingly, our results showed that the predictive value of ACI for adverse outcomes was higher than that of the E/E' ratio. There are several possible reasons for this. First, the ACI may represent both atherosclerosis and vascular stiffness. The AAC assessed by CT scan can be from both intimal and medial calcification (2). Intimal calcification represents an advanced stage of atherosclerosis and is associated with the development of plaques and occlusive lesions (30). Medial calcification does not obstruct the lumen but increases vascular stiffness (31). Second, the ACI may represent the volume status of PD patients. In the current study, the ACI was associated with LAD, but not with LVMI or LVEF. As LAD is an estimate of left atrial volume, our results suggest that AAC is more associated with volume overload rather than afterload. Third, the ACI may be a more stable index for reflecting the cardiovascular status than the E/E' ratio. As the Doppler indices of diastolic function reflect the beat-to-beat interaction of LVFP and left ventricular compliance, the E/E' ratio is sensitive to rapid alterations in ventricular preload and afterload (32).
This study has several limitations. First, it was retrospective, and therefore, the treatment was not standardised between the two groups, as previously mentioned. Second, the drug effects on AAC and clinical outcomes were not assessed. Third, our sample size was not large and the measured ACI values were within a relatively wide range. In addition, the follow-up period was relatively shorter than that in previous reports. Therefore, further study with larger sample sizes and longer follow-up periods is needed to support the clinical importance of ACI.
In conclusion, our results clearly demonstrate that ACI predicts all-cause mortality and nonfatal CV events in CAPD patients, and that the prognostic value is as useful as echocardiographic measurements of cardiac function. Abdomen CT does not require special equipment and is available at small centres, and ACI can be easily measured by inspecting multiple aortic slices above the aortic bifurcation (9). Therefore, we cautiously suggest that ACI can be easily and accurately used for prognostication and cardiovascular risk stratification in CAPD patients.
Acknowledgements
This study was supported by a grant through the National Research Foundation of Korea (NRF) funded by the Ministry of Education, Science, and Technology, Republic of Korea (20110013312), and Baxter Incorporated (GKOR5605).
Competing Interests
The authors have declared that no competing interest exists.
References
1. Foley RN, Murray AM, Li S. et al. Chronic kidney disease and the risk for cardiovascular disease, renal replacement, and death in the United States Medicare population, 1998 to 1999. J Am Soc Nephrol. 2005;16:489-95
2. London GM, Guerin AP, Marchais SJ. et al. Arterial media calcification in end-stage renal disease: impact on all-cause and cardiovascular mortality. Nephrol Dial Transplant. 2003;18:1731-40
3. Raggi P, Bellasi A. Clinical assessment of vascular calcification. Adv Chronic Kidney Dis. 2007;14:37-43
4. Witteman JC, Kok FJ, van Saase JL. et al. Aortic calcification as a predictor of cardiovascular mortality. Lancet. 1986;2:1120-2
5. Sigrist MK, Taal MW, Bungay P. et al. Progressive vascular calcification over 2 years is associated with arterial stiffening and increased mortality in patients with stages 4 and 5 chronic kidney disease. Clin J Am Soc Nephrol. 2007;2:1241-8
6. Noordzij M, Cranenburg EM, Engelsman LF. et al. Progression of aortic calcification is associated with disorders of mineral metabolism and mortality in chronic dialysis patients. Nephrol Dial Transplant. 2011;26:1662-9
7. Verbeke F, Van Biesen W, Honkanen E. et al. Prognostic value of aortic stiffness and calcification for cardiovascular events and mortality in dialysis patients: outcome of the calcification outcome in renal disease (CORD) study. Clin J Am Soc Nephrol. 2011;6:153-9
8. Ammirati AL, Dalboni MA, Cendoroglo M. et al. The progression and impact of vascular calcification in peritoneal dialysis patients. Perit Dial Int. 2007;27:340-6
9. Kabaya T, Nitta K, Kimura H. et al. Increased aortic calcification index in hemodialysis patients. Nephron. 1999;81:354-5
10. Nitta K, Akiba T, Uchida K. et al. The progression of vascular calcification and serum osteoprotegerin levels in patients on long-term hemodialysis. Am J Kidney Dis. 2003;42:303-9
11. Nitta K, Akiba T, Uchida K. et al. Left ventricular hypertrophy is associated with arterial stiffness and vascular calcification in hemodialysis patients. Hypertens Res. 2004;27:47-52
12. Takei T, Otsubo S, Uchida K. et al. Effects of sevelamer on the progression of vascular calcification in patients on chronic haemodialysis. Nephron Clin Pract. 2008;108:c278-83
13. Taniwaki H, Ishimura E, Tabata T. et al. Aortic calcification in haemodialysis patients with diabetes mellitus. Nephrol Dial Transplant. 2005;20:2472-8
14. Yoon HE, Chung S, Whang HC. et al. Abdominal Aortic Calcification is Associated with Diastolic Dysfunction, Mortality, and Nonfatal Cardiovascular Events in Maintenance Hemodialysis Patients. J Korean Med Sci. 2012;27:870-5
15. Raggi P, Bellasi A, Ferramosca E. et al. Association of pulse wave velocity with vascular and valvular calcification in hemodialysis patients. Kidney Int. 2007;71:802-7
16. Sigrist M, Bungay P, Taal MW. et al. Vascular calcification and cardiovascular function in chronic kidney disease. Nephrol Dial Transplant. 2006;21:707-14
17. Fujiu A, Ogawa T, Matsuda N. et al. Aortic arch calcification and arterial stiffness are independent factors for diastolic left ventricular dysfunction in chronic hemodialysis patients. Circ J. 2008;72:1768-72
18. de Simone G, Devereux RB, Roman MJ. et al. Relation of obesity and gender to left ventricular hypertrophy in normotensive and hypertensive adults. Hypertension. 1994;23:600-6
19. Schiller NB, Shah PM, Crawford M. et al. Recommendations for quantitation of the left ventricle by two-dimensional echocardiography. American Society of Echocardiography Committee on Standards, Subcommittee on Quantitation of Two-Dimensional Echocardiograms. J Am Soc Echocardiogr. 1989;2:358-67
20. Rakowski H, Appleton C, Chan KL. et al. Canadian consensus recommendations for the measurement and reporting of diastolic dysfunction by echocardiography: from the Investigators of Consensus on Diastolic Dysfunction by Echocardiography. J Am Soc Echocardiogr. 1996;9:736-60
21. Nagueh SF, Middleton KJ, Kopelen HA. et al. Doppler tissue imaging: a noninvasive technique for evaluation of left ventricular relaxation and estimation of filling pressures. J Am Coll Cardiol. 1997;30:1527-33
22. Wang AY. Vascular and other tissue calcification in peritoneal dialysis patients. Perit Dial Int. 2009;29(Suppl 2):S9-S14
23. Sharma R, Pellerin D, Gaze DC. et al. Mitral peak Doppler E-wave to peak mitral annulus velocity ratio is an accurate estimate of left ventricular filling pressure and predicts mortality in end-stage renal disease. J Am Soc Echocardiogr. 2006;19:266-73
24. Westermann D, Kasner M, Steendijk P. et al. Role of left ventricular stiffness in heart failure with normal ejection fraction. Circulation. 2008;117:2051-60
25. Chesterton LJ, Sigrist MK, Bennett T. et al. Reduced baroreflex sensitivity is associated with increased vascular calcification and arterial stiffness. Nephrol Dial Transplant. 2005;20:1140-7
26. Leung DY, Boyd A, Ng AA. et al. Echocardiographic evaluation of left atrial size and function: current understanding, pathophysiologic correlates, and prognostic implications. Am Heart J. 2008;156:1056-64
27. Enia G, Mallamaci F, Benedetto FA. et al. Long-term CAPD patients are volume expanded and display more severe left ventricular hypertrophy than haemodialysis patients. Nephrol Dial Transplant. 2001;16:1459-64
28. Wang AY, Wang M, Woo J. et al. Cardiac valve calcification as an important predictor for all-cause mortality and cardiovascular mortality in long-term peritoneal dialysis patients: a prospective study. J Am Soc Nephrol. 2003;14:159-68
29. Wang AY, Wang M, Lam CW. et al. Left ventricular filling pressure by Doppler echocardiography in patients with end-stage renal disease. Hypertension. 2008;52:107-14
30. Goodman WG, Goldin J, Kuizon BD. et al. Coronary-artery calcification in young adults with end-stage renal disease who are undergoing dialysis. N Engl J Med. 2000;342:1478-83
31. London GM, Marchais SJ, Guerin AP. et al. Arteriosclerosis, vascular calcifications and cardiovascular disease in uremia. Curr Opin Nephrol Hypertens. 2005;14:525-31
32. Hurrell DG, Nishimura RA, Ilstrup DM. et al. Utility of preload alteration in assessment of left ventricular filling pressure by Doppler echocardiography: a simultaneous catheterization and Doppler echocardiographic study. J Am Coll Cardiol. 1997;30:459-67
Author contact
![]() Corresponding author: Seok Joon Shin, MD, PhD. Department of Internal medicine, Incheon St. Mary's Hospital, College of Medicine, The Catholic University of Korea. 56 Dongsu-ro, Pupyung-gu, Incheon, Republic of Korea, 403-720 Tel: 82-32-280-5091, Fax: 82-32-280-5987 E-mail: imkidneyac.kr.
Corresponding author: Seok Joon Shin, MD, PhD. Department of Internal medicine, Incheon St. Mary's Hospital, College of Medicine, The Catholic University of Korea. 56 Dongsu-ro, Pupyung-gu, Incheon, Republic of Korea, 403-720 Tel: 82-32-280-5091, Fax: 82-32-280-5987 E-mail: imkidneyac.kr.