Impact Factor ISSN: 1449-1907

 Global reach, higher impact
Int J Med Sci 2013; 10(5):585-592. doi:10.7150/ijms.5794 This issue Cite
Research Paper
Differential Expression Profiling and Functional Analysis of microRNAs through Stage I-III Papillary Thyroid Carcinoma
Jing Zhang1,2*, Yang Liu1*, Zheng Liu1, Xiao-Ming Wang1, De-Tao Yin1, Li-Li Zheng2, De-Yan Zhang1, Xiu-Bo Lu1, ![]()
1. Department of Thyroid Surgery of the First Affiliated Hospital of Zhengzhou University, Zhengzhou 450052, China;
2. Department of Pediatric Endocrinologist of the First Affiliated Hospital of Zhengzhou University, Zhengzhou 450052, China.
* Jing Zhang and Yang Liu contributed equally to this work.
Received 2013-1-2; Accepted 2013-2-28; Published 2013-3-16
Abstract
Objective: To elucidate the mechanisms undergoing the pathogenesis of PTC, this study try to find stage specific microRNAs (miRNAs) using microarray chip in stage I, II and III papillary thyroid carcinoma (PTC) tissues as well predict miRNAs binding target genes and their molecular functions.
Methods: PTC specimens of stage I, II, and III and their paired adjacent non-tumor tissue (one patient for each stage) were collected. The expressions of miRNAs were examined using miRNA microarray chip. The most significant changed miRNAs from microarray were verified by using quantitative RT-PCR. The Potential miRNAs regulating target genes and their preliminary biological functions were forecasted with variety function prediction software.
Results: Ten miRNAs exhibited sequential up regulation expression profiles and five miRNAs performed sequential down regulation throughout stage I to III (p<0.05). After normalization, Fifteen miRNAs showed significant different compared to adjacent non-tumor tissues (p<0.05). Among of them, the most significant up regulation and down regulation miRNAs were miR-146b-5p and miR-335, respectively. Both of them were verified with qRT-PCR. 34 target genes for miR-146-5p and 36 target genes for miR-335 was predicted.
Conclusion: MicroRNA profile assay successfully detected a branch of differential expression miRNAs between PTC and normal tissue. Some of them also showed stage specific. Biological function analysis showed that target genes were involved in five aspects including cell proliferation, differentiation, apoptosis, cycle, and signaling transduction pathway, suggesting the regulatory role of abnormal expression of critical miRNAs in the pathogenesis of PTC.
Keywords: papillary thyroid carcinoma, microRNA, microarray, qRT-PCR, bioinformatics.
INTRODUCTION
Papillary thyroid carcinoma (PTC) is the most common malignant thyroid tumor. Despite its well-differentiated characteristics, papillary carcinoma may be overtly or minimally invasive. In fact, these tumors may spread easily to other organs. The life expectancy of patients with this cancer is related to their age. The global incidence shows an increase of 4% annually for this kind of tumor [1], in the eighth place of tumor incidence in females, seriously threatening human health and life.
MicroRNA microarray analysis has consistently found altered expression of miRNAs in thyroid tumors, suggesting their roles in thyroid carcinogenesis and diagnosis [2-3]. MicroRNA (miRNA) is a non-encoding small RNA existing extensively in plants, animals, and viruses, at an approximate length of 21-23 nt and highly conserved. It binds to specific mRNA 3'-UTR and regulates gene transcription, mature miRNAs form with other proteins into RNA induced silencing complex, resulting in the degradation or translation suppression of target mRNA if binding to target mRNA 3'-UTR [4]. miRNAs are involved in the regulation of multiple critical biological activities, included cell apoptosis [5], proliferation [6], and tumor genesis [7]. The expression of miRNA is significantly differential between tumor and normal tissue, in addition to among various tumor tissues [8-9], suggesting the critical role of miRNAs in tumor genesis [10].
To explore the altered different expression of miRNA and the mechanisms underlying the pathogenesis of PTC, we examined the differential expression profiles of miRNAs in stage I-III PTC by using miRNA microarray chip in this study. We also made a preliminary analysis of biological function for the most differentially expressed miRNAs and their potentially regulated target genes.
MATERIALS AND METHODS
Patients and surgical specimens
Surgical specimens were obtained from three PTC patients including two women and one man with age of 65, 48 and 46 years respectively. These patients were initially diagnosed and the tumor size was 1.5cm, 3.1cm and 4.8cm respectively with negative lymph node status and none distant metastasis. All patients were took surgery at Department of Thyroid Surgery at the First Affiliated Hospital of Zhengzhou University in June 2010. Based on morphological examination, all specimen was belongs to classic PTC pattern with no follicular variant. The pathological examination was agreed by two specialist pathologists. The clinical staging complied with the criteria of Union for International Cancer Control Tumor Node Metastasis (UICC-TNM), 2002, 6th version [11], namely, stages I, II, and III. The adjacent non tumor tissues were 2cm distance from the tumor and no obvious tumor cells, as evaluated by a pathologist. All tissues were preserved immediately in liquid nitrogen after removal from the body. The study protocol was approved by the Institutional Review Board at the First Affiliated Hospital of Zhengzhou University. All the patients volunteered to give informed consent prior to receiving the surgery.
Total RNA preparation
The samples were ground by using liquid nitrogen. Total RNA was extracted from PTC and adjacent non tumor tissues by using an animal tissue RNA purification kit (Norgen Biotek, Thorold, ON) as recommended by the manufacturer. RNA samples were measured by using an ultraviolet spectrometer for OD260, OD280, and OD230 to determine RNA purity (OD260/280 > 1.8, OD260/230 > 1.5). Formaldehyde denaturing agarose gel electrophoresis was used to determine RNA integrity by examining the ratio of 28S to 18S in RNA sample.
MicroRNA microarrays chip analysis
miRNA expression profiling microarray was completed by using µParaflo® Microfluidics Biochip (LC Sciences, Houston, TX). The microarray probe sequence derived from Sanger MiBase version 15.0 (http://microrna.sanger.org). Each chip contained multiple quality control probes and employed dual-color chip to examine miRNA expression profiling in PTC and adjacent non tumor tissues. Probes were synthesized in situ with photosensitive PGR. The sequence consisted of two fragments, namely, a chemically modified oligonucleotide encoding fragment complementary to target miRNA or other target RNA, and an extension arm at a certain distance to the connected encoding sequence, which lessened the hybridization spatial impairment.
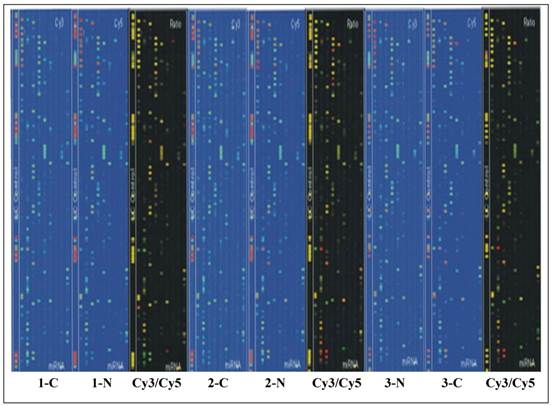
Tm of probe hybridization was balanced by the chemical modification. Sample RNA (5ug) were filtered through YM-100 micro centrifuge column (Millipore, Billerica, MA) to produce small RNA at a length of less than 300nt. Poly(A) polymerase was used to add a poly(A) tail to the 3' end of small RNA, and an oligonucleotide maker for further fluorescent label. Two types of different markers were used to label matched RNA samples. The hybridization was completed on µParaflo® Microfluidics Biochip by using a micro circulation pump (Atactic Technologies Inc., Houston, TX) [12]. The hybridization mix contained 100 ul 6x SSPE buffer (0.90 M NaCl, 60 mM Na2HPO4, 6 mM EDTA, pH 6.8) with 25% Formaldehyde, at a temperature of 34°C. Cy3 and Cy5 specific fluorescent label and Axon GenePix 4000B microarray scanner were used to capture hybridization images. ArrayPro (Media Cybernetics, Bethesda, MD) was utilized to complete the digital transformation (Figure 1).
Chip scan image of papillary thyroid carcinoma and adjacent non-tumorous tissue tissues in three patients. The signaling intensity graphs of Cy3 and Cy5 showed that the signaling intensity increased from 1 to 65,535, corresponding to the progression of color from blue to green, then to yellow, and finally to red. In the Cy3/Cy5 ratio image, when Cy3 level is higher than Cy5 level, the color is green, when Cy3 level is equal to Cy5 level, the color is yellow; and when Cy5 level is higher than Cy3 level, the color is red.
Quantitative real-time PCR
The approximate length of miRNA at 21-23nt resulted in the difficulties in conventional PCR test. We used TaqMan® MicroRNA Assays (Applied Biosystems, Foster City, CA, USA) to examine miRNA differential expression profiling in PTC as recommended by the manufacturer. Sample RNA (10 ng) was reversely transcribed into cDNA by using specific stem-loop primers and TaqMan® MicroRNA Reverse Transcription Kit. With cDNA as the template, TaqMan MicroRNA Assay and TaqMan® Universal PCR Master Mix were used for the serial real-time PCR. RNU48 was used as an internal control to minimize the variation among reverse transcription, PCR, and samples. The data were collected, analyzed, and normalized by using the Applied Biosystems analysis software to determine the differential expression profiles of miRNAs. All the experiments were triplicate. Expression levels were calculated by using the relative quantification method (ΔΔCT) in ABI PRISM 7500 Sequence Detection System (Applied Biosystems), according to the manufacturer's protocol.
Statistical and Bioinformatics analysis of microarray data
In the process and analysis of data, the background was initially excluded. Any 'bad spot' that showed a signaling value deviation above 50% of the average of repeated spots and/or a spot CV above 0.5 would be deleted preceding the calculation of mean and standard deviation for repeated spots. The normalization was completed by the locally-weighted regression [13]. For the double labeling experiments, the ratio of two sets of detected signals (log2 transformed) and P-value for Student-t test were calculated. A P-value less than 0.05 were considered significant. Significantly differential miRNAs were defined as those showing a logarithm (log2) for the ratio of PTC signal to adjacent non tumor signal ≥1 or ≤-1.
Multiple target gene prediction software including MiRanda (http://www.mocrorna.org), Targetscan (http://www.targetscan.org), MirTarget2 (http://mirdb.org/miRDB), RNA22 (http://cbcsrv.watson.ibm.com/rna22.html), and microTv3.0 (http://diana.cslab.ece.ntua.gr/microT) were used to forecast some potential target genes showing a sequential differential expression profiling. The genes which were identified by at least three softwares were taken as target genes to minimize the false positivity. In order to further characterize the molecular functions of forecasted target genes, MAS database (http://bioinfo.capitalbio.com/mas3/) and GDM database (http://gdm.fmrp.usp.br/) were used to make a preliminary analysis of forecasted target genes.
RESULTS
Purity and integrity of RNA
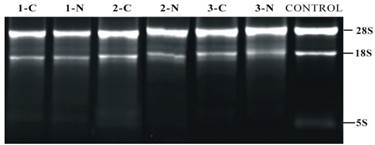
RNA extracted from PTC and adjacent non tumor tissues (n = 3) showed an OD260/280 >1.8 and OD260/230 > 1.5, suggesting the high purity of total RNA without any protein or DNA residual. The formaldehyde denaturing agarose gel electrophoresis image showed that the 28S:18S band neared 2:1 in a clear and trailing-free manner, without any nonspecific band (Fig. 2), suggesting the integrity of degradation-free RNA. The quality control experiment confirmed the suitability of RNA sample for further miRNA microarray and reverse transcription PCR.
Denaturing agarose gel electrophoresis of RNA. Number 1-3 delegate three different samples from patients in this study. Exp. 1-C means the adjacent non-tumorous tissue in patient one; 1-N means tumor tissue in the same patient.
Expression of microRNAs between PTC and normal tissue
We used a miRNA microarray to evaluate miRNA expression profiles between cancer tissues and adjacent non-tumorous tissues. The miRNA expression pattern was found to be significantly different (Table 1). Five miRNAs were found to be highly expressed in non-tumorous tissues; whereas ten miRNAs were highly expressed in cancer tissues. Among of them, miR-146b-5p, and miR-335, had most fold changes in PTC tissues.
miRNA differentially expressed in papillary thyroid carcinoma compared to paired cancer-adjacent non-tumor tissues.
| No. | miRNA name | Mean fold change (log2) | P-value |
|---|---|---|---|
| 1 | miR-146b-5p | 7.69 | 0.0151 |
| 2 | miR-221 | 4.86 | 0.0069 |
| 3 | miR-222 | 4.08 | 0.0051 |
| 4 | miR-34a | 3.91 | 0.0068 |
| 5 | miR-375 | 3.49 | 0.0394 |
| 6 | miR-31 | 2.75 | 0.0178 |
| 7 | miR-181a-2* | 2.52 | 0.0076 |
| 8 | miR-21 | 2.4 | 0.0020 |
| 9 | miR-181c | 2.27 | 0.0096 |
| 10 | miR-182 | 1.35 | 0.0411 |
| 11 | miR-130a | -1.42 | 0.0260 |
| 12 | miR-126 | -1.95 | 0.0145 |
| 13 | miR-374b | -2.25 | 0.0279 |
| 14 | miR-486-5p | -2.87 | 0.0411 |
| 15 | miR-335 | -3.54 | 0.0157 |
Note: Positive and negative log2 scores means significant down regulation and up regulation, respectively, in tumors. * The star represents that a mature microRNA that expressed from both the 5'-arm and the 3'-arm.
Expression of microRNAs between PTC and normal tissue and among stage I-III papillary thyroid carcinoma
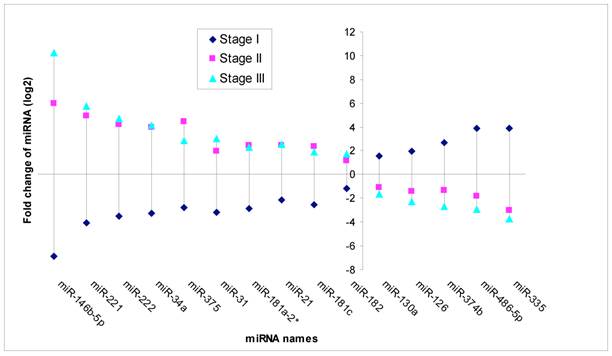
Based on MicroRNA array data, 15 miRNAs showed significant differential expression (P<0.05) throughout stage I-III PTC (Fig 3). Of these, five miRNAs were down regulated in stage II and stage III (fold change from -1.67 to -3.75), while unregulated in stage I (fold change from 1.58 to 3.92). Ten miRNAs were unregulated in stage II and stage III (fold change from 1.75 to 10.26), while down regulated in stage I (fold change from-1.19 to -6.85) compared to normal thyroid tissues.
Significant different expression miRNA through stage I, II and III. Note: Fold change means miRNA expression of tumor tissues compared to paired adjacent non tumor tissues. (P<0.05).
Quantitative real-time PCR outcomes
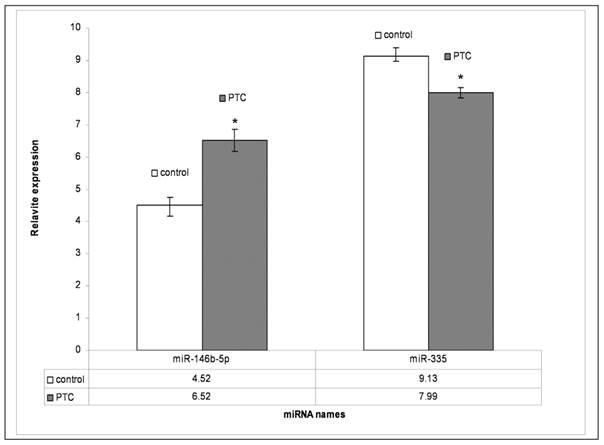
To validate the miRNA data obtained from array analysis, we performed individual qRT-PCR analysis of the two differentially expressed miRNAs miR-146b-5p and miR-335 in PTC and adjacent non tumor tissues. Compared to those in adjacent non tumor tissues, miR-146b-5p was significantly unregulated and miR-335 was significantly down regulated (P<0.05), respectively, in PTC (Fig. 4.)
qRT-PCR results of miR-146b-5p and miR-335. PTC means papillary thyroid carcinoma; Control means adjacent non-tumor tissue. P<0.05 compared to control.
Bioinformatics analysis outcomes
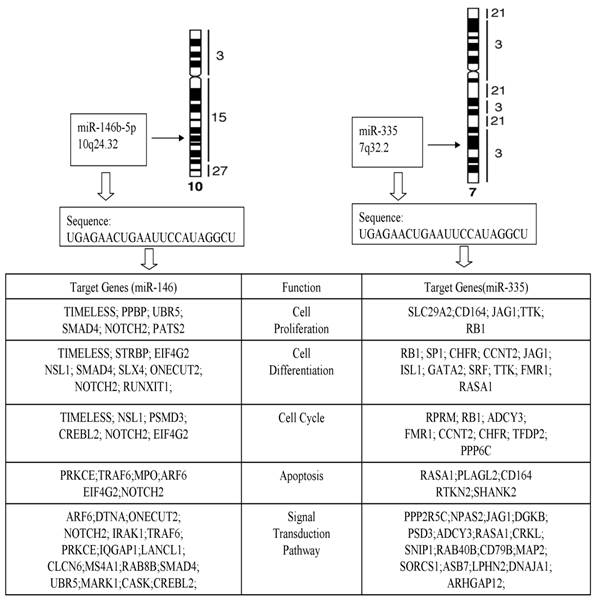
The computational target gene prediction identified 34 target genes for miR-146b-5p and 36 targeted genes for miR-335. The analysis of biological activities showed that many target genes were involved in cell proliferation, differentiation, apoptosis, cycle, and signaling transduction pathway (Fig. 5), suggesting the role of miRNA in the pathogenesis of PTC.
Target genes and function of miR-146b-5p and miR-335.
DISCUSSION
miRNA is involved in a series of critical activities in biological life cycle, including cell proliferation, differentiation, and apoptosis [14]. miRNA is also associated with tumor, cardiovascular, neurological, viral, and metabolic disorders [15-16]. The abnormal expressions of some miRNAs may lead to tumor genesis and disease progression [17]. Therefore, miRNA expression profiles may become useful novel biomarkers for tumor diagnostic and histological characterization.
miRNA expression profiles resulted in being different not only between tumors and healthy tissues but also between different histopathological phases of the same tissue, or between tumors at different stages of malignancy, and between primary tumors and metastases [18]. Our microarray analysis directly showed that, compared with paired adjacent non tumor tissues, 15 miRNAs showed significant differential expression profiling throughout stage I to III in patients. Among of them, seven miRNA exhibited up regulation associated with stage and five miRNAs had down regulation associated with different stages. Later stage showed most different change compared to early stage. Moreover, Stage II and Stage III showed reversed fold change in all miRNAs compared with stage I. These results implied that some things happened when tumor degrade from stage I to stage II. Some studies and several reviews have been published describing the specificity of miRNAs for different cancer stages. The results in our study verified that miRNA expression profiles reflected specific stages in tumor progression. However, this different expression of these miRNAs corresponded to a change in immune cell infiltration or a change to the expression in tumor cells will be next interesting research spot.
The normalized data were analyzed by using the paired Student-t test and cluster analysis, identifying significant expression profiles for 15 miRNAs compared to normal tissue samples. Some miRNAs in our study was same as previous studies reports [19]. He et al. [20] initially reported the potential role of miRNA in PTC. Their microarray identified 23 miRNAs with abnormal expression profiling, including 6 miRNAs with significantly high expression, whereas no significant low expression was identified. Usually, miRNAs are rarely up regulated in tumors, whereas the down regulation of miRNA is more frequently observed [21]. miRNAs are either up regulated or down regulated in PTC [20], probably due to the rare loss of heterozygosity in PTC [22-23]. Tetzlaff et al. [24] examined the expression profile of miRNA in paraffin-embedded sections and identified the up regulation of 13 miRNAs and the down regulation of 26 miRNAs in PTC, including miRNA-21, miRNA-31, miRNA-221, and miRNA-222, suggesting that formalin-fixed, paraffin embedded tissues was also suitable for the analysis of RNA. Another study identified the expressions of miR-221 and miR-222 in a negative correlation with p27Kipl, whereas miR-221and miR-222 could down regulate p27Kipl, further impairing the cell cycle [25]. He et al. [20] reported that miR-221 was highly expressed in both PTC and adjacent non tumor tissues, indicating the role of miR-221 in PTC as an oncogene.
Among these alter miRNA expression, miR-146 and miR-335 exhibited most fold change different between tumor tissues and paired adjacent tissues. Hence, quantitative real-time RT-PCR was performed for miR-146 and miR-335 in PTC and adjacent non tumor tissues to verify the microarray results. qRT-PCR results showed that good amplification efficiency and consistency with miRNA microarray. These findings confirmed the validity of microarray, suggesting the role of miRNA in the pathogenesis of PTC.
Furthermore, we predicted target genes of miR-146b-5p and miR-335 with most significant differential expression profiling by using online softwares available, including 34 target genes for miR-146b-5p and 36 for miR-335. The analysis of biological activities showed that many target genes were involved in cell proliferation, differentiation, apoptosis, cycle, and signaling transduction pathway.
Each miRNA targets a number of genes. Depending upon the pathways targeted, miRNAs can function as tumor suppressor or oncogene, and have the potential to be either depending upon the physiological context.
In humans, miR-146b-5p microRNAs are products of the miR-146b gene that is located on chromosome 10 at position q24.32. Like most pairs of 5p microRNAs, the two miR-146b microRNAs are generated from the opposite strands [the 5′ and 3′ arms] of a double-stranded stem region of precursor microRNA, pre-miR-146b, which in turn is derived from the primary miRNA146b RNA transcript. The expression of miR-146b-5p appears to be ubiquitous in human tissues, though higher levels are seen in lung, thymus and spleen.
The miR-146b-5p is over expression in PTCs and is regarded as a relevant diagnostic marker for this type of cancer [26]. Previous study already focused on some computational target genes in PTC or miR-146b-5p, such as SMAD4 [27]. A computational search revealed that miR-146b-5p putatively binds to the 3' untranslated region (UTR) of SMAD4, an important member of the transforming growth factor β (TGF- β) signaling pathway. Moreover, target gene NOTCH2 of miR-146b-5p was responsible for the aforementioned five activities in our bioinformatics predict model.
Another most significant changed miRNA in our study was miR-335. MiR-335, which is transcribed from the genomic region chromosome 7q32.2, has been reported to act as a tumor initiation and metastasis suppressor of breast cancer [28]. Normally miR-335 expressed in a variety of human tissues and deregulated in several types of tumors, suggesting complex biological roles of this miRNA during tumor genesis.
Previous study found that by altering Rb1 (pRb/p105) levels, miR-335 activates the p53 tumor suppressor pathway to limit cell proliferation and neoplastic cell transformation. DNA damage elicited an increase in miR-335 expression in a p53-dependent manner [29]. This demonstrated that miR-335 regulates Rb1 and controls cell proliferation in a p53-dependent manner.
In addition, a recent study has shown that miR-335 orchestrates cell proliferation, migration and differentiation in human mesenchymal stem cells [30]. These investigations indicate the important roles of miR-335 in tumor initiation and progression.
Another research reported that miR-335 knockdown promoted cell proliferation and prevented death induced by concurrently suppressing miR-21. This indicated that miR-335 is a proapoptotic, antimitogenic factor whose actions are antagonistic to miR-21. Computational analyses in this paper identified a gene, Jagged-1(JAG1), a Notch-receptor ligand, as presumptive targets of three of four ethanol-sensitive micro-RNAs. Combined knockdown of miR-335, -21, and -153 significantly increased Jagged-1 mRNA [31].
SMAD4, RB1 and JAG1 described in former study also appeared on our target gene list. These means more predicted genes such as NOTCH2, TIMESS of has-miR146b-5p and RASA1, GATA2, and SRF of hsa-miR-335 in our model could be picked up for further functional study.
Overall, these results in our study suggested that the abnormal expression in some miRNAs played a regulatory role in the development and progression of PTC, a consequence of multiple factors. The somatic cell mutation test with microarray to identify potential gene markers and classification was of great significance for the diagnosis of thyroid carcinoma [32]. Therefore, the further investigation to the function of computational miRNA target genes will help to promote the understanding of molecular mechanisms for tumor genesis and identify new potential biomarkers and therapeutic modalities for PTC.
Acknowledgements
We thank Dr. Qi Wang (Depts. of Medicine and Medical Biophysics, University of Toronto; Depts. of Applied Molecular Oncology, University Health Network) for the critical review and helpful discussions of the manuscript.
Competing Interests
The authors have declared that no competing interest exists.
References
1. Siegel R, Naishadham D, Jemal A. Cancer statistics. CA Cancer J Clin. 2012;62:10-29
2. De la Chapelle A, Jazdzewski K. MicroRNAs in thyroid cancer. J Clin Endocrinol Metab. 2011;96:3326-36
3. Vriens MR, Weng J, Suh I. et al. MicroRNA expression profiling is a potential diagnostic tool for thyroid cancer. Cancer. 2012;118:3426-32
4. Bartel DP. MicroRNAs: genomics, biogenesis, mechanism and function. Cell. 2012;116:281-297
5. Esmerina TL, Jean-Jacques M, George AC. Expression and function of micro RNAs in immune cells during normal or disease state. Int. J. Med. Sci. 2008;5:73-79
6. Cheng AM, Byrom MW, Shelton J. et al. Antisense inhibition of human miRNAs and indications for an involvement of miRNA in cell growth and apoptosis. Nucleic Acids Res. 2005;33:1290-1297
7. Calin GA, Sevignani C, Dumitru CD. et al. Human microRNA genes are frequently located at fragile sites and genomic regions involved in cancers. Proc Natl Acad Sci USA. 2004;101:2999-3004
8. Lu J, Getz G, Miska EA. MicroRNA expression profiles classify human cancers. Nature. 2005;435:834-838
9. Calin GA, Croce CM. MicroRNA signatures in human cancers. Nature Reviews Cancer. 2006;6:857-866
10. Lujambio A, Lowe SW. The microcosmos of cancer. Nature. 2012;482:347-55
11. Sobin LH, Wittekind C. The International Union against Cancer (UICC) TNM classification of malignant tumors, 6th edition. New York: Wiley Liss. 2002:22-26
12. Zhu Q, Hong A, Sheng N, Zhang X. et al. MicroParaflo biochip for nucleic acid and protein analysis. Methods Mol Biol. 2007;382:287-312
13. Bolstad BM, Irizarry RA, Astrand M. et al. A comparison of normalization methods for high density oligonucleotide array data based on variance and bias. Bioinformatics. 2003;19:185-193
14. Krützfeldt J, Poy MN, Stoffel M. Strategies to determine the biological function of microRNAs. Nat Genet. 2006;38:14-19
15. Kloosterman WP, Plasterk RH. The diverse functions of microRNAs in animal development and disease. Dev Cell. 2006;11:441-450
16. Akama T, Sue M, Kawashima A. et al. Identification of microRNAs that mediate thyroid cell growth induced by TSH. Mol Endocrinol. 2012;26:493-501
17. Osada H, Takahashi T. MicroRNAs in biological processes and carcinogenesis. Carcinogenesis. 2007;28:2-12
18. Sarah SR. MicroRNA: Stage-specific signatures. Nature Reviews Cancer. 2009:766-67
19. Nikiforova MN, Chiosea SI, Nikiforov YE. MicroRNA Expression Profiles in Thyroid Tumors. Endocr Pathol. 2009;20:85-91
20. He H, Jazdzewski K, Li W. et al. The role of microRNA genes in papillary thyroid carcinoma. Proc Natl Acad Sci USA. 2005;102:19075-19080
21. Iorio MV, Ferracin M, Liu CG. et al. MicroRNAs gene expression deregulation in human breast cancer. Cancer Res. 2005;65:7065-7070
22. Gillespie JW, Nasir A, Kaiser HE. Loss of heterozygosity in papillary and follicular thyroid carcinoma: a mini review. In Vivo. 2000;14:139-140
23. Huang Y, De la Chapelle A, Pellegata NS. Hypermethylation, but not LOH, is associated with the low expression of MT1G and CRABP1 in papillary thyroid carcinoma. Int J Cancer. 2003;104:735-744
24. Tetzlaff MT, Liu A, Xu X. et al. Differential expression of miRNAs in papillary thyroid carcinoma compared to multinodular goiter using formalin fixed paraffin embedded tissues. Endocr Pathol. 2007;18:163-173
25. Visone R, Russo L, Pallante P. et al. MicroRNAs (miR)-221 and miR-222, both overexpressed in human thyroid papillary carcinomas, regulate p27Kip1 protein levels and cell cycle. Endocr Relat Cancer. 2007;14:791-798
26. Chou CK, Chen RF, Chou FF. et al. miR-146b is Highly Expressed in Adult Papillary Thyroid Carcinomas with High Risk Features Including Extrathyroidal Invasion and the BRAFV600E Mutation. Thyroid. 2010;20:489-94
27. Geraldo MV, Yamashita AS, Kimura ET. MicroRNA miR-146b-5p regulates signal transduction of TGF-β by repressing SMAD4 in thyroid cancer. Oncogene. 2012;31:1910-22
28. Mingfeng S, Xiaoke Z, Sihan W. et al. Targeting oncogenic miR-335 inhibits growth and invasion of malignant astrocytoma cells. Mol Cancer. 2011;10:59
29. Scarola M, Schoeftner S, Schneider C. et al. miR-335 Directly Targets Rb1 (pRb/p105) in a Proximal Connection to p53-Dependent Stress Response. Cancer Res. 2010;70:6925-33
30. Tomé M, López-Romero P, Albo C. et al. miR-335 orchestrates cell proliferation, migration and differentiation in human mesenchymal stem cells. Cell Death Differ. 2011;18:985-995
31. Sathyan P, Golden HB, Miranda RC. Competing Interactions between Micro-RNAs Determine Neural Progenitor Survival and Proliferation after Ethanol Exposure: Evidence from an Ex Vivo Model of the Fetal Cerebral Cortical Neuroepithelium. J Neurosci. 2007;27:8546-57
32. Eszlinger M, Krohn K, Hauptmann S. et al. Perspectives for improved and more accurate classification of thyroid epithelial tumors. J Clin Endocrinol Metab. 2008;93:3286-3294
Author contact
![]() Corresponding author: Dr. Xiu-Bo Lu, Department of Thyroid Surgery of the First Affiliated Hospital of Zhengzhou University, Zhengzhou, People's Republic of China, 450052 E-mail: doctorliuyangcom.
Corresponding author: Dr. Xiu-Bo Lu, Department of Thyroid Surgery of the First Affiliated Hospital of Zhengzhou University, Zhengzhou, People's Republic of China, 450052 E-mail: doctorliuyangcom.