Impact Factor ISSN: 1449-1907

 Global reach, higher impact
Int J Med Sci 2013; 10(2):183-190. doi:10.7150/ijms.5308 This issue Cite
Research Paper
Inflammation and Oxidative Stress are Associated with the Prevalence of High Aankle-brachial Index in Metabolic Syndrome Patients without Chronic Renal Failure
Yinyin Zhang1,2, Jie Chen2,3, Kun Zhang1,2, Minyi Kong1, Tao Wang2, Renhua Chen1,2, Lily Wang2, Jingfeng Wang1,2 ![]() , Hui Huang1,2
, Hui Huang1,2 ![]()
1. Department of Cardiology, Sun Yat-sen Memorial Hospital of Sun Yat-sen University, Guangzhou, 510120 China
2. Guangdong Province Key Laboratory of Arrhythmia and Electrophysiology, Guangzhou, 510120 China
3. Department of Radiation Oncology, Sun Yat-sen Memorial Hospital of Sun Yat-sen University, Guangzhou, 510120 China
Received 2012-9-28; Accepted 2012-12-25; Published 2013-1-9
Abstract
Aims: High ankle-brachial index (ABI) is marker of increased cardiovascular morbidity and mortality, while the relationship and mechanism between high ABI and metabolic syndrome (MetS) are unclear. The objectives of this study were to determine the relationship and possible mechanism of MetS with high ABI.
Methods: 341 participants without CRF were recruited. Among these participants, 58 participants (ABI ≥ 1.3) were include in high ABI group and the other 283 participants (0.9 < ABI < 1.3) were include in normal ABI group. Furthermore, these 341 participants were also divided into MetS group (n = 54) and non-MetS group (n = 287). All participants received examinations including body mass index (BMI), ABI and related biochemical parameters.
Results: Compared with non-MetS group, the prevalence of high ABI was higher in MetS group (27.8% vs. 15%, p < 0.05). Participants with 3-4 metabolic risk factors had higher prevalence of high ABI than those with 0-1 metabolic risk factors (27.8% vs. 12.7%, p < 0.05). The prevalence of high ABI in overweight participants was higher than those with normal body weight. And the participants with hypertension also had higher prevalence of high ABI than normotensive participants. BMI, high-sensitivity C-reactive protein (hsCRP) and superoxide dismutase (SOD) were all higher in high ABI group than normal ABI group (p < 0.05).
Conclusions: More metabolic risk factors have increased the risk of high ABI. Inflammation and oxidative stress are associated with prevalence of high ABI in metabolic syndrome patients without chronic renal failure.
Keywords: High ankle-brachial index, metabolic syndrome, inflammation, oxidative stress, metabolic risk factors
Introduction
The ankle-brachial index (ABI) is a widely acknowledged tool used for the detection of peripheral artery disease. It is a maneuverable, noninvasive and reliable technique which has been widely used in clinical practice. ABI is usually classified as low (< 0.9), normal (0.9 - 1.3) and high (> 1.3). The Strong Heart Study was the first large prospective study to show the increased all-cause and cardiovascular disease (CVD) mortality risk for participants with high ABI [1]. And other studies confirmed that high ABI was a significant predictor of high cardiovascular mortality and all-cause mortality in patients on hemodialysis [2-4]. Pasqualini et al. also suggested that high ABI was independently associated with cardiovascular mortality and predicted all-cause mortality in hospitalized medical patients [5]. Furthermore, Bouthi et al. demonstrated that high ABI may be strongly associated with the prevalent of silent cerebral infarction in Japanese patients with type 2 diabetes [6]. The above evidences indicate that high ABI has a close correlation with increased risk of cardiovascular morbidity and mortality. Therefore, decreasing the prevalence of high ABI is very important for reducing the cardiovascular morbidity and mortality. But the associated factors of high ABI are still under debate. A recent study showed that age, body mass index (BMI) and blood pressures were significantly associated with ABI value in both sexes among people with type 2 diabetes mellitus (DM) in north India [7]. Another study indicated that, in Chinese population, those with high ABI had significant higher BMI and blood pressure [8].
Metabolic syndrome (MetS) is characterized by clustering of cardiovascular risk factors including adiposity, hyperglycemia, hypertension and dyslipidemia. It has become one of the major public health challenges in developed and developing countries. High BMI and blood pressure are the metabolic risk factors and presumed to correlate with high ABI. However, data on the association between MetS and high ABI are lacking now. Furthermore, high ABI is considered to be caused by non-compressible distal arteries, probably in relation to medial arterial calcification (MAC) [2, 9]. MAC is a common vascular complication in chronic renal failure (CRF) and high ABI is often observed in patients with CRF [2, 3]. The development of high ABI in CRF patients is strongly linked to dysregulated mineral metabolism of serum phosphate and calcium (Ca) levels. But whether the prevalence of high ABI is increased in MetS patients without CRF has not been reported. A second area of controversy is whether different metabolic risk factors produce the same risk of high ABI and whether the risk of high ABI caused by MetS correlates with the amount of metabolic risk factors.
The aim of the current study was to investigate the relationship between high ABI and different metabolic risk factors to identify the biological parameters that may account for the development of high ABI in patients without CRF. Furthermore, this study explored whether high ABI was associated with the amount of metabolic risk factors.
Methods
Ethics Statement
The study protocol conformed to the ethical guidelines of the 1975 Declaration of Helsinki as reflected in a priori approval by the Ethics Committee of Sun Yat-sen Memorial Hospital of Sun Yat-sen University. Informed consent was obtained from each participant.
Study population and data collection
From November 2009 to April 2012, 341 subjects came to the Sun Yat-sen Memorial Hospital for either routine physical examinations or hospitalizations were enrolled in this study. The subjects were studied by anonymous means. All these subjects underwent ABI test. Data collection included demographic data, medical history, diagnosis and treatment of comorbidities, anthropometric measures, biochemical and hematological examinations. Individuals with CRF (serum creatinine ≥ 133μmol/L), overt congestive heart failure, familial hyperlipidemia, severe hepatic dysfunction, either one leg with ABI ≤ 0.9, or an age more than 80 years or less than 20 years were excluded from this study. Meanwhile, those with carcinoma, potential infectious or inflammatory diseases, immunologic diseases, and corticosteroid therapy were also excluded from the study.
Grouping criteria
MetS group and non-MetS group
According to the MetS diagnostic criteria of Chinese Medical Association (CMA) Diabetes Branch in 2004, patients with three or more of the following components can be diagnosed with MetS:1) overweight or obesity: BMI ≥ 25.0 kg/m2; 2) hyperglycemia: fasting plasma glucose (FPG) ≥ 6.1mmol/L and/or 2-hour plasma glucose (2 h-PG) ≥ 7.8mmol/L, or a previous diagnosis of DM with current anti-diabetic therapy; 3) hypertension: blood pressure (BP) ≥ 140/90 mmHg, or by a previous diagnosis of hypertension with current antihypertensive medication; 4) dyslipidemia: TG ≥ 1.7mmol/L, and/or HDL-C < 0. 9mmol/L in man, or HDL-C < 1.0 mmol/L in women [10]. Among these 341 participants, 204 subjects had 0-1 metabolic risk factors, 83 subjects had 2 metabolic risk factors and the other 54 subjects had 3-4 metabolic risk factors. Therefore, 54 subjects with 3 - 4 metabolic risk factors were defined as the MetS group, and the other 287 subjects with 0 - 2 metabolic risk factors were defined as the non-MetS group.
High ABI group and normal ABI group
Among these 341 participants, 58 members had ABI ≥ 1.3, and were defined as the high ABI group. The other 283 participants with normal ABI (0.9 < ABI < 1.3) were defined as the normal ABI group [2].
Collection of clinical and laboratory parameters
All participants received a physical examination including the assessments of arterial blood pressure, BMI and ABI. Blood biochemistry parameters including serum uric acid (UA), alkaline phosphatase (ALP), creatinine (Cr), Ca, phosphate (P), high-sensitivity C-reactive protein (hsCRP), total cholesterol (TC), triglycerides (TG), high-density lipoprotein cholesterol (HDL-C), low-density lipoprotein cholesterol (LDL-C), apolipoprotein A (apoA), apolipoprotein B (apoB), fasting plasma glucose (FPG), cholinesterase (CHE), and superoxide dismutase (SOD) were measured using blood samples drawn by venipuncture after at least 10 hours of overnight fasting. Venous serum samples were measured by a standardized and certified program using an automatic biochemical analyzer (7170A, HITACHI, Japan).
Measurement of ABI
The ABI was measured with a non-invasive vascular screening device (VP-1000, OMRON, Japan) using the recommended process provided by the manufacturer. After placing the participants in a supine position for 10 min, a well-trained examiner performed ABI measurements. The systolic pressure (SBP) was measured in the posterior tibial and dorsal pedal arteries of both legs and in the brachial artery of both arms. The ABI was calculated for each leg by dividing the highest lower limb SBP value by the highest upper limb SBP value. Normal ABI value detected in each side was defined by range of 0.9-1.3. Participants, who had an ABI value ≥ 1.3 in either leg were defined as having high ABI [11]. Participants who had one leg with low ABI whereas the other leg with high ABI was excluded from this study.
Diagnosis of comorbidities
Hypertension was defined as SBP≥140 mmHg and/or diastolic blood pressure (DBP) ≥ 90 mmHg on at least three different occasions, or by a previous diagnosis of hypertension with current antihypertensive medication according to the ESH/ESC 2007 Guideline for management of hypertension [12]. The blood pressure was measured in the position of upper arm brachial artery with mercurial sphygmomanometer. BMI was calculated from values as body weight (kg) divided by the square of the height (m2) and overweight was defined as a BMI ≥ 25.0 kg/ m2, according to the Chinese Guideline of Prevention and Treatment of Dyslipidemia in adults in 2007 [13]. According to the American Diabetes Association criterion in 2007, DM was defined as FPG ≥ 7.0mmol/L and/or 2hPG ≥ 11.1mmol/L, or by a previous diagnosis of DM with current anti-diabetic therapy [14].
Statistical analysis
Data were presented as frequencies for categorical variables, mean values with standard deviation (SD) for continuous variables, and median values with 25% and 75% percentiles for ordinal variables. The following data were compared between the MetS and non-MetS groups, and between the high and normal ABI groups, with methods of the independent samples t-test, Mann-Whitney U test and Pearson chi-square when appropriate. Binary logistic regression analysis was used to identify the independent factors for high ABI. All statistical analyses were performed using the software SPSS 16.0. For all statistical tests, two-tailed P-value < 0.05 indicated the statistical significance of the results.
Results
Comparison of the demographic and clinical characteristics of the participants with and without MetS
Demographic and biochemical data of these two groups are shown in Table 1. Age and sex distributions were similar for these two groups. Compared with the non-MetS group, participants in the MetS group had significantly higher BMI values (27.25 ± 2.59 vs. 23.87 ± 2.99, p < 0.05). And the subjects in the MetS group had significantly higher levels of TG, UA and FPG than those in the non-MetS group (2.39 (1.71-3.54) vs. 1.34 (0.92-1.86), p < 0.001; 438.56 ±109.41 vs. 382.28 ± 93.46, p < 0.001; 6.30 (5.38-7.33) vs. 5.20 (4.70-5.60), p < 0.001; respectively). Moreover, in comparison to the non-MetS group, lower levels of HDL-C and ApoA/ApoB were found in the MetS group (1.19 ± 0.31 vs. 1.38 ± 0.34, p < 0.001 and 1.29 (1.17-1.57) vs. 1.49(1.23-1.80), p < 0.05, respectively). Furthermore, the levels of hsCRP and CHE were significantly higher in the MetS group than in the non-MetS group (2.26 (1.19-4.35) vs. 1.45 (0.82-3.08), p < 0.01 and 9914.1 ± 1539.71 vs. 9051.1 ± 1993.07, p < 0.01, respectively). The results also showed that there was a significant difference in the prevalence of high ABI between the MetS group and the non-MetS group (27.8% vs. 15%, p < 0.05).
Comparison of the demographic and biochemical data between groups with and without metabolic syndrome.
| MetS group | Non-MetS group | P value | |
|---|---|---|---|
| Number(n) | 54 | 287 | |
| Age(year) | 59±13 | 56±12 | 0.096 |
| Male gender (%) | 66.7 | 58.5 | 0.264 |
| BMI (kg/m2) | 27.25±2.59 | 23.87±2.99 | 0.000* |
| ALP(U/L) | 69(56-80) | 62(52-76) | 0.057 |
| Ca (mmol/L) | 2.31±0.18 | 2.30±0.12 | 0.442 |
| P (mmol/L) | 1.17±0.18 | 1.13±0.18 | 0.115 |
| TC(mmol/L) | 5.41±1.32 | 5.12±1.04 | 0.078 |
| LDL-C (mmol/L) | 3.15±0.96 | 3.12±0.88 | 0.820 |
| HDL-C(mmol/L) | 1.19±0.31 | 1.38±0.34 | 0.000* |
| TG(mmol/L) | 2.39(1.71-3.54) | 1.34(0.92-1.86) | 0.000* |
| Apo A (g/L) | 1.15(1.02-1.29) | 1.19(1.06-1.38) | 0.160 |
| Apo B (g/L) | 0.87±0.17 | 0.82±0.18 | 0.077 |
| ApoA/ApoB | 1.29(1.17-1.57) | 1.49(1.23-1.80) | 0.005* |
| HsCRP (mg/L) | 2.26(1.19-4.35) | 1.45(0.82-3.08) | 0.008* |
| Cr (μmol/L) | 105.5(90.5-114.25) | 96(87-108) | 0.064 |
| UA (μmol/L) | 438.56±109.41 | 382.28±93.46 | 0.000* |
| FPG(mmol/L) | 6.30(5.38-7.33) | 5.20(4.70-5.60) | 0.000* |
| CHE (U/L) | 9914.1±1539.71 | 9051.1±1993.07 | 0.003* |
| SOD | 143.11±32.80 | 139.44±27.72 | 0.387 |
| High ABI(%) | 27.8 | 15.0 | 0.022* |
Values are expressed as mean±S.D., median (lower, upper quartiles) or as percentage (%) of patients. P-value based on Pearson chi-square for categorical variables and t-test for parametric continuous variables is for comparison between the MetS and non-MetS groups (*P < 0.05). Mann-Whitney U test is used to compare nonparametric variables between the MetS and the control groups (*P < 0.05).
Abbreviations: ABI, ankle-brachial index; ALP, alkaline phosphatase; Apo, apolipoprotein; BMI, body mass index; Ca, calcium; CHE, cholinesterase; Cr, creatinine; FPG, fasting plasma glucose; HDL-C, high-density lipoprotein cholesterol; hsCRP, high-sensitivity C-reactive protein; LDL-C, low-density lipoprotein cholesterol; P, phosphate; SOD, Superoxide dismutase; TC, total cholesterol; TG, triglycerides; UA, uric acid.
Comparison of the demographic and biochemical data of the participants with high and normal ABI
Table 2 presents the demographic and biochemical data of high and normal ABI groups. Compared with normal ABI group, participants in high ABI group had larger BMI values (25.20 ± 3.54 vs. 24.24 ± 3.08, p<0.05). The biochemical data showed that hsCRP level was significantly higher in the high ABI group (2.86 (1.35-8.14) than the normal ABI group (1.40 (0.82-2.89), p < 0.001). However, the levels of Ca and SOD were significantly lower in the high ABI group than the normal ABI group (2.25 ± 0.14 vs. 2.31 ± 0.13, p < 0.05 and 128.03 ± 25.34 vs. 142.47 ± 28.61, p < 0.001, respectively). No statistically significant differences were observed in age, gender, FPG and serum lipid levels between participants in high and normal ABI groups (p > 0.05).
Comparison of the demographic and biochemical data between the high ABI and normal ABI groups.
| High ABI group | Normal ABI group | P value | |
|---|---|---|---|
| Number(n) | 58 | 283 | |
| Age(year) | 58±13 | 57±12 | 0.468 |
| Male gender (%) | 58.6 | 60.1 | 0.837 |
| BMI (kg/m2) | 25.20±3.54 | 24.24±3.08 | 0.036* |
| ALP(U/L) | 65(54.75-79.25) | 63(52-76) | 0.466 |
| Ca (mmol/L) | 2.25±0.14 | 2.31±0.13 | 0.005* |
| P (mmol/L) | 1.18±0.19 | 1.16±0.17 | 0.302 |
| TC(mmol/L) | 5.10±1.28 | 5.18±1.06 | 0.590 |
| LDL-C (mmol/L) | 3.03±0.89 | 3.15±0.89 | 0.375 |
| HDL-C(mmol/L) | 1.33±0.35 | 1.35±0.34 | 0.592 |
| TG(mmol/L) | 1.50(0.93-2.29) | 1.47(0.98-2.06) | 0.874 |
| Apo A (g/L) | 1.16(1.04-1.33) | 1.19(1.06-1.38) | 0.262 |
| Apo B (g/L) | 0.80±0.21 | 0.84±0.17 | 0.138 |
| ApoA/ApoB | 1.46(1.20-1.89) | 1.44(1.23-1.73) | 0.628 |
| HsCRP (mg/L) | 2.86(1.35-8.14) | 1.40(0.82-2.89) | 0.000* |
| Cr (μmol/L) | 93(84.75-106.25) | 99(89-110) | 0.063 |
| UA (μmol/L) | 393.72±104.94 | 390.67±96.91 | 0.830 |
| FPG(mmol/L) | 5.30(4.68-5.70) | 5.20(4.80-5.70) | 0.750 |
| CHE (U/L) | 8951.7±2007.45 | 9236.1±1940.59 | 0.313 |
| SOD | 128.03±25.34 | 142.47±28.61 | 0.000* |
Values are expressed as mean±S.D., median (lower, upper quartiles) or as percentage (%) of participants. P-value based on Pearson chi-square for categorical variables and t-test for parametric continuous variables is for comparison between the high and normal ABI groups (*P < 0.05). Mann-Whitney U test is used to compare nonparametric variables between the high and normal ABI groups (*P < 0.05).
Abbreviations: ABI, ankle-brachial index; ALP, alkaline phosphatase; Apo, apolipoprotein; BMI, body mass index; Ca, calcium; CHE, cholinesterase; Cr, creatinine; FPG, fasting plasma glucose;HDL-C, high-density lipoprotein cholesterol; hsCRP, high-sensitivity C-reactive protein; LDL-C, low-density lipoprotein cholesterol; P, phosphate;SOD, Superoxide dismutase; TC, total cholesterol; TG, triglycerides; UA, uric acid.
Correlation between the prevalence of high ABI and the amount of metabolic risk factors
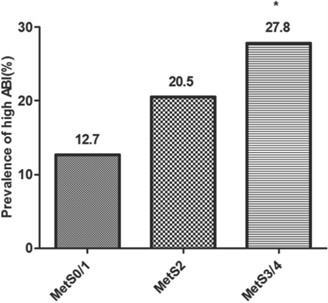
The correlation between the prevalence of high ABI and the amount of metabolic risk factors were demonstrated by Pearson chi-square (Figure 1). The prevalence of high ABI was 12.7% for the participants with 0-1 metabolic risk factors, 20.5% for those with 2 metabolic risk factors, and 27.8% for those with 3-4 metabolic risk factors. The prevalence of high ABI was statistically significant among three groups with different amount of metabolic risk factors (p < 0.05). Furthermore, the prevalence of high ABI between either two groups with different amount of metabolic risk factors was also compared. The results showed that the participants with three or four metabolic risk factors had significantly higher prevalence of high ABI than those without or only with one metabolic risk factor (p < 0.05). However, the prevalence of high ABI was not significantly different between the participants with 0/1, 2 and 3/4 metabolic risk factors (p > 0.05).
Correlation between the prevalence of high ankle-brachial index (ABI) and the amount of metabolic risk factors. Values are presented as percentage (%). MetS0/1 indicates participants without or with one metabolic risk factor; MetS2, participants with only two metabolic risk factors; MetS3/4, participants with three or four metabolic risk factors. Pearson chi-square is used for comparison of the prevalence of high ABI among three groups with different amount of metabolic risk factors. The prevalence of high ABI is statistically significant among three groups with different amount of metabolic risk factors (χ2 =7.773 and P=0.021). The prevalence of high ABI between either two groups with different amount of metabolic risk factors are also compared using pearson chi-square. *P < 0.05 vs. group of MetS0/1.
Correlation between the prevalence of high ABI and different metabolic risk factors
Pearson chi-square was used to study whether the prevalence of high ABI correlated with different metabolic risk factors (Table 3). It was demonstrated that the prevalence of high ABI in the overweight participants was higher than those with normal body weight (22.3% vs. 13.7%, p < 0.05). And the participants with hypertension also had significantly higher prevalence of high ABI than those without hypertension (26.2% vs. 11.9%, p < 0.01). But the prevalence of high ABI was not significantly different between participants with and without hyperglycemia (p > 0.05), and were not significantly different between participants with and without dyslipidemia (p > 0.05).
Comparison of the prevalence of high ankle-brachial index (ABI) between participants with different metabolic risk factors.
| High ABI | Normal ABI | P value | |
|---|---|---|---|
| overweight | 22.3%(29) | 77.7%(101) | 0.041* |
| Normal body weight | 13.7%(29) | 86.3%(182) | |
| Hypertension | 26.2%(32) | 73.8%(90) | 0.001** |
| Without hypertension | 11.9%(26) | 88.1%(193) | |
| Hyperglycemia | 25.4%(15) | 74.6%(44) | 0.059 |
| Without hyperglycemia | 15.2%(43) | 84.8%(239) | |
| Dyslipidemia | 16.9%(24) | 83.1%(118) | 0.964 |
| Without dyslipidemia | 17.1%(34) | 82.9%(165) |
Values are presented as percentage (%). P-value based on Pearson chi-square for categorical variable is for comparison between groups with different metabolic risk factors. *P < 0.05 vs. participants with normal body weight. **P < 0.01 vs. participants without hypertension.
Independent factors for high ABI
Binary logistic regression analysis with the enter method was used to identify the independent factors for high ABI (Table 4).BMI (OR 1.099; 95% CI: 1.005-1.202; p<0.05), Ca (OR 0.036; 95% CI: 0.003-0.378; p<0.01), hsCRP (OR 1.036; 95% CI: 1.006-1.068; p<0.05), SOD (OR 0.980; 95% CI: 0.969-0.991; p<0.01) and hypertension (OR 2.597; 95% CI: 1.462-4.612; p<0.01) were all proved to be the independent predictors for the presence of high ABI.
The binary logistic regression analysis of the independent factors for high ankle-brachial index (ABI).
| B | OR | 95%CI | p | |
|---|---|---|---|---|
| Male gender | -0.060 | 0.942 | 0.530-1.672 | 0.837 |
| Age | 0.009 | 1.009 | 0.986-1.032 | 0.467 |
| BMI | 0.095 | 1.099 | 1.005-1.202 | 0.038* |
| ALP | 0.006 | 1.006 | 0.994-1.018 | 0.349 |
| Ca | -3.327 | 0.036 | 0.003-0.378 | 0.006* |
| P | 0.838 | 2.312 | 0.471-11.339 | 0.302 |
| TC | -0.072 | 0.930 | 0.715-1.210 | 0.589 |
| TG | 0.013 | 1.013 | 0.799-1.284 | 0.913 |
| LDL-C | -0.145 | 0.865 | 0.628-1.191 | 0.374 |
| HDL-C | -0.230 | 0.795 | 0.344-1.838 | 0.591 |
| ApoA | -0.790 | 0.454 | 0.135-1.526 | 0.202 |
| ApoB | -1.213 | 0.297 | 0.060-1.477 | 0.138 |
| ApoA/ApoB | 0.279 | 1.322 | 0.704-2.483 | 0.386 |
| HsCRP | 0.036 | 1.036 | 1.006-1.068 | 0.018* |
| Cr | -0.017 | 0.983 | 0.965-1.002 | 0.076 |
| UA | 0.000 | 1.000 | 0.997-1.003 | 0.829 |
| FPG | -0.056 | 0.946 | 0.776-1.153 | 0.582 |
| CHE | 0.000 | 1.000 | 1.000-1.000 | 0.312 |
| SOD | -0.020 | 0.980 | 0.969-0.991 | 0.001* |
| Hypertension | 0.954 | 2.597 | 1.462-4.612 | 0.001* |
Binary logistic regression analysis with the enter method is used to assess the independent factors for high ABI in unadjusted model (*P < 0.05).
Abbreviations: ALP, alkaline phosphatase; Apo, apolipoprotein; BMI, body mass index; Ca, calcium; CHE, cholinesterase; Cr, creatinine; FPG, fasting plasma glucose; HDL-C, high-density lipoprotein cholesterol; hsCRP, high-sensitivity C-reactive protein; LDL-C, low-density lipoprotein cholesterol; P, phosphate; SOD, Superoxide dismutase; TC, total cholesterol; TG, triglycerides; UA, uric acid.
Discussion
CVD remains as the leading cause of mortality and morbidity worldwide. And high ABI was associated with the elevated morbidity of CVD [5, 6]. Furthermore, high ABI was shown to have a close relationship with all-cause mortality [1, 4]. Prevention the progression of high ABI is important to reduce the mortality and morbidity of CVD. The precise pathophysiologic mechanisms underlying an elevated ABI are not clearly elucidated. MAC is characterized by high ABI, via its preferential effect on lower extremity artery stiffness [2, 9]. Ix et al. demonstrated that an ABI > 1.30 had high specificity (99%) and positive predictive value (93%) for MAC [9]. Prospective studies demonstrated that MetS was an independent predictor of CVD [15]. In the study of Lee et al., a significantly positive correlation was found between coronary artery calcification and MetS, but the participants with CRF were not excluded [16]. Moreover, many studies found that the metabolic risk factors might have independent correlation with high ABI [7, 8]. The present study was the first one to confirm that, among the participants without CRF, those with MetS had significant higher prevalence of high ABI than the participants without MetS. This finding suggested that participants with MetS have higher risk of high ABI than those without MetS.
Controversy exists about whether high ABI is associated with the amount of metabolic risk factors. We explored this issue and found that the participants with three or four metabolic risk factors had significantly higher prevalence of high ABI than those without or only with one risk factor for MetS. But the prevalence of high ABI was not significantly different between the participants with 0/1, 2 and 3/4 metabolic risk factors. This result indicated that participants with more metabolic risk factors had higher risk of high ABI than those with less metabolic risk factors. Another controversial area of investigation is about whether different metabolic risk factors provide different prognostic information to high ABI. It was verified that the prevalence of high ABI in the overweight participants was higher than those with normal body weight, which suggested that overweight contributed to the development of high ABI. Our findings are largely consistent with prior studies [7, 8, 17]. Adragao et al. showed that BMI was not significantly different between patients with normal and high ABI. But this study only recruited the haemodialysis patients [2]. Moreover, the participants with hypertension were also identified to have significantly higher prevalence of high ABI than those without hypertension. This result was similar to some studies which suggested that participants with high ABI had higher level of blood pressure than those with normal ABI [7, 8, 17]. However, the study showed that the prevalence of high ABI was not significantly different between participants with and without hyperglycemia, and was not significantly different between participants with and without dyslipidemia. Keattiyoat et al. also compared the risk factors between participants with normal or high ABI and demonstrated that the prevalence of DM and dyslipidemia were similar between the two ABI groups [18]. And Victor et al. also confirmed these results [19]. The above findings indicated that, among the metabolic risk factors, overweight and hypertension might have more influence on the progression of high ABI than hyperglycemia and dyslipidemia.
In this study, we demonstrated that the participants with MetS had higher level of hsCRP than those without MetS. Recent studies in the United States, China and Mexico have suggested that CRP, a biomarker of low-grade inflammation, might have an effect on the development of MetS [20-22]. The increasing evidence presumes that chronic, low-grade systemic inflammation may be a common element involving in the pathogenesis of MetS [23-25]. Furthermore, this study also found that, compared with the participants without MetS, the level of CHE was significantly higher in those with MetS. Natalia et al. revealed that in male patients with subclinical chronic inflammation and hsCRP concentrations < 1mg/L, a significant positive correlation was observed between hsCRP and CHE [26]. Therefore, the increased level of CHE in participants with MetS further confirmed that MetS was a condition accompanied with chronic, low-grade inflammation.
Our study also found that the level of hsCRP in the participants of high ABI group was higher than the normal ABI group. Michael et al. verified that participants with high ABI had higher level of CRP and IL-6 than those with normal ABI [27]. Joachim et al. also demonstrated that, among 4,972 participants without clinical CVD, those with high ABI had higher level of CRP than the participants with normal ABI [28]. Our finding further indicated that inflammation might be involved in the progression of high ABI. Moreover, the present study showed that the values of BMI increased in the high ABI group. This result was similar to some studies [7, 8]. Recently, obesity was considered as a state of chronic inflammation [24]. Higher level of BMI indicates an increase of adipose tissue and the presence of obesity-related inflammatory state. Then the higher level of BMI and hsCRP in the high ABI group suggested that inflammation was a leading cause of high ABI.
SOD is a scavenger enzyme which catalyses the dismutation (reduction-oxidation) of the superoxide anion (O2-.), a toxic free radical generated during normal cellular respiration. It is generally regarded as an important antioxidant enzyme. In this study, SOD was down-regulated in the high ABI group, which indicated that an increase of reactive oxygen species in high ABI group resulted in the reduction of SOD. A recent study found that in an animal model of vascular calcification (VC), the activity of SOD was suppressed [29]. Yamada et al investigated the role of oxidative stress in the pathogenesis of VC in uremic rats and the data suggested that oxidative stress induced by uremia was involved in the pathogenesis of VC in chronic kidney disease [30]. All the evidences suggested that oxidative stress played a critical role in the pathogenesis of VC. Furthermore, multiple groups have newly identified that both inflammation and oxidative stress promoted VC by activation of osteogenic gene regulatory programs [31]. And the development of VC results in the progression of high ABI. For the close relationship between high ABI and VC, we conjectured that oxidative stress also played a part in the process of high ABI. Nowadays, a range of data from many studies indicated that elevated oxidative stress had close correlation with the MetS [32-34]. And this is also supported by several animal studies where anti-oxidants have shown promise in the prognosis of MetS [35, 36]. Furthermore, oxidative stress is suggested to be associated with inflammation. Park et al. showed that oxidative stress measured by increased concentration of urine 8-epi-PGF(2α) strongly linked to the level of CRP and the results was independent of obesity and insulin resistance in non-diabetic postmenopausal women [37]. A recent study demonstrated that among U.S. adolescents, serum antioxidant concentrations were inversely associated with MetS status and the level of CRP [34].The above evidences show that both oxidative stress and inflammation are implicated in the processes of high ABI and MetS, and a close correlation exists between these two mechanisms. The participants with MetS have increased risk of high ABI because of the similar pathogenesis shared by high ABI and MetS.
The present study has its limitations. First of all, the present population is restricted in size, geographical and ethnic content to participants without CRF in China and validation in other populations is needed. Furthermore, the cross-sectional design of this study may mask possible cause-effect relations. Finally, larger and longer-term follow up studies will be needed to further determine the association between high ABI and MetS.
Conclusions
The present study reveals that, among the participants without CRF, those with MetS had increased higher prevalence of high ABI than the participants without MetS. Moreover, the participants with more metabolic risk factors have elevated risk of high ABI. Among the metabolic risk factors, overweight and hypertension might have more influence on the progression of high ABI than hyperglycemia and dyslipidemia. MetS can predict the likelihood of high ABI in patients without CRF. Early management of MetS might be helpful to prevent the progression of high ABI in patients without CRF. Our study suggested that inflammation and oxidative stress attributed to high ABI in metabolic syndrome patients without chronic renal failure. And we will study further to test the mechanism involved in this process.
Abbreviations
ABI: ankle-brachial index; ALP: alkaline phosphatase; Apo: apolipoprotein; BMI: body mass index; Ca: calcium; CHE: cholinesterase; Cr: creatinine; CRF: chronic renal failure; CVD: cardiovascular disease; DBP: diastolic blood pressure; DM: diabetes mellitus; FPG: fasting plasma glucose; 2 h-PG: 2-hour plasma glucose; HDL-C: high-density lipoprotein cholesterol; LDL-C: low-density lipoprotein cholesterol; hsCRP: high-sensitivity C-reactive protein; MAC: medial arterial calcification; MetS: metabolic syndrome; OR: odds ratio; P: phosphate; SBP: systolic pressure; SD: standard deviation; SOD: superoxide dismutase; TC: total cholesterol; TG: triglycerides; UA: uric acid; VC: vascular calcification.
Acknowledgements
This work was supported in part by National Natural Science Foundation of China [81170647, 91029742 and 30973207 to Hui Huang, 30971262 to Jingfeng Wang].
Competing Interests
The authors have declared that no competing interest exists.
References
1. Resnick HE, Lindsay RS, McDermott MM. et al. Relationship of high and low ankle brachial index to all-cause and cardiovascular disease mortality: the Strong Heart Study. Circulation. 2004;109:733-9
2. Adragao T, Pires A, Branco P. et al. Ankle--brachial index, vascular calcifications and mortality in dialysis patients. Nephrol Dial Transplant. 2012;27:318-25
3. Kitahara T, Ono K, Tsuchida A. et al. Impact of brachial-ankle pulse wave velocity and ankle-brachial blood pressure index on mortality in hemodialysis patients. Am J Kidney Dis. 2005;46:688-96
4. Ono K, Tsuchida A, Kawai H. et al. Ankle-brachial blood pressure index predicts all-cause and cardiovascular mortality in hemodialysis patients. J Am Soc Nephrol. 2003;14:1591-8
5. Pasqualini L, Schillaci G, Pirro M. et al. Prognostic value of low and high ankle-brachial index in hospitalized medical patients. Eur J Intern Med. 2012;23:240-4
6. Bouchi R, Babazono T, Takagi M. et al. Non-linear association between ankle-brachial pressure index and prevalence of silent cerebral infarction in Japanese patients with type 2 diabetes. Atherosclerosis. 2012;222:490-4
7. Doza B, Kaur M, Chopra S. et al. Cardiovascular Risk Factors and Distributions of the Ankle-Brachial Index among Type 2 Diabetes Mellitus Patients. Int J Hypertens. 2012;2012:485812
8. Niu F, Zhang L, Wang X. et al. The Association between Changes in Urinary Albumin-to-Creatinine Ratio and Risk of Abnormal Ankle-Brachial Index in a Community-Based Chinese Population. J Atheroscler Thromb. 2012
9. Ix JH, Miller RG, Criqui MH. et al. Test characteristics of the ankle-brachial index and ankle-brachial difference for medial arterial calcification on X-ray in type 1 diabetes. J Vasc Surg. 2012;56:721-7
10. Lu YH, Lu JM, Wang SY. et al. [Comparison of the diagnostic criteria of metabolic syndrome by International Diabetes Federation and that by Chinese Medical Association Diabetes Branch]. Zhonghua Yi Xue Za Zhi. 2006;86:386-9
11. Andrade JL, Schlaad SW, Koury Junior A. et al. Prevalence of lower limb occlusive vascular disease in outclinic diabetic patients. Int Angiol. 2004;23:134-8
12. Bonny A, Lacombe F, Yitemben M. et al. The 2007 ESH/ESC guidelines for the management of arterial hypertension. J Hypertens. 2008;26:825
13. Hu DY, Ding RJ. [Guidelines for management of adult dyslipidemia in China]. Zhonghua Nei Ke Za Zhi. 2008;47:723-4
14. American Diabetes Association. Diagnosis and classification of diabetes mellitus. Diabetes Care. 2007;30(Suppl 1):S42-7
15. Gami AS, Witt BJ, Howard DE. et al. Metabolic syndrome and risk of incident cardiovascular events and death: a systematic review and meta-analysis of longitudinal studies. J Am Coll Cardiol. 2007;49:403-14
16. Lee HT, Shin J, Lim YH. et al. The relationship between coronary artery calcification and bone mineral density in patients according to their metabolic syndrome status. Korean Circ J. 2011;41:76-82
17. Tison GH, Ndumele CE, Gerstenblith G. et al. Usefulness of baseline obesity to predict development of a high ankle brachial index (from the Multi-Ethnic Study of Atherosclerosis). Am J Cardiol. 2011;107:1386-91
18. Wattanakit K, Folsom AR, Duprez DA. et al. Clinical significance of a high ankle-brachial index: insights from the Atherosclerosis Risk in Communities (ARIC) Study. Atherosclerosis. 2007;190:459-64
19. Aboyans V, McClelland RL, Allison MA. et al. Lower extremity peripheral artery disease in the absence of traditional risk factors. The Multi-Ethnic Study of Atherosclerosis. Atherosclerosis. 2011;214:169-73
20. Yang T, Chu CH, Hsieh PC. et al. C-reactive protein concentration as a significant correlate for metabolic syndrome: a Chinese population-based study. Endocrine. 2012
21. Rutter MK, Meigs JB, Sullivan LM. et al. C-reactive protein, the metabolic syndrome, and prediction of cardiovascular events in the Framingham Offspring Study. Circulation. 2004;110:380-5
22. Han TS, Sattar N, Williams K. et al. Prospective study of C-reactive protein in relation to the development of diabetes and metabolic syndrome in the Mexico City Diabetes Study. Diabetes Care. 2002;25:2016-21
23. Haffner SM. The metabolic syndrome: inflammation, diabetes mellitus, and cardiovascular disease. Am J Cardiol. 2006;97:3A-11A
24. Lumeng CN, Saltiel AR. Inflammatory links between obesity and metabolic disease. J Clin Invest. 2011;121:2111-7
25. Rentoukas E, Tsarouhas K, Kaplanis I. et al. Connection between telomerase activity in PBMC and markers of inflammation and endothelial dysfunction in patients with metabolic syndrome. PLoS One. 2012;7:e35739
26. Lampon N, Hermida-Cadahia EF, Riveiro A. et al. Association between butyrylcholinesterase activity and low-grade systemic inflammation. Ann Hepatol. 2012;11:356-63
27. Criqui MH, McClelland RL, McDermott MM. et al. The ankle-brachial index and incident cardiovascular events in the MESA (Multi-Ethnic Study of Atherosclerosis). J Am Coll Cardiol. 2010;56:1506-12
28. Ix JH, Katz R, Peralta CA. et al. A high ankle brachial index is associated with greater left ventricular mass MESA (Multi-Ethnic Study of Atherosclerosis). J Am Coll Cardiol. 2010;55:342-9
29. Wang QQ, Zhao X, Pu XP. Proteome analysis of the left ventricle in the vitamin D(3) and nicotine-induced rat vascular calcification model. J Proteomics. 2011;74:480-9
30. Yamada S, Taniguchi M, Tokumoto M. et al. The antioxidant tempol ameliorates arterial medial calcification in uremic rats: important role of oxidative stress in the pathogenesis of vascular calcification in chronic kidney disease. J Bone Miner Res. 2012;27:474-85
31. Shao JS, Cheng SL, Sadhu J. et al. Inflammation and the osteogenic regulation of vascular calcification: a review and perspective. Hypertension. 2010;55:579-92
32. Whaley-Connell A, McCullough PA, Sowers JR. The role of oxidative stress in the metabolic syndrome. Rev Cardiovasc Med. 2011;12:21-9
33. Anderson EJ, Lustig ME, Boyle KE. et al. Mitochondrial H2O2 emission and cellular redox state link excess fat intake to insulin resistance in both rodents and humans. J Clin Invest. 2009;119:573-81
34. Beydoun MA, Canas JA, Beydoun HA. et al. Serum Antioxidant Concentrations and Metabolic Syndrome Are Associated among U.S. Adolescents in Recent National Surveys. J Nutr. 2012Sep;142(9):1693-704
35. Mercer JR, Yu E, Figg N. et al. The mitochondria-targeted antioxidant MitoQ decreases features of the metabolic syndrome in ATM+/-/ApoE-/- mice. Free Radic Biol Med. 2012;52:841-9
36. Hoehn KL, Salmon AB, Hohnen-Behrens C. et al. Insulin resistance is a cellular antioxidant defense mechanism. Proc Natl Acad Sci U S A. 2009;106:17787-92
37. Park S, Kim M, Paik JK. et al. Oxidative stress is associated with C-reactive protein in non-diabetic postmenopausal women, independent of obesity and insulin resistance. Clin Endocrinol (Oxf). 2012
Author contact
![]() Corresponding author: Hui Huang and Jingfeng Wang. 107 West Yanjiang Road, Department of Cardiology, Sun Yat-sen Memorial Hospital of Sun Yat-sen University, Guangzhou, China, 510120. Tel # 0086-20-81332475. Fax # 0086-20-81332623. Email: huangh8sysu.edu.cn or drwjfsumscom.
Corresponding author: Hui Huang and Jingfeng Wang. 107 West Yanjiang Road, Department of Cardiology, Sun Yat-sen Memorial Hospital of Sun Yat-sen University, Guangzhou, China, 510120. Tel # 0086-20-81332475. Fax # 0086-20-81332623. Email: huangh8sysu.edu.cn or drwjfsumscom.