Impact Factor ISSN: 1449-1907

 Global reach, higher impact
Int J Med Sci 2012; 9(10):881-893. doi:10.7150/ijms.5011 This issue Cite
Research Paper
Molecular Mechanism of SAHA on Regulation of Autophagic Cell Death in Tamoxifen-Resistant MCF-7 Breast Cancer Cells
Young Ju Lee1, A Jin Won1, Jaewon Lee1, Jee H. Jung1, Sungpil Yoon2, Byung Mu Lee3, Hyung Sik Kim1 ![]()
1. Laboratory of Molecular Toxicology, College of Pharmacy, Pusan National University, San 30, Jangjeon-dong, Geumjeung-gu, Busan 609-735, Republic of Korea.
2. Research Institute, National Cancer Center, Ilsan-gu, Goyang-si, Gyeonggi-do, Republic of Korea.
3. Division of Toxicology, College of Pharmacy, Sungkyunkwan University, Suwon, Gyeonggi-do, Republic of Korea.
Received 2012-8-10; Accepted 2012-10-30; Published 2012-11-7
Abstract
Objective: Tamoxifen is currently used for the treatment of estrogen receptor-positive breast cancer patients, but acquired resistance to tamoxifen is a critical problem in breast cancer therapy. Suberoylanilide hydroxamic acid (SAHA) is a prototype of the newly developed HDAC inhibitor. The aim of this study is to investigate the anticancer effects of SAHA in tamoxifen-resistant MCF-7 (TAMR/MCF-7) cells.
Methods: Cytotoxicity, apoptosis and autophagic cell death induced by SAHA were studied. A TAMR/MCF-7 cells xenograft model was established to investigate the inhibitory effect of SAHA on tumor growth in vivo.
Results: SAHA inhibited the proliferation of TAMR/MCF-7 cells in a dose-dependent manner. SAHA significantly reduced the expression of HDAC1, 2, 3, 4 and 7 and increased acetylated histone H3 and H4. Although SAHA induced G2/M phase arrest of cell cycle, apoptotic cell death was very low, which is correlated with the slight change in the activation of caspases and PARP cleavage. Interestingly, expression of the autophagic cell death markers, LC3-II and beclin-1, was significantly increased in TAMR/MCF-7 cells treated with SAHA. Autophagic cell death induced by SAHA was confirmed by acridine orange staining and transmission electron microscopy (TEM) in TAMR/MCF-7 cells. In mice bearing the TAMR/MCF-7 cell xenografts, SAHA significantly reduced the tumor growth and weight, without apparent side effects.
Conclusion: These results suggest that SAHA can induce caspase-independent autophagic cell death rather than apoptotic cell death in TAMR/MCF-7 cells. SAHA-mediated autophagic cell death is a promising new strategy to treatment of tamoxifen-resistant human breast cancer.
Keywords: HDAC inhibitor, tamoxifen-resistant, breast cancer, apoptosis, autophagy.
Introduction
Breast cancer is the most frequently diagnosed cancer in woman and one of the leading causes of cancer death in worldwide [1]. Breast cancer cells require estrogen to continue growing and about >70% of infiltrating breast carcinoma are estrogen receptor alpha (ERα) positive, thus offering clinicians the opportunity for hormonal therapies (HTs) in adjuvant and/or metastatic situations [2]. Modulation of estrogen signaling pathways using antiestrogens (tamoxifen and fulvestrant) or aromatase inhibitors (letrozole and anastrozole) is indeed one of the first recommended HTs and is the first treatment choice for ERα-positive breast cancers [3]. Tamoxifen is metabolized into 4-hydroxytamoxifen (4-OHT) that bind to the ER that blocks estrogen signaling. Because of its competitive antagonism, tamoxifen is binding to the ER and hence blocking breast cancer cell growth [4]. Despite the benefits of tamoxifen in breast cancer treatment, many patients with receiving tamoxifen therapy eventually relapse and die from their disease progression. The development of acquired resistance to ER-targeted therapies in about 30-40% of the woman treated with tamoxifen for 5 years [5].
Candidate signaling pathways against acquired resistance to tamoxifen are implicated including various signaling networks that control of cell proliferation or survival [5-7]. A few agents targeting these pathways in tamoxifen-resistant breast cancers are in clinical trials [8, 9]. However, there is no approved targeted therapy to improve outcomes of tamoxifen- resistant breast cancers. Recently, a few studies have demonstrated that autophagy is play an important role in regulating cell death in acquired resistance breast cancer cells [10-12]. Autophagy is a catabolic pathway whereby cytoplasmic proteins and organelles are sequestered in vacuoles and delivered to lysosomes for degradation and recycling [13]. In particular, the induction of autophagy has been observed in malignant cells following treatment with histone deacetylase (HDAC) inhibitors. A number of HDAC inhibitors induced autophagy cell death in various human cancer cell lines [14, 15]. Previous studies indicated that HDAC inhibitors can induce both mitochondria-mediated apoptosis and caspase-independent autophagic cell death [16, 17].
Recently, HDAC inhibitors are promising agents for anticancer therapy by induces cell cycle arrest and apoptosis in various cancer cell lines [18,19]. They can promote hyperacetylation of histone protein or other proteins and thus leads to many changes at the molecular and cellular levels. HDAC inhibitors belong to a heterogeneous class of compounds that includes derivatives of short chain fatty acids, hydroxamic acids, cyclic tetrapeptides, and benzamides. Among the hydroxamic acids, suberoylanilide hydroxamic acid (SAHA) and trichostatin A (TSA) are commonly used as a HDAC inhibitor. SAHA shows strong anti-proliferative effects on various cancer cell lines and is currently in clinical trial for the treatment of solid and hematological tumors [20-22]. However, the mechanism by which SAHA induces autophagy cell death in acquired endocrine-therapy is not clearly understood.
Therefore, the specific goal of this study was to evaluate anticancer effects of SAHA on tamoxifen-resistant breast cancer cells. The anticancer effects of SAHA were therefore investigated on cell viability, cell cycle regulation, and modulation of apoptosis- or autophagy-related molecules. We found that SAHA-induced autophagic cell death will provide a novel strategy for treating tamoxifen-resistant breast cancer.
Materials and methods
Reagents
Suberoylanilide hydroxamic acid (SAHA) was purchased from Cayman Chemical Co. (Ann Arbor, MI, USA). 4-Hydroxytamoxifen (4-OHT) was purchased from Sigma-Aldrich Biotechnology (St. Louis, MO, USA). Culture media and its supplements containing antibiotics, and fetal bovine serum (FBS) were purchased from Gibco Invitrogen Corporation (Carlsbad, CA, USA). The primary antibodies for acetyl-H3, acetyl-H4, Atg5, Atg7, β-actin, beclin-1, caspase 7, caspase 9, Cdc2, cyclin A, cyclin B1, cyclin D1, cyclin E, cytochrome c, HDACs, LC3, and p21 were purchased from Cell Signaling Technology (Beverly, MA, USA); Bax, Bcl-2, Cdk4, Cdk6, Cdk2, histone H1, poly(ADP-ribose) polymerase (PARP), and p27 antibodies were purchased from Santa Cruz Biotechnology (Santa Cruz, CA, USA). The Annexin V-FITC apoptosis detection kit I was purchased from BD Biosciences (San Diego, CA, USA). All other chemicals were purchased from Sigma-Aldrich.
SAHA was dissolved in dimethyl sulfoxide (DMSO) and stored at -20ºC until use. The agents were diluted to appropriate concentrations with culture medium containing 1% FBS. The final concentration of DMSO was less than 0.1% (vol/vol), which was also present in the corresponding controls.
HDAC activity assay
HDAC activity was measured with SensoLyte® 520 fluorimetric HDAC activity assay kit (AnaSpec, Fremont, CA, USA) according to the manufacturer's instructions. TSA was used as a reference compound. Briefly, HDAC enzymes were incubated with vehicle or various concentrations of TSA and SAHA at 37oC for 30 min in the presence of an HDAC fluorimetric substrate. The HDAC assay developer (which produces a fluorophore in reaction mixture) was added, and the fluorescence was measured using VICTOR 3 (Perkin Elmer, Waltham, MA, USA) with excitation at 490 nm and emission at 520 nm. The measured activities were calculated using GraphPad Prism (GraphPad Software, San Diego, CA, USA).
Cell line, cultures, and treatment
The tamoxifen-resistant MCF-7 (TAMR/MCF-7) breast cancer cell line was kindly provided by Prof. Keun Wook Kang (Seoul National University, Seoul, Korea). TAMR/MCF-7 cells were derived from wild type MCF-7 cells by continuous exposure to tamoxifen diluted in 0.1% ethanol. The cells were grown in Dulbecco's Modified Eagle's Medium (Gibco, Rockville, MD, USA) containing 10% heat-inactivated fetal bovine serum (FBS), 1.25 mM HEPES, and 100 U/ml penicillin/streptomycin (Gibco) supplemented with 3 µM tamoxifen. Cells were maintained as monolayers in a humidified atmosphere containing 5% CO2 at 37ºC and culture medium was replaced every 2 days. After 48 h incubation, culture medium was replaced with treatment medium containing the desired concentrations of chemicals.
Cell viability assay
Cell viability was determined using 3-(4,5-dimethylthiazol-2-yl)-2,5-diphenyl- tetrazolium bromide (MTT, 5mg/ml, Sigma). The cultures were initiated in 96-well plates at a density of 2.5 x10³ cells per well. After 48 h incubation, cells were treated with various concentrations of SAHA and 4-OHT and cultured for 48 h. After incubation, 15 µl of MTT reagent was added to each well and incubated for 4 h at 37ºC in the dark. The supernatant was aspirated and formazan crystals were dissolved in 100 µl of DMSO at 37ºC for 15 min with gentle agitation. The absorbance per well was measured at 540 nm using the VERSA Max Microplate Reader (Molecular Devices Corp., CA, USA). Data was analyzed from three independent experiments then normalized to the absorbance of wells containing media only (0%) and untreated cells (100%). IC50 values were calculated from sigmoidal dose response curves with SigmaPlot 10.0 software.
Flow cytometry analysis
The cells were treated with various concentrations of SAHA for 48 h. The cells in suspension or adhered on the walls were harvested separately. The cells (1 x 10⁶) were washed in 1% BSA, fixed in chilled 95% ethanol and stained with cold propidium iodine (PI) staining solution (10 μg/ml PI and 100 μg/ml RNase in PBS) in the dark for 30 min at room temperature. Data acquisition and analysis was carried out using a flow cytometry system (Accuri Cytometers, Inc., MI, USA).
Annexin V/FITC binding assay
The Annexin V-FITC binding assay was performed according to the manufacturer's instructions using the Annexin V-FITC detection kit I (BD Biosciences, San Diego, CA, USA). The cells were treated with SAHA for 48 h. The cells were counted after trypsinization and washed twice with cold PBS. The cell pellet was resuspended in 100 µl of binding buffer at a density of 1 x 10³ cells per ml and incubated with 5 µl of FITC-conjugated Annexin-V and 5 µl of PI for 15 min at room temperature in the dark. Four hundred µl of 1x binding buffer was added to each sample tube, and the samples were immediately analyzed by flow cytometry (Accuri Cytometers, Inc., MI, USA).
Caspase activity assay
The cultures were initiated in 6-well plates at a density of 1 x 10⁵ cells per well. Cells were allowed to attach for 48 h and exposed to SAHA for 48 h. Caspase-8 and caspase-9 activities in the cell lysates were measured using caspase-8/FLICE and caspase-9 colorimetric assay kits (Biovision Inc., CA, USA) as described in the manufacturer's protocol. The kits used in the present study utilized synthetic tetrapeptides labeled with p-nitroanilide (pNA). Briefly, 50 µl (100µg) of cell lysates were incubated with 50 µl of 2X reaction buffer and 2 µl of IETD- pNA for caspase-8 or LEHD- pNA for caspase-9 at 37℃ for 2 h. A reading was then taken from a spectrophotometer at 405 nm with a VERS Amax Microplate Reader (Molecular Devices Corp.), which measures the pNA cleaved from the labeled substrate by activated caspases [9]. Caspase-7 activities in the cell lysate were measured using caspase-7 immunoassay kits (Biovision Inc., CA, USA) as described in the manufacturer's protocol. Briefly, the assay utilizes caspase-7 polyclonal antibody to capture activated caspase-7 from cell lysates. Substrate DEVD-AFC is then added and is cleaved proportionally to the amount of activated caspase-7 in the cell lysate. The cleavage generates free AFC, which is then analyzed fluorometrically (Ex./Em. = 400/505 nm) using a fluorescence plate reader. The assay ensures absolute specific detection of caspase-7. Other known caspases and non-specific proteases are not detected.
Western blot analysis
Cells were treated with SAHA for 48 h. Cells were harvested by trypsinization and washed twice with cold PBS. For total protein isolation, cells were suspended in PRO-PREP™ protein extract solution (iNtRON, Seongnam, Korea). Protein concentrations were measured using protein assay kit (Bio-Rad, Hercules, CA, USA) according to the manufacturer's instructions. The cell extract with 20 µg protein was loaded on 6-15% SDS-polyacrylamide (PAGE) gel. After electrophoresis, gels were transferred to polyvinylidene difluoride (PVDF) membranes (Millipore, Billerica, MA, USA). The membranes were incubated for 1 h in TNA (10 mM Tris-Cl, pH-7.6, 100 mM NaCl, and 0.5% Tween 20) buffer containing 5% skim milk. The membranes were then incubated with various primary antibodies at 4°C for overnight. After washing for 1 h with TNA buffer, the membranes were incubated with horseradish peroxidase-conjugated anti-mouse or anti-rabbit antibodies (1:10000, Santa Cruz, CA, USA) for 30 min at room temperature. The blots were developed using an enhanced chemiluminescence (ECL)-plus kit (Amersham Biosciences, Amersham, Buckinghamshire, UK).
Acridine orange staining and flow cytometry analysis
Acridine orange staining was performed according to a published protocol [23]. Briefly, cells were grown in cover glass bottom dishes at a density of 1 x 10⁵ cells per dish, cultured for 24 h, then incubated with the indicated drug treatment in DMEM containing 1% FBS for 48 h. The media were removed and, the cells were stained with acridine orange (1 µg/ml) at 37ºC for 15 min. After removing staining solution, washed with PBS and immediately analyzed in the flow cytometer and examined under a fluorescence microscopy (Olympus FV10i, Tokyo, Japan) using 490-nm band-pass blue excitation filters and a 515-nm long-pass barrier filter.
MDC incorporation assay
Exponentially growing cells were grown on cover glass bottom dishes, cultured for 48 h, and then incubated with the indicated drug treatment in DMEM containing 1% FBS for 48 h. After washing with cold PBS, the cells were fixed with 3.75% paraformaldehyde in PBS. Autophagic vacuoles were then labeled with dansylcadaverine (MDC), an autofluorescent base capable of accumulating in autophagic vacuoles, by incubating cells with 0.05 mM MDC at room temperature for 30 min. After incubation, cells were visualized under a fluorescence microscope at 600X magnification (Olympus FV10i, Tokyo, Japan).
Transmission electron microscopy
For the sample preparation, cells were fixed in 2.5% glutaraldehyde in PBS (pH 7.4). Samples were further fixed with 1% osmium tetroxide for 1hr, serially dehydrated with ethanol, and embedded in epoxy resin. For transmission electron microscopy (TEM), sections (70 nm) were cut on a Leica Ultra-CUT (Ultra-Microtome, Leica Microsystems GmbH, Wetzlar, Germany) and contrasted with 0.1% lead citrate and 8% uranyl acetate in 50% EtOH. Ultrathin sections were examined with a transmission electron microscope (Tecnai G2 Spirit, FEI Company, USA) operated at 120kV, and the images were captured with a Megaview III CCD camera (Soft Imaging System, Lakewood, CO).
Xenografts study and immunohistochemistry
Six-week-old BALB/c athymic nude mice (Joongang Experimental Animal, Seoul, Korea) were inoculated subcutaneously with 5 x 10⁶ TAMR/MCF-7 cells. When tumors reached about 100 mm3 (about 14 days), the mice were randomly allocated to one of four groups: 1) control, 2) 4-HOT 20 mg/kg, 3) SAHA 25 mg/kg, and 4) SAHA 50 mg/kg. SAHA and 4-OHT were intraperitoneally (i.p.) injected every 2 days for 21 days. Tumor volumes were measured with calipers and their volumes were calculated using a standard formula: width2 x length x 0.52 [24]. Body weights were recorded before dosing. Animal care was maintained in accordance with Pusan National University institutional guidelines. After sacrificing the mice, excised tumors were fixed in 10% buffered formalin and embedded in paraffin. Immunohistochemical staining was done with the avidin-biotin complex method using an anti-proliferating cell nuclear antigen (PCNA) antibody. Immune reactions were visualized with 3,3-diaminobenzidine and counterstained with Mayer's hematoxylin.
Statistical analysis
The data were expressed as the mean ± SEM of at least three independent experiments. Statistical analysis was performed using one-way analysis of variance (ANOVA) followed by Bonferroni's multiple comparison test. *p-value <0.05 was considered statistically significant.
Results
SAHA inhibits HDAC activity and expression of HDACs in TAMR/MCF-7 cells
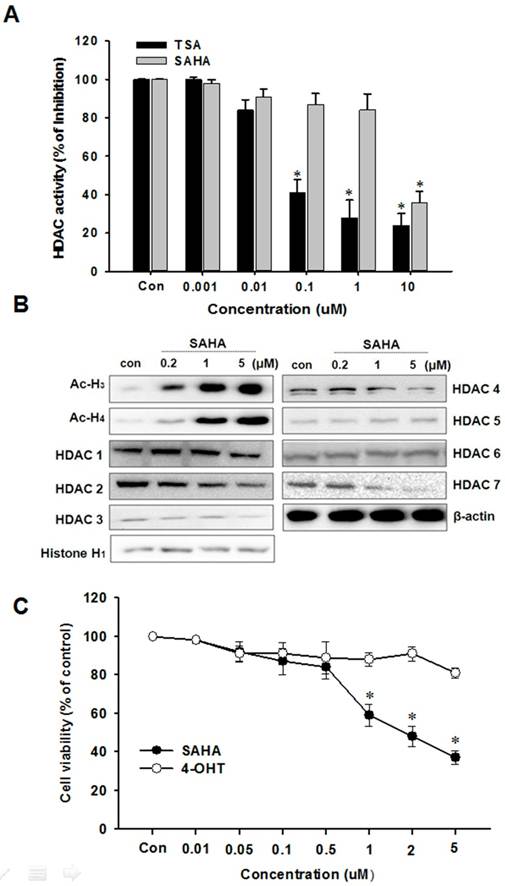
The effect of SAHA on the total HDAC enzyme activity in nuclear protein isolated from HeLa cells was examined. As shown in Fig. 1A, SAHA and TSA significantly inhibited the total HDAC activity in a concentration-dependent manner. The effect of SAHA on HDACs expression was examined in TAMR/MCF-7 cells by Western blotting analysis using specific antibodies against class I and II HDACs. SAHA markedly increased the acetylated H3 and H4 expression at a submicromolar concentration. The expression levels of HDAC1, 2, 3, 4 and 7 proteins markedly decreased by SAHA (5 µM) treatment (Fig. 1B).
Effects of SAHA on HDAC activity and TAMR/MCF-7 cell viability. (A) Effect of HDAC inhibitors, SAHA and TSA on total HDAC enzyme activity using SensoLyte® 520 fluorimetric HDAC activity assay kit. (B) Effects of SAHA on expression of acetylated histone and HDACs. TAMR-MCF-7 cells were treated with various concentrations of SAHA and 4-OHT for 48 h. Protein was isolated and Western blot analysis was performed with antibodies against acetylated H3, H4 HDAC1, 2, 3, 4, 5, 6 and 7. Equal loading and transfer were verified by reproving the membranes for histone H1 and β-actin. (C) Effects of SAHA and 4-OHT on cell viability. TAMR-MCF-7 cells were treated with various concentrations of SAHA and 4-OHT for 48 h and the proliferation was measured by MTT assay. The percentage of viable cells was determined as the ratio of treated cells to untreated controls (basal). Results are expressed as mean ± SEM of triplicate experiments.
SAHA decreases TAMR/MCF-7 cell proliferation
We first investigated whether SAHA affects TAMR/MCF-7 breast cancer cell proliferation following extended treatments by MTT assay. The characteristic of TAMR/MCF-7 cells used in this study was confirmed with treatment of 4-OHT, which is an active metabolite of tamoxifen. SAHA significantly reduced TAMR/MCF-7 cell proliferation in a concentration-dependent manner, and the IC50 value was 2.4 µM after 48 h treatment. However, proliferation of TAMR/MCF-7 cells were not affected by 4-OHT treatment (Fig. 1C).
Effect of SAHA on cell cycle regulation in TAMR/MCF-7 cells
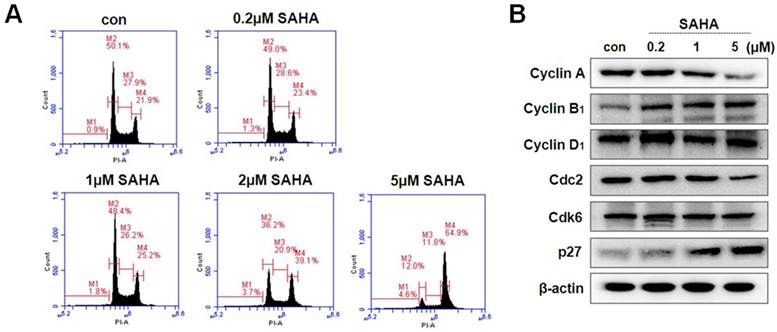
HDAC inhibitors decreases the proliferation of various cancer cells via cell cycle arrest at a specific phase. In this study, we examined the effect of SAHA on the cell cycle progression in TAMR/MCF-7 cells by flow cytometry analysis. The cells were treated with the indicated concentration of SAHA (0.2, 1, or 5 µM) for 48 h. As shown in Fig. 2A, SAHA induced G2/M phase arrest in a concentration-dependent manner. SAHA increased the G2/M phase cell accumulation to 64.9% compared with control (21.9%). To evaluate the effect of SAHA on the expression of cyclins and CDKs involved in cell cycle progression, the levels of cyclins, CDK and CDK inhibitors were examined using Western blotting. SAHA markedly decreased the expression of cyclin A and Cdc2, and increased the expression of cyclin B1. Furthermore, SAHA highly increased p27 expression in a concentration-dependent manner in TAMR/MCF-7 cells (Fig. 2B).
Cell cycle distribution and expression of cell cycle regulator in TAMR/MCF-7 cells with or without drug treatment. (A) TAMR/MCF-7 cells were treated with SAHA at the indicated concentrations for 48 h. Cells stained with propidium iodine (PI) were subjected to flow cytometry analysis to determine the distribution at each phase of the cell cycle. (B) TAMR/MCF-7 cells were treated with SAHA at the indicated concentrations for 48 h. The TAMR/MCF-7 cells were homogenized, and the proteins were isolated. Aliquots of proteins were immunoblotted with specific primary antibodies against Cdc2, Cdk6, p27, cyclin A, cyclin B1, and cyclin D1. Equal loading and transfer were reproved the membranes with β-actin antibody.
SAHA induces apoptotic cell death
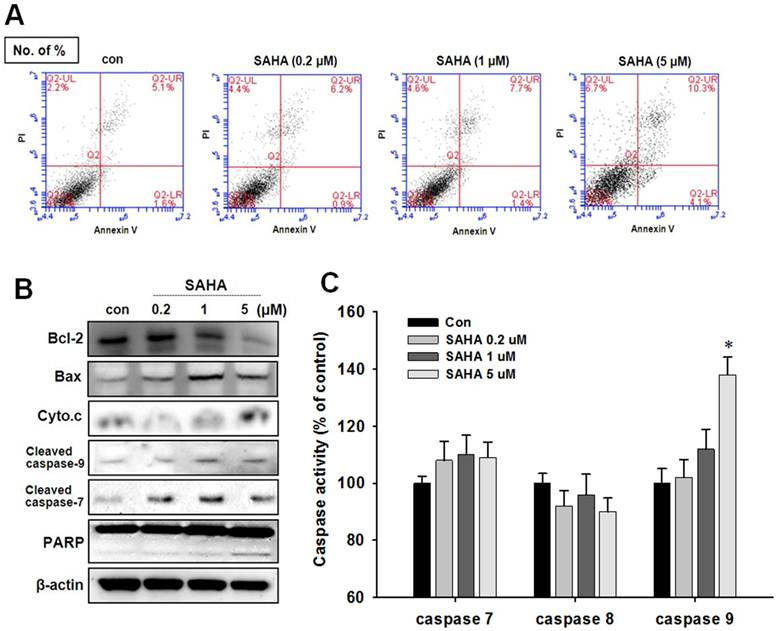
To evaluate apoptotic cell death in TAMR/MCF-7 cells after SAHA treatment, Annexin V-PI staining and Western blot analysis were performed. Despite the pronounced concentration-dependent cells death was observed in the cytotoxicity assay, apoptotic cells death was pronounced only at the high concentration of SAHA (Fig. 3A). A significant increase in Bax expression and a parallel Bcl-2 decrease was observed against SAHA treatment. In addition, a clear increase in cleaved caspase 7, cleaved caspase 9, and PARP cleavage were showed in TAMR/MCF-7 cells treated with 5 µM SAHA (Fig. 3B). The caspase activity was measured using a caspases activity assay kit. The caspase-7 and caspase-9 activity was slightly increased in TAMR/MCF-7 cells at high concentration of SAHA treatment, but no change in caspase-8 activity was observed (Fig. 3C).
Effect of SAHA on apoptotic cell death in TAMR-MCF-7 cells. (A) TAMR/MCF-7 cells were treated with SAHA at the indicated concentrations for 48 h. Early and late apoptosis were detected using Annexin V/PI-double staining analyzed by flow cytometry. (B) Effects of SAHA on the expression of apoptosis-related proteins in TAMR-MCF-7 cells treated with SAHA for 48 h. Differential expression of Bcl-2, Bax, cytochrome c, PARP, cleaved caspase-7, and cleaved caspase-9 were measured by Western blot analysis. Equal loading and transfer were verified by reproving the membranes with β-actin antibody. (C) Effects of SAHA treatment on caspase activities in TAMR/MCF-7 cells. The cells were treated with the indicated concentrations of SAHA for 48 h. The cytosolic extracts of cells were prepared, and caspase activity was determined using the caspase assay kit.
SAHA induces autophagic cell death
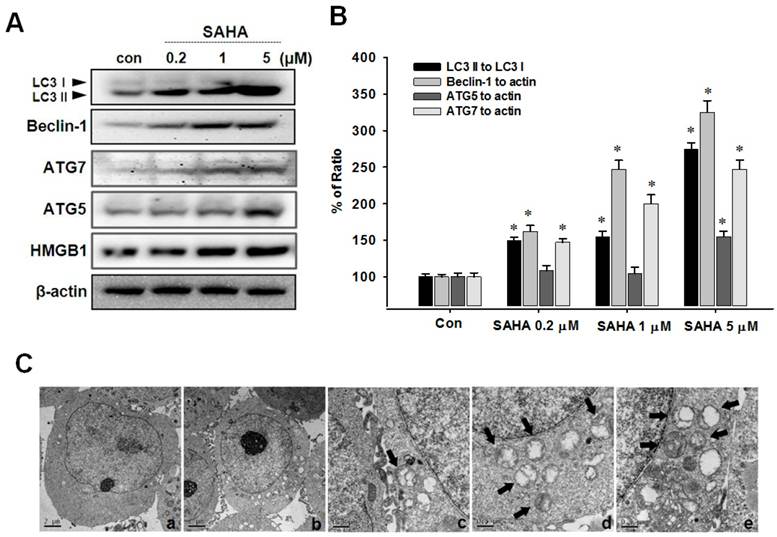
To evaluate autophagic cell death induced by SAHA, Western blot analysis, acridine orange staining and MDC staining were performed. The conversion of the soluble form of LC3-I to the autophagic vesicle-associated form LC3-II is considered a specific marker of autophagosome promotion. As shown in Fig. 4A, SAHA significantly increased the level of phosphatidylethanolamine-conjugated LC3-II, whereas unconjugated LC3-I levels were slightly decreased. Beclin-1, also known as the autophagy-related gene Atg6, is required for the initiation of autophagosome formation. Similar to LC3-II expression, beclin-1 levels were increased by SAHA treatment (Fig. 4B). We measured the image of TAMR/MCF-7 cells after SAHA treatment using transmission electron micrograph (TEM). As shown in Fig. 4C, the typical autophagic features of cells were observed after treatment with SAHA (5 µM) for 48 h, whereas untreated cells had normal nuclear and cytoplasmic morphology. TEM image showed autophagic vacuoles containing organelles and lamellar, vesicular structures. Many small vesicles and large vacuoles (arrows) appeared in the cytoplasm, and these membrane compartments contained multiple cellular organelles. Higher magnification showed most membrane boundaries, with mitochondria and/or other cellular organelles inside (Fig. 4C). These morphological features clearly reflect the classical autophagic characteristics.
Effects of SAHA on the expression of autophagy-related proteins in TAMR/MCF-7 cells. (A) Western blot analysis was performed with beclin-1, LC3, HMGB1, ATG5 and ATG7 antibodies. Equal loading and transfer were verified by reprobing the membranes with β-actin antibody. (B) The ratio of conversion to LC3-II, beclin-1, ATG5 and ATG7 against LC3-I and β-actin by densitometry. (C) Transmission electron micrograph (TEM) images were measured after SAHA treatment in TAMR/MCF-7 cells. (a) control group. (b) SAHA 5 µM-treated samples showing autophagosomes. (c-e) TEM image show autophagic vacuoles containing organelles and lamellar, vesicular structures. Arrows indicate autophagic vesicles and selected regions the micrographs with typical autophagic vesicles.
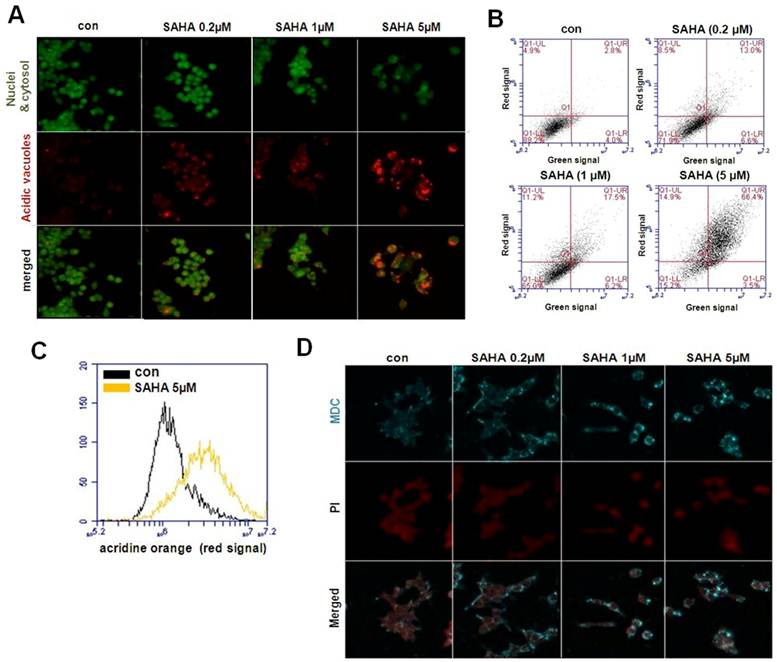
Next, induction of autophagy was confirmed by acridine orange and MDC staining. The vital dyes acridine orange and MDC are commonly used to study autophagy. Acridine orange is a lysotropic dye that accumulates in acidic organelles in a pH-dependent manner. At neutral pH, acridine orange emit a green fluorescent molecule, but emit bright red fluorescence within acidic vesicles by protonated and trapped within the organelle [13]. MDC is another popular autofluorescent marker that preferentially accumulates in autophagic vacuoles. While acridine orange staining in lysosomes is primarily due to ion trapping, MDC accumulation in autophagic vacuoles is due to a combination of ion trapping and specific interactions with vacuole membrane lipids [22, 24]. As is visually evident in Fig. 5A, control cells primarily displayed green fluorescence with minimal red fluorescence, indicating a lack of acidic vesicular organelles. But, drug-treated cells showed a fold-increase in red fluorescent at 48 h post-treatment compared with controls. Flow cytometric analysis after acridine orange staining also revealed an increase in red fluorescence intensity upon drug treatment, indicating an enhancement of acidic vesicular organelles (Fig. 5B). Histogram profiles show the mean fluorescence intensity of control and drug-treated cells (Fig. 5C). Similar results were observed in the MDC staining. As shown in Fig. 5D, there was significant autophagic vesicle formation in TAMR/MCF-7 cells exposed to SAHA. The morphological characteristics demonstrated that SAHA induced autophagic cell death in TAMR/MCF-7 cells.
Visualization of intracellular autophagic vacuoles in TAMR/MCF-7 cells. (A) Immunofluorescence microscopy of acridine orange-stained TAMR/MCF-7 cells treated for 48 h with indicated drug treatment (Using Olympus confocal microscope FV10i. Magnification ×600). (B)Flow cytometric analysis after acridin orange (AO) staining. (C) Histogram profiles of control and drug treatment cells that were read flow cytometrically. (D) MDC staining shows autophagy was activated in TAMR/MCF-7 cells after treatment with SAHA. Cells were examined by Olympus confocal microscope FV10i. Magnification ×600.
Autophagy inhibition accelerates the apoptosis in TAMR/MCF-7 cells
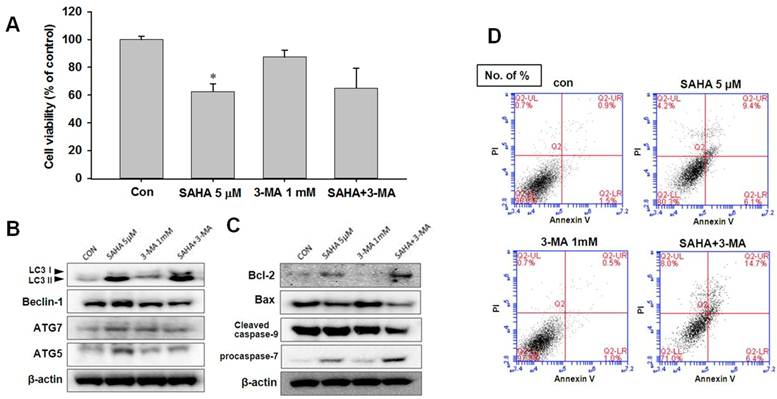
To investigate the role of autophagy in SAHA-induced apoptotic cell death, 3-methyladenine (3-MA, 1 mM), an autophagy-specific inhibitor, was treated to TAMR/MCF-7 cells. 3-MA is commonly used as a specific inhibitor of autophagic sequestration. It blocks autophagy by inhibiting PI3K, an enzyme required for autophagy [25]. As shown in Fig. 6A, 3-MA alone did not affect the profanation of TAMR/MCF-7 cells. To confirm the inhibition of autophagy cell death may be increased the apoptosis, we measured the expression levels of autophagic-related proteins in TAMR/MCF-7 cells after SAHA and 3-MA treatment. The expression levels of LC3-II and beclin-1 were slightly lower in SAHA and 3-MA treatment than that of SAHA treatment (Fig. 6B). These findings suggested that the growth inhibitory effect of SAHA on TAMR/MCF-7 cells might result from apoptosis. In support of this possibility, we examined the expression of cleavage of caspase-9, Bcl-2, and Bax. As shown in Fig. 6, a decrease in Bax and an increase in Bcl-2 levels were observed after combination of SAHA and 3-MA treatment. On this basis, it was found that combination treatment of SAHA and 3-MA markedly enhanced apoptosis in TAMR/MCF-7 cells. To confirm that the apoptosis was affected by 3-MA treatment, the cells were subjected to Annexin V-FITC/PI double staining, followed by flow cytometry analysis to explore the apoptotic cell death. Combination treatment with SAHA and 3-MA increased significantly apoptotic cells death (Fig. 6D).
Effect of 3-MA on SAHA-induced cell death in TAMR/MCF-7 cells. (A) TAMR/MCF-7 cells were treated with SAHA and 3-MA for 48 h and the proliferation was measured by MTT assay. (B-C) Western blot analysis was performed with autophagy and apoptosis related antibodies after treatment. Equal loading and transfer were verified by reprobing the membranes with β-actin antibody. (D) TAMR/MCF-7 cells were treated with SAHA and 3-MA at the indicated concentrations for 48 h. Apoptosis was detected using Annexin V/PI-double staining analyzed by flow cytometry.
SAHA inhibits tumor growth in athymic nude mice bearing TAMR/MCF-7 cells
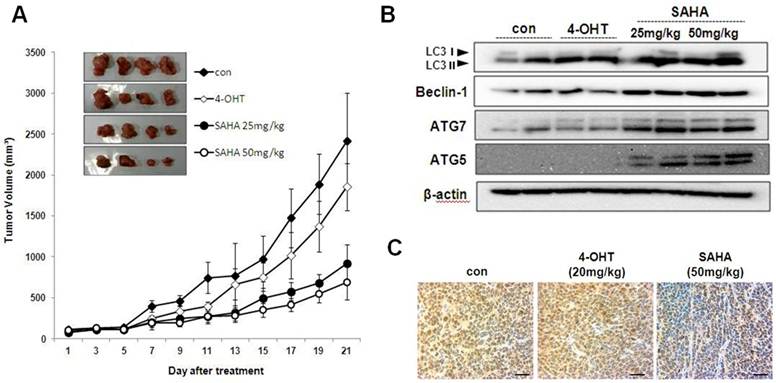
SAHA treatment inhibits tumor growth in athymic nude mice bearing TAMR/MCF-7 cells. To determine the in vivo effect of SAHA, we used athymic nude mice bearing TAMR/MCF-7 cells. Intraperitoneal injections of SAHA (every 2 days for 21 days) significantly reduced tumor growth in comparison to vehicle-treated control mice (Fig. 7A). Body weight was not significantly different between the four groups (data not shown). The effects of SAHA on the level of autophagy-related protein in TAMR/MCF-7 cells xenografts were examined by Western blotting analysis. As shown in Fig. 7B, SAHA markedly increased LC3-II, beclin-1, ATG5 and ATG7 expression. PCNA is a representative marker for cancer cell proliferation. Immunohistochemistry analysis showed that most of the tumor cells in the vehicle-treated controls were PCNA-positive, while the expression intensity of PCNA was reduced in tumor tissues from SAHA-treated mice (Fig. 7C).
Effect of SAHA on the growth of TAMF/MCF-7 cell tumor in nude mice. (A) Mean tumor volumes for each treatment group as a function of day of treatment and tumor burdens of each treatment are indicated. Results represent the mean ± SEM of four animals. * p<0.05 as determined by ANOVA compared to the control group. (B) Expression of autophagy-related proteins in tumor tissues of nude mice treated with SAHA and 4-OHT. LC3, beclin-1, ATG5 and ATG7 antibodies were measured in the homogenates of two representative TAMF/MCF-7 tumors from each treatment group by their respective final volumes. (C) The tumors were fixed in 10% formalin and embedded in paraffin. Immunohistochemical staining for PCNA in tumors from vehicle treated control, SAHA 50 mg/kg and 4-OHT 20 mg/kg. Magnification ×600. Scale bar = 50 μm.
Discussion
Tamoxifen, the most commonly used selective estrogen receptor modulator (SERM), competes with estrogen to ER. Although tamoxifen is effective as an adjuvant and chemopreventive agent, a significant proportion of patients develop breast cancer or relapse breast cancer even after taking tamoxifen, and the emergence of resistance in metastatic breast cancer is usually not preventable [26]. Although the anticancer potential of HDAC inhibitors against drug-resistant cancer cell lines has been reported [27], little is known about the specific mechanism of action on sensitivity of drug-resistance cancer cells death to HDAC inhibitors. Here we investigated the anticancer effects of SAHA on tamoxifen-resistant human breast cancer cells. We found that SAHA markedly increased the hyperacetylation of histone protein and inhibited HDAC enzyme activity. SAHA showed potent cytotoxicity against TAMR/MCF-7 cells, which did not exhibit any cytotoxicity to 4-OHT. Taken together, SAHA significantly induced G2/M phase arrest and then induced autophagic cell death. Interestingly, the expression levels of beclin-1 and LC3-II were increased in TAMR/MCF-7 cells by SAHA treatment.
HDACs are enzymes that regulate histone acetylation on core nucleosomal histones by catalyzing the removal of acetyl groups on their amino-terminal lysine residue. Decreased histones H3 and H4 acetylation compact the chromatin structure resulting disrupt the access of transcriptional factors and repressing the transcription of certain genes [27-29]. To date, the most convincing evidence that HDACs behave differently in cancer cells than in normal cells is derived from the pharmacological manipulation of HDACs through HDAC inhibitors [7, 30, 31]. However, the molecular mechanism of the tumor selective action of HDAC inhibitors is unclear. Recent study indicated that the HDAC inhibitor (vorinostat) induced DNA damage in normal and cancer cells, but cancer cells cannot repair. Thus, the selectivity of HDAC inhibitors in causing cancer cell death may be associated with impaired DNA repair mechanism in cancer cells [32]. Furthermore, previous study demonstrated that role of checkpoint kinase 1 (Chk1) in the mechanisms of resistance to HDAC inhibitors. The selective effect of SAHA in inducing transform but not normal cell death may be the fact that many cancer cells have a defective Chk1 compared to normal cells. This is a factor that might contribute to the evidence that HDACs inhibitor exhibit selective toxicity to cancer cells rather than normal cells [33].
Previously, SAHA has been shown to inhibit tumor growth, arrest cell cycle, and induce differentiation or apoptosis in a variety of transformed cell lines, including breast cancer cell lines [34-37]. In this study, immunocytochemistry analysis revealed increased p21-positive cells in SAHA-resistant cells, suggesting an anti-apoptotic function for p21 as well as protection from the cytotoxic effects of SAHA. Here we have shown that SAHA exert a potent cytotoxicity against TAMR/MCF-7 cells that were resistant to 4-OHT. SAHA markedly increased the acetylated histone H3 or H4 levels and reduced the expression of HDACs, especially HDAC 1, 2, 4, and 7, in TAMR/MCF-7 cells. In addition, previous studies describe SAHA a competitive inhibitor of Class I and Class II HDACs [36, 37]. Most HDAC inhibitors do not selectively inhibit individual HDAC isoenzymes, but rather inhibit several HDACs simultaneously [37]. The target specificity of these HDAC inhibitors remains unclear, but it may be related to the significant over-expression of HDACs observed in cancer cells and the death-inducing capability of different HDAC inhibitors correlates with their HDAC-inhibitory potency. It is widely accepted that the cell death mechanism of HDAC inhibitors is due to their ability to inhibit HDAC activity [38, 39]. HDAC inhibitors induce G1 or G2/M phase arrest of cell cycle, which is mediated by regulation of cell cycle regulators such as cyclins, CDK, p21 and p27 [40, 41]. In this study, cell cycle progression was blocked at G2/M phase in TAMR/MCF-7 cells against SAHA treatment. Knockdown of HDAC1 resulted in arrest either at the G1 phase of the cell cycle or at the G2/M transition, which caused loss of mitotic cells, cell growth inhibition, and an increase in the percentage of apoptotic cells among osteosarcoma and breast cancer cells [42]. Thus, inhibition of HDAC1 might correlate with G2/M phase arrest and apoptosis in TAMR/MCF-7 cells. This result was confirmed in the Annexin V-FITC binding assay, and the late stage of apoptosis signaling in TAMR/MCF-7 cells was increased by SAHA. However, only small changes in PARP cleavage and caspase-7 expression were observed with SAHA. These results indicate that SAHA induced a small amount of apoptosis in the TAMR/MCF-7 cells.
Many recent studies have indicated that HDAC inhibitors induce autophagic cell death in various cancer cells [43-45]. Autophagy also induces cell death that is controlled by processes different from those involved in apoptosis and is therefore described as type II programmed cell death [46]. In this study, we provide evidence that the autophagic process seems to be the main mechanism for cancer cell death caused by SAHA in TAMR/MCF-7 cells. SAHA significantly induced the autophagy cell death by acridine orange and ultrastructural analysis by TEM in TAMR/MCF-7 cells. Furthermore, increases in LC3-II and other autophagy-related molecules were observed after SAHA treatment. These results are consistent with previous data published by Shao et al, [16]. They showed that SAHA induced caspase-independent autophagic cell death in HeLa cells. Actually, whether autophagy promotes cancer cell death or protects cancer cell survival is controversial. To study the role of autophagy in SAHA-induced cytotoxicity, TAMR/MCF-7 cells were pretreated with 3-MA. SAHA-induced cytotoxicity was not potentiated by pretreatment with 3-MA, these results indicating that SAHA independently induced autophagy and apoptosisy. In our study, inhibition of the early stages of autophagy by the specific inhibitor, 3-MA, resulted in decreased autophagic cell death, but accelerated apoptotic cell death, as revealed by Annexin V/PI staining. SAHA simultaneously induced apoptosis in TAMR/MCF-7 cells, which was parallel with autophagy. Inhibition of autophagy suppressed SAHA-induced cytotoxicity. Therefore, combination with autophagic inducers might be potentiated the anti-cancer effects of SAHA on tamoxifen-resistant breast cancer therapy. Further investigation may therefore be necessary to elucidate the relationship of autophagy and apoptosis after SAHA treatment in TAMR/MCF-7 cells. Based on the results from anti-tumor effects of SAHA in vitro, a profound anticancer effect of SAHA was also observed in a TAMR/MCF-7 cell xenograft model. SAHA significantly decreased the tumor volume and decreased the growth of the tumor as assessed by immunohistological detection of the proliferation marker, PCNA.
In summary, we showed that SAHA inhibited the proliferation of TAMR/MCF-7 cells and induced G2/M phase cell cycle arrest and caspase-independent autophagic cell death, as well as apoptotic cell death. Induction of autophagic cell death by SAHA is a new discovery in tamoxifen-resistant human breast cancer.
Acknowledgements
This work was supported by National Research Foundation of Korea (NRF) grants funded by the Korea Government (No. 2010-0023750 and KRF-2010-314-E00292).
Competing Interests
The authors have declared that they have no conflict of interests.
Abbreviations
CDK, cyclin-dependent kinase; DMSO, dimethyl sulfoxide; EBCTCG, Early Breast Cancer Trialists' Collaborative Groups; ECL, enhanced chemiluminescence; FBS, fetal bovine serum; HDAC, histone deacetylase; HRP, horseradish peroxidase; IC50, 50% inhibitory concentration; MTT, 3(4,5-dimethylthiazol-2-yl)2,5-diphenyl-tetrazolium bromide N-acetylcysteine; PARP, poly-ADP ribose polymerase; PBS, phosphate-buffered saline; PCNA, proliferative cell nuclear antigen; PI, propidium iodide; PKA, protein kinase A; PVDF, polyvinylidene difluoride; SAHA, suberoylanilide hydroxamic acid; SDS, sodium dodecylsulfate; SDS-PAGE, sodium dodecylsulfate gel electrophoresis; SFP, specific pathogen free; Tam, tamoxifen; TAMR/MCF-7, Tamoxifen-resistant MCF-7; TEM, transmission electron microscopy; TsA, trichostatin A.
References
1. World Cancer Report 2008. International Agency for Research on Cancer (IARC). http://globocan.iarc.fr/factsheets/populations/factsheet.asp?uno=900
2. McGuire WL, Horwitz KB, Pearson OH. et al. Current status of estrogen and progesterone receptors in breast cancer. Cancer. 1977;39:2934-47
3. Early Breast Cancer Trialists' Collaborative Group (EBCTCG). Effects of chemotherapy and hormonal therapy for early breast cancer on recurrence and 15-year survival: an overview of the randomized trials. Lancet. 2005;365:1687-717
4. The BIG 1-98 Collaborative Group. Letrozole therapy alone or in sequence with tamoxifen in women with breast cancer. N Engl J Med. 2009;361:766-76
5. Ring A, Dowsett M. Mechanisms of tamoxifen resistance. Endocr Relat Cancer. 2004;11:643-58
6. Aguilar H, Solé X, Bonifaci N. et al. Biological reprogramming in acquired resistance to endocrine therapy of breast cancer. Oncogene. 2010;29:6071-83
7. Yue W, Fan P, Wang J. et al. Mechanisms of acquired resistance to endocrine therapy in hormone-dependent breast cancer cells. J Steroid Biochem Mol Biol. 2007;106:102-10
8. Bachelot T, Bourgier C, Cropet C. et al. Randomized phase II trial of everolimus in combination with tamoxifen in patients with hormone receptor-positive, human epidermal growth factor receptor 2-negative metastatic breast cancer with prior exposure to aromatase inhibitors: A GINECO Study. J Clin Oncol. 2012;30:2718-24
9. Munster PN, Thurn KT, Thomas S. et al. A phase II study of the histone deacetylase inhibitor vorinostat combined with tamoxifen for the treatment of patients with hormone therapy-resistant breast cancer. Br J Cancer. 2011;104:1828-35
10. Esteve JM, Knecht E. Mechanisms of autophagy and apoptosis: Recent developments in breast cancer cells. World J Biol Chem. 2011;26:232-8
11. Cook KL, Shajahan AN, Clarke R. Autophagy and endocrine resistance in breast cancer. Expert Rev Anticancer Ther. 2011;11:1283-94
12. Notte A, Leclere L, Michiels C. Autophagy as a mediator of chemotherapy-induced cell death in cancer. Biochem Pharmacol. 2011;82:427-34
13. Glick D, Barth S, Macleod KF. Autophagy: cellular and molecular mechanisms. J Pathol. 2010;221:3-12
14. Park JH, Ahn MY, Kim TH. et al. A new synthetic HDAC inhibitor, MHY218, induces apoptosis or autophagy-related cell death in tamoxifen-resistant MCF-7 breast cancer cells. Invest New Drugs. 2012;30:1887-98
15. Ahn MY, Ahn SG, Yoon JH. Apicidin, a histone deaceylase inhibitor, induces both apoptosis and autophagy in human oral squamous carcinoma cells. Oral Oncol. 2011;47:1032-38
16. Shao Y, Gao Z, Marks PA. et al. Apoptotic and autophagic cell death induced by histone deacetylase inhibitors. Proc Natl Acad Sci USA. 2004;101:18030-35
17. Carew JS, Nawrocki ST, Kahue CN. et al. Targeting autophagy augments the anticancer activity of the histone deacetylase inhibitor SAHA to overcome Bcr-Abl-mediated drug resistance. Blood. 2007;110:313-22
18. Chavan AV, Somani RR. HDAC inhibitors: new generation of target specific treatment. Mini Rev Med Chem. 2010;10:1263-76
19. Marks PA, Xu WS. Histone deacetylase inhibitors: Potential in cancer therapy. J Cell Biochem. 2009;107:600-8
20. Marks PA, Richon VM, Breslow R. et al. Histone deacetylase inhibitors as new cancer drugs. Curr Opin Oncol. 2001;13:477-83
21. Schaefer EW, Loaiza-Bonilla A, Juckett M. et al. Phase II Consortium. A phase 2 study of vorinostat in acute myeloid leukemia. Haematologica. 2009;94:1375-82
22. Mutze K, Langer R, Becker K. et al. Histone deacetylase (HDAC) 1 and 2 expression and chemotherapy in gastric cancer. Ann Surg Oncol. 2010;17:3336-43
23. Paglin S, Hollister T, Delohery T. et al. A novel response of cancer cells to radiation involves autophagy and formation of acidic vesicles. Cancer Res. 2001;61:439-44
24. Phuong NT, Kim SK, Lim SC. et al. Role of PTEN promoter methylation in tamoxifen-resistant breast cancer cells. Breast Cancer Res Treat. 2011;130:73-83
25. De Duve C, de Barsy T, Poole B. et al. Commentary. Lysosomotropic agents. Biochem Pharmacol. 1974;23:2495-531
26. Muss HB. Endocrine therapy for advanced breast cancer: a review. Breast Cancer Res Treat. 1992;21:15-26
27. Castro-Galache MD, Ferraqut JA, Barbera VM. et al. Susceptibility of multidrug resistance tumor cells to apoptosis induction by histone deacetylase inhibitors. Int J Cancer. 2003;104:579-86
28. Egger G, Liang G, Aparicio A. et al. Epigenetics in human disease and prospects for epigenetic therapy. Nature. 2004;429:457-63
29. Feinberg AP, Tycko B. The history of cancer epigenetics. Nat Rev Cancer. 2004;4:143-53
30. Lund AH, van Lohuizen M. Epigenetics and cancer. Genes Dev. 2004;18:2315-35
31. Mai A, Massa S, Rotili D. et al. Histone deacetylation in epigenetics: an attractive target for anticancer therapy. Med Res Rev. 2005;25:261-309
32. Lee JH, Choy ML, Ngo L. et al. Histone deacetylase inhibitor induces DNA damage, which normal but not transformed cells can repair. Proc Natl Acad Sci US A. 2010;107:14639-44
33. Lee JH, Choy ML, Ngo L. et al. Role of checkpoint kinase 1 (Chk1) in the mechanisms of resistance to histone deacetylase inhibitors. Proc Natl Acad Sci USA. 2011;108:19629-34
34. Miller TA, Witter DJ, Belvedere S. Histone deacetylase inhibitors. J Med Chem. 2003;46:5097-116
35. Hrzenjak A, Kremser M-L, Strohmeier B. et al. SAHA induces caspase-independent, autophagic cell death of endometrial stromal sarcoma cells by influencing the mTOR path-way. J Pathol. 2008;216:495-504
36. Dietrich CS, Greenberg VL, Desimone CP. et al. Suberoylanilide hydroxamic acid (SAHA) protentiates paclitaxel-induced apoptosis in ovarian cancer cell lines. Gynecol Oncol. 2010;116:126-30
37. Long J, Zhao J, Yan Z. et al. Antitumor effects of a novel sulfur-containing hydroxamate histone deacetylase inhibitor H40. Int J Cancer. 2009;124:1235-44
38. Ahn MY, Lee J, Na YJ. et al. Mechanism of apicidin-induced cell cycle arrest and apoptosis in Ishikawa human endometrial cancer cells. Chem Biol Interact. 2009;179:169-77
39. Marks PA, Richon VM, Miller T. et al. Histone deacetylase inhibitors. Adv Cancer Res. 2004;91:137-68
40. Kim DH, Kim M, Kwon HJ. Histone deacetylase in carcinogenesis and its inhibitors as anti-cancer agents. J Biochem Mol Biol. 2003;36:110-19
41. Kim JS, Lee S, Lee T. et al. Transcriptional activation of p21(WAF1/CIP1) by apicidin, a novel histone deacetylase inhibitor. Biochem Biophys Res Commun. 2001;281:866-71
42. Minucci S, Pelicci PG. Histone deacetylase inhibitors and the promise of epigenetic (and more) treatments for cancer. Nat Rev Cancer. 2006;6:38-51
43. Carew JS, Nawrocki ST, Kahue CN. et al. Targeting autophagy augments the anticancer activity of the histone deacetylase inhibitor SAHA to overcome Bcr-Abl-mediated drug resistance. Blood. 2007;110:313-22
44. Oh M, Choi IK, Kwon HJ. Inhibition of histone deacetylase1 induces autophagy. Biochem Biophys Res Commun. 2008;369:1179-83
45. Yamamoto S, Tanaka K, Sakimura R. et al. Suberoylanilide hydroxamic acid (SAHA) induces apoptosis or autophagy-associated cell death in chondrosarcoma cell lines. Anticancer Res. 2008;28:1585-91
46. Levine B, Kroemer G. Autophagy in the pathogenesis of disease. Cell. 2008;132:27-42
Author contact
![]() Corresponding author: College of Pharmacy, Pusan National University, San 30, Jangjeon- dong, Geumjeong-gu, Busan 609-735, South Korea. Tel: (82) 51-510 2816, Fax: (82) 51-582 2816. E-mail: hkimsac.kr.
Corresponding author: College of Pharmacy, Pusan National University, San 30, Jangjeon- dong, Geumjeong-gu, Busan 609-735, South Korea. Tel: (82) 51-510 2816, Fax: (82) 51-582 2816. E-mail: hkimsac.kr.