Impact Factor ISSN: 1449-1907

 Global reach, higher impact
Int J Med Sci 2012; 9(9):808-815. doi:10.7150/ijms.4910 This issue Cite
Research Paper
How the Duration Period of Erythropoietin Treatment Influences the Oxidative Status of Hemodialysis Patients
Zorica M. Dimitrijevic1 ![]() , Tatjana P. Cvetkovic1,2, Vidojko M. Djordjevic1, Dusica D. Pavlovic2, Nikola Z. Stefanovic3, Ivana R. Stojanovic2, Goran J. Paunovic1, Radmila M. Velickovic-Radovanovic1
, Tatjana P. Cvetkovic1,2, Vidojko M. Djordjevic1, Dusica D. Pavlovic2, Nikola Z. Stefanovic3, Ivana R. Stojanovic2, Goran J. Paunovic1, Radmila M. Velickovic-Radovanovic1
1. Clinic of Nephrology and Hemodialysis, Clinical Center, Nis;
2. Institute of Biochemistry, Medical faculty, University of Nis;
3. Medical faculty, University of Nis.
Received 2012-7-21; Accepted 2012-10-15; Published 2012-10-26
Abstract
Background: End-stage renal disease is a state of enhanced oxidative stress (OS) and hemodialysis (HD) and renal anemia further augment this disbalance. Anemia correction with erythropoietin (EPO) may improve oxidative status. However, there is no evidence of time dependent effects of EPO therapy on redox status of HD patients.
Objective: The aim of this study was to evaluate whether the duration of EPO treatment may affect OS parameters in uremic patients.
Patients and methods: 104 HD patients and 29 healthy volunteers were included. Patients were divided into 3 groups according to the duration of EPO treatment. Forth group consisted of HD patients without EPO treatment. Plasma and erythrocyte malondialdehyde (MDA, MDArbc), reactive carbonyl groups (RCG), plasma sulfhydryl (-SH) groups and total antioxidative capacity (TAC) levels were evaluated.
Results: HD patients both with and without EPO treatment, showed a significant increase in all oxidative parameters without significance between EPO treated and -untreated group. The decrease in MDA and MDArbc levels coincided with the duration of EPO treatment. A negative correlation was observed between the duration of EPO treatment and serum MDA (r=˗0.309, p=0.003). Increasing periods of EPO treatment were associated with decrease in RCG, without significance between EPO groups. Increase in TAC accompanied increasing durations of EPO treatment, with EPO treatment for more than 24 months causing the most striking changes (p<0.05). There were no significant differences in ˗SH levels between EPO subgroups.
Conclusion: Our results suggest that long term administration of EPO attenuated the lipid peroxidation process and restored the levels of antioxidants.
Keywords: oxidative stress, hemodialysis, erythropoietin, malondialdehyde, total antioxidative capacity.
INTRODUCTION
It is established that end-stage renal disease (ESRD) is a state of oxidative stress (OS), caused by the increased production and reduced clearance of oxidants (1-3). As a consequence of diminished renal catabolism and function, uremic oxidant mediators accumulate. These have potentially devastating effects on the vasculature and have been advocated in the pathogenesis of accelerated atherosclerosis in ESRD patients. To compound this, chronic hemodialysis (HD) treatment further enhances oxidative stress through the activation of phagocytic oxidative metabolism by the dialysis membrane, the release of oxygen radicals during dialysis, direct peroxidation of lipids on dialysis membranes, and exhaustion of antioxidant systems (4).
Renal anemia, where patients have a low red blood cell count caused by a lack of erythropoietin (EPO), a key protein in red blood cell production, is a common complication of ESRD, leading to a higher morbidity and mortality rate in patients on hemodialysis. In addition, renal anemia itself can augment oxidative stress by increasing tissue reactive oxygen species (ROS) generation during anaerobic metabolism, and reducing antioxidant defense because of the diminished erythrocyte pool (5, 6).
Regular supplements of intravenous iron and EPO are standard therapies in the treatment of anemia in patients on chronic HD. However, EPO administration might affect ROS production through the sustained output of new young erythroid cells. Red blood cells are in themselves a circulating antioxidant system due to their reduced glutathione content and antioxidant enzymes (5,7) which suggest that EPO may have potential antioxidative effects. Hence, the correction of anemia in uremic patients, besides its primary beneficial effects, represents an effective approach to reduce oxidative stress and consequently, potential cardiovascular risk.
Several clinical reports have shown that EPO could protect from oxidative stress in dialysis patients (8,9,10,11). No study to date, however, has investigated the time-dependent effects of EPO therapy on oxidative stress parameters of HD patients. In this study, we evaluate whether the duration of EPO treatment affects lipid peroxidation and protein oxidation in uremic patients.
PATIENTS AND METHODS
The study protocol was approved by a local ethics committee and all patients provided signed informed consent. 104 HD patients were included in this cross sectional study along with 29 age-matched individuals recruited from a panel of healthy volunteers. The enrolment criteria were: patients aged >18 years who were at least six months on hemodialysis treatment, with an otherwise stable clinical condition and normally functioning arteriovenous fistula, withou any evidence of any systemic disease, diabetes mellitus, malignancy, active infection or hepatitis of any form. Patients with erythropoietin-resistant anemia and those who had used any antioxidants within the previous 3 months were excluded. All HD patients were receiving bicarbonate dialysis using a polysulphone dialyzer with an average blood flow of 300 to 350 mL/min with a Kt/V value, calculated according to Daugirdas formula, during each treatment maintained at >1.3.
Of the 104 HD patients, 89 had been receiving subcutaneous recombinant human erythropoietin (rHuEPO) and intravenous iron replacement therapy, with the rHuEPO dose titrated to achieve a hemoglobin value of 11-12 g/dl and the iron dose adjusted to reach ferritin and transferring saturation levels of 300-400 ng/ml and 30-40%, respectively. 100 mg of iron sucrose was administered in a dilution with 100 ml saline as 30 minute intravenous infusion at the end of HD session. 40 patients were on antihypertensive treatment with a single agent and 43 were receiving a combination of angiotensin-converting enzyme inhibitors (ACEIs), calcium channel blockers and beta blockers. 86 patients were receiving calcium and/or vitamin D by orally or intravenously.
Hemodialysis patients were subgrouped in the following way: Group I (without EPO treatment, n = 15), Group IIa (<6 months of EPO treatment, n = 22), Group IIb (6-24 months of EPO treatment, n = 32), Group IIc (>24 months of EPO treatment, n = 38). Healthy volunteers comprised the control group (n=29).
Blood samples were taken after the longest interval between the two HD sessions after an overnight fast. Venous blood samples were obtained from each patient's forearm using a disposable plastic syringe and transferred to plastic tubes with anticoagulant ethylenediaminetetraacetate (EDTA). The EDTA anticoagulant samples were separated from blood cells by centrifugation (3200 rpm for 15 min at 4◦C). Plasma was carefully removed and erythrocytes were washed three times with 0.9% sodium chloride (NaCl) solution. The packed erythrocytes (0.4 ml) were suspended in 1.6 ml phosphate buffer saline pH 7.4 (to obtain 20 % suspension of erythrocytes). Received plasma and erythrocytes were immediately processed for the analyses described below. Biochemical and whole blood analyses were performed using hospital auto-analyzers (Biosystems A25, BioSystems, Barcelona, Spain and Cell Counter, MEK-4100, Nihon Kohden, Japan, respectively).
Estimation of plasma MDA products
The MDA concentration was measured according to Andreeva et al. (12) by the thiobarbituric acid reaction. In this test, 1 molecule of MDA reacts with 2 molecules of thiobarbituric acid with the production of a pink pigment having an absorption maximum at 532-535 nm.
Estimation of erythrocyte MDA products
The MDA content of erythrocytes was estimated by the production of thiobarbituric acid reacting substances by the spectrophotometric method (at 532 nm) as described by Jain et al. (13). The results were expressed as nmol MDA/ml Er.
Determination of carbonyl groups concentration of oxidatively modified proteins in plasma
Carbonyl content in oxidatively modified proteins was determined by a modified method described in Levine at al. (14) based on the reaction of carbonyl groups with 2,4 dinitrophenylhydrazine to form a 2,4-dinitrophenylhydrazone reactive carbonyl derivate. The concentration is expressed as μmol/g proteins.
Determination of plasma SH groups
The concentration of total SH groups in serum was determined by using 5-5'-dithiobis (2-nitrobenzoic acid) (DTNB) (15). Absorbance was measured at 412 nm against blank samples without DTNB and expressed as mol/l.
Determination of total antioxidative capacity (TAC)
TAC estimation is measured by the formation of hydroxyl radicals (.OH), a reactive oxygen species that degrades benzoate, resulting in the TBARS formation. Antioxidants present in the added serum causes suppression of the TBARS. The serum's capacity to suppress this TBARS formation was designated as the total antioxidant capacity of the serum. The fall in the absorbance was read spectrophotometrically at 535 nm. TAC was expressed as total antioxidant activity in mmol/l (16).
Statistical Analyses
All statistical analyses were performed using the statistical package for social sciences (SPSS) software version 15.0. (SPSS Chicago, IL, USA). Comparisons of patient groups were performed by using one-way analysis of variance (ANOVA). All post hoc multiple comparisons were performed using the Scheffe test. Correlation analyses were performed using a Pearson correlation test. Results are expressed as mean ± standard deviation (SD). A value for p less than 0.05 was considered statistically significant.
RESULTS
The demographic, biochemical and clinical characteristics of control individuals and HD patients both with and without EPO treatment are presented in Table 1. The HD patient group comprises 60 males and 44 females with a mean overall age of 57.2 ± 16.4 years and HD duration of 55.1 ± 41.7 months. Etiologies for ESRD were glomerulonephritis in 32 patients, hypertensive nephropathy in 17 patients, polycystic kidney disease in 15 patients, chronic pyelonephritis in 11 patients, nephrolithiasis in eight patients, Balkan endemic nephropathy in three patients and unknown in 18 patients. The values of the most analyzed parameters were similar in both HD groups, irrespective of erythropoietin treatment.
Demographic and clinical characteristics of HD patients untreated [HD-EPO(-)] and treated [HD-EPO(+)] with erythropoietin and healthy controls.
| Parameter | Group I [HD-EPO(-)] n=15 | Group II [HD-EPO(+)] n=89 | Control group n=29 |
|---|---|---|---|
| Gender (m/f) | 8/7 | 52/37 | 15/14 |
| Age, years | 55.6±18.2 | 59.5±11.6 | 55±15.8 |
| Duration of HD (months) | 52.5±61.6 | 64.3±50.8 | - |
| kT/V | 1.36±0.3 | 1.34±0.8 | - |
| Cholesterol (mmol/l) | 5.0±1.16 | 4.9±1.04 | 5.8±0.7 |
| Triglycerides (mmol/l) | 2.9±1.9 | 2.8±1.2 | 1.8±0.6b |
| LDL-cholesterol (mmol/l) | 2.9±0.7 | 2.6±0.89 | 3.7±0.4 |
| HDL-cholesterol (mmol/l) | 1.6±0.8 | 2.0±0.3 | 1.7±0.5 |
| Hemoglobin (g/L) | 99.0±12.1 | 108.3±9.6a | 136.2±8.1b |
| Iron (μmol/L) | 17.5±12.6 | 16.7±9.3 | 15.1± 4.4 |
| Transferin saturation (%) | 26.0±9.5 | 30.1±15.8 | 26.9±5.1 |
| Ferritin (ng/mL) | 341±189.8 | 343.5±299.2 | 94.9±38.5b |
| PTH(pg / ml) | 319.6±356.6 | 342.6±322.6 | 47.3±22.6b |
| Serum proteins (g/L) | 68.2±9.4 | 70.1±7.6 | 72.3±4.7 |
| Albumins (g/L) | 36.1±2.8 | 33.53±5.5 | 38.8±3.3b |
| CRP (mg/l) | 5.4±2.9c | 4.2±2.7 | 2.9±1.8 |
| Uric acid (mmol/l) | 370.6±105.8 | 362.1±88.0 | 286.1±56.8b |
| MDA (mmol/L) | 11,3±1,2 | 11,1±3,5 | 6,0±1,1b |
| MDArbc (nmol/ml Er) | 14,7±2,2 | 15,8±3,3 | 8,7±1,3b |
| RCG (µmol/gr protein) | 4,5±0,6 | 4,1±0,8 | 2,63±0,2b |
| TAC (µmol/L) | 2,5±0,3 | 2,6±0,2 | 3,6±0,5b |
| -SH groups(µmol/L) | 284,4±44,5 | 278,6±34,2 | 449,2±66,6b |
| SBP (mmHg) | 138.0±9.50 | 151.0±11.50a,d | 128±8.40 |
| DBP (mmHg) | 73.0±12.1 | 84.2±13.1a | 72.5±11.0 |
| Cardiovascular disease % | 56.0 | 63.0 | - |
| ACE inhibitors | 36.5 | 54.3 | - |
| Calcium channel antagonist | 37.7 | 42.6 | - |
| β blockers | 46.6 | 58.9 | - |
One way ANOVA and Scheffé tests. Results are mean ±standard deviatio. a p <0.05 Group II vs. Group I; bp <0.001 CG vs. Group I and Group II; c p <0.05 Group I vs. CG; d p<0.01 Group II vs. CG. Legend: HD-hemodialysis, PTH-parat hormone, CRP- C-reactive protein, MDA-plasma malondialdehyde, MDArbc-erythrocyte malondialdehyde, RCG-reactive carbonyl groups, TAC-total antioxidative capacity, SBP-sistolic blood pressure, DBP-diastolic blood pressure, ACE inhibitor-angiotenzin I converting enzyme, (-) Data not available.
All HD patients showed lower hemoglobin and albumin levels (p<0.001) as well as higher uric acid and triglycerides levels (p<0.001) compared to healthy controls. Higher C-reactive protein (CRP) levels were observed in HD patients without EPO treatment [HD-EPO(-)] compared to healthy controls (p<0.05). When comparing the HD patients with EPO treatment [HD-EPO(+)] and the HD-EPO(-) groups, patients treated with erythropoietin had higher haemoglobin (Hgb) levels than EPO-untreated patients (p<0.001). In addition, we found that there were statistically significant difference in systolic and diastolic blood pressure (151.0±11.50 vs. 138.0±9.50mmHg and 84.2±13.1 vs. 73.0±12.1mmHg, respectively).
In assessing oxidative stress parameters, it is apparent that patients on hemodialysis, both with and without erythropoietin treatment, showed a significant increase in concentrations of both plasma and erythrocytes malondialdehyde and reactive carbonyl groups compared with the control individuals (p<0.001, for all). In addition, plasma levels of the -SH groups and the total antioxidative capacity were significantly lower in both HD groups. The differences in oxidative status parameters between HD patients with and without EPO treatment were not statistically significant.
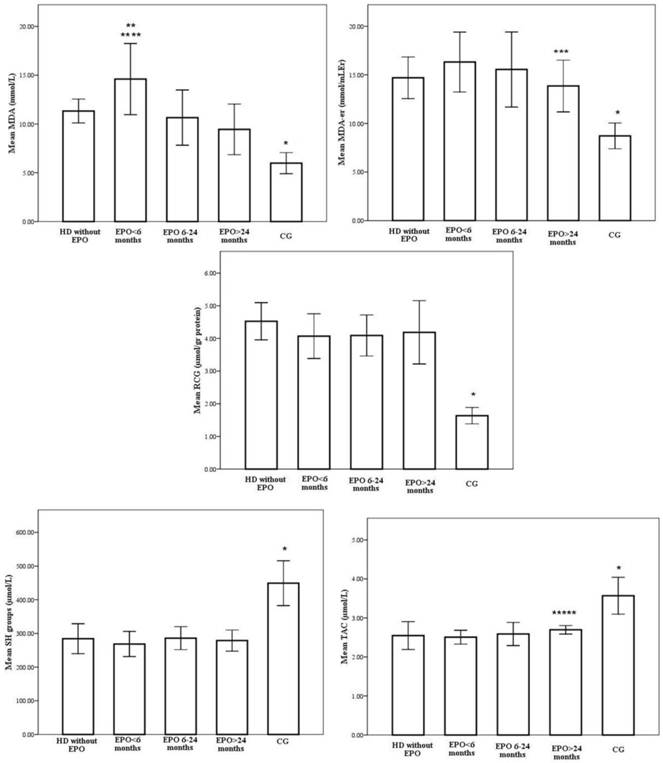
However, when patients were divided into subgroups depending on the duration of EPO treatment, we obtained heterogeneous results. Redox status of the patients with various EPO treatment lengths is shown on Figure 1.
Redox status of the patients treated with various EPO treatment lengths. * p<0,001 CG vs. EPO>24months, EPO 6-24months, EPO<6months, without EPO; ** p<0,001 EPO<6months vs. EPO>24months, EPO 6-24months; *** p<0,001 EPO>24months vs. EPO<6months; **** p<0,05 EPO<6months vs. without EPO; ***** p<0,05 EPO>24months vs. EPO<6months.
According to one-way ANOVA, there were no significant differences between group IIa, IIb and IIc in Hgb levels, EPO requirements, iron indices, albumins, uric acid, CRP and LDL levels (Table 2). Post hoc Scheffé tests demonstrated significant group differences in HDL levels. Group IIc was found to have higher HDL levels compared to Group I, Group IIa and IIb (2.24±0.3 vs. 1.2±0.8, 1.29±0.1 and 1.96±0.2mmol/l, p<0.001).
Demographic and clinical characteristics of patients with various EPO treatment lengths.
| Parameters | Group IIa EPO <6 months n=22 | Group IIb EPO 6-24 months n=29 | Group IIc EPO >24months n=38 | p* |
|---|---|---|---|---|
| Gender(m/f) | 13/9 | 17/13 | 21/17 | NS |
| Age, years | 57.2±16.0 | 64.8±10.9 | 59.5±11.6 | NS |
| Duration of HD (months) | 31.4±31.1 | 54.2±44.7 | 91.2±51.1 | <0.001 |
| kT/V | 1.29±0.9 | 1.28±1.0 | 1.30±0.2 | NS |
| Cholesterol (mmol/l) | 4.6±1.2 | 4.5±1.0 | 4.3±1.0 | NS |
| Triglycerides (mmol/l) | 2.9±1.8 | 2.7±1.0 | 2.6±1.4 | NS |
| LDL-C(mmol/l) | 2.6±1.0 | 2.6±0.9 | 2.7±0.8 | NS |
| HDL-C(mmol/l) | 1.29±0.1 | 1.96±0.2 | 2.24±0.3 | <0.001 |
| Hemoglobin (g/L) | 105.6±7.3 | 109.3±11.4 | 109.2±9.3 | NS |
| rHuEPO dose(IU/kg/week) | 81.1±46.6 | 76.4±35.3 | 98.5±53.4 | NS |
| Iron (μmol/L) | 21.3±10.6 | 21.4±8.5 | 20.0±9.4 | NS |
| Transferin saturation (%) | 36.0±16.8 | 36.1±14.9 | 36.2±16.3 | NS |
| Ferritin (ng/mL) | 442.6±282.0 | 469.1±371.8 | 450.8±314.3 | NS |
| PTH (pg /ml) | 339.2±207.2 | 318.6±233.4 | 363.0±225.5 | NS |
| Serum proteins (g/L) | 69.2±7.8 | 69.8±7.4 | 71.1±7.8 | NS |
| Albumin (g/L) | 32.2±2.45 | 32.60±2.63 | 32.65±2.68 | NS |
| CRP (mg/l) | 3.9±2.7 | 3.7±2.7 | 3.6±2.9 | NS |
| Uric acid (mmol/l) | 369.8±122.3 | 344.6±63.1 | 370.9±81.0 | NS |
*ANOVA test. Legend: HD-hemodialysis, rHuEPO-human recombinant erythropoietin, PTH-parat hormone, CRP- C-reactive protein, NS-non significant.
Similarly, the highest intensity of oxidative stress, as measured by plasma MDA levels, were observed in patients on EPO treatment for less than six months (14.6±3.6 mmol/L), which is statistically higher compared to the group without EPO treatment (11.3±1.2mmol/L, p=0.006) (Figure 1). The decrease in plasma MDA levels coincided with the duration of EPO treatment and the lowest values were in the patient group with the longest duration of EPO treatment (9.4±2.6mmol/L, p<0,001). A negative correlation was observed between the duration of EPO treatment and serum MDA (r=-0.309, p=0.003).
In addition, the erythrocyte MDA level was lowest in patients treated with EPO for more than 24 months (13.9±2.7mmol/L) and it was statistically significant compared to the group treated with EPO for less than 6 months (16.3±3.1mmol/L p<0.001) (Figure 1). Again, a negative correlation was observed between the duration of EPO treatment and red blood cells MDA (r=-0.550, p<0.001).
With respect to serum carbonyls, marker of oxidative protein modifications, levels were 4.5±0.6, 4.2±0.7, 4.1±0.6 and 4.0±1.0 µmol/gr proteins, respectively for Group I, Group IIa, Group IIb and Group IIc, whereas the level for the control group was 2.63±0.25 µmol/gr proteins (Figure 1). Increased periods of EPO treatment were associated with a stepwise decrease in RCG, but the differences between patient subgroups did not reach statistical significance.
Antioxidant status was evaluated measuring total antioxidative activity and free sulphydryl groups. TAC activity was influenced by duration of EPO treatment. Step wise increases in total antioxidative capacity were noted to accompany increasing durations of EPO treatment, where EPO treatment exceeding 24 months caused the most striking changes (2,5±0,2 vs. 2,7±0,1µmol/L, p<0,05 for Group IIa vs. Group IIc months, respectively) (Figure 1). A statistically relevant positive correlation was observed between the duration of EPO treatment and TAC levels (r=0.359, p=0.001).
Similarly, the -SH group concentrations in HD patients from both groups, EPO(+) and EPO(-), were significantly lower than in healthy subjects. However, there were no significant differences in -SH levels between patient subgroups (Figure 1).
When all HD patients were analyzed, both plasma and erythrocyte MDA as well as reactive carbonyl groups were negatively correlated to hemoglobin level (r=-0.428, p<0.001; r=-0.326, p<0.001, r=-0,561, p<0.001, respectively) and TAC level (r=-0.434, p<0.001; r=-0.309, p<0.001). Strong direct correlations were observed between the TAC and hemoglobin (r = 0.322, p<0 .001). In addition, TAC was positively correlated with serum uric acid and albumins (r=0.662, p=0.002; r=0.246, p=0.012). Significant correlations of Hgb and redox status indices are shown in Figure 2.
Significant correlations of hemoglobin and different oxidative stress parameters.
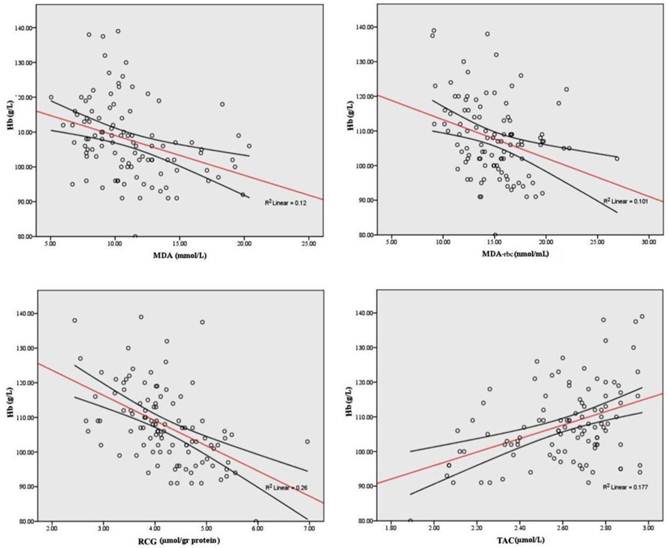
Finally, significant correlations of CRP with TAC (r = -0.246, p< 0.001) were seen in patients on hemodialysis. -SH groups only correlate with albumins (r=0,197, p<0,05). No correlations were found between iron indices and oxidative stress parameters.
DISCUSSION
Oxidative stress results from the imbalance of ROS and defense mechanisms, which results in cell damage. ESRD patients on maintenance HD treatment are under the risk of increased oxidative stress caused by several mechanisms, as previously outlined. While uremia is capable of inducing oxidative stress, anemia amplifies it (17,18). The mechanisms by which anemia contributes to oxidative stress are not fully understood, but factors such as hypoxia, peroxidation of lipids in the erythrocyte membrane that reduce their life span (19) and altered catecholamine metabolism may play a significant role. A strategy for the optimized correction of renal anemia may represent an effective means of strengthening antioxidant capacity (20).
Currently, the mainstay of renal anemia treatment is recombinant human erythropoietin which has its primary effect on red blood cell progenitors and precursors by promoting their survival and, finally, hemoglobin synthesis. However, there is evidence that EPO therapy may interfere with ROS production (21). Recent data suggested that EPO potentiates cytoprotection by mitigating oxidative stress, the principal cellular insult (22). EPO may exert its antioxidative effects directly by exploiting intracellular antioxidative mechanisms such as hem oxygenase-1 and glutathione peroxidase (10,23). Furthermore, EPO may act indirectly by inducing iron depletion and thereby inhibiting iron-dependent oxidative injury (24). Increasing red blood cells by EPO may also indirectly reduce cellular oxidative stress, as red blood cells are loaded with a substantial amount of antioxidative enzymes (22).
Several studies have investigated the effects of erythropoietin on oxidative stress in hemodialysis patients (5,25); however, to our knowledge, ours is the first study to investigate time-dependent effects of erythropoietin treatment on oxidative stress parameters in hemodialysis patients. To get a more comprehensive picture of oxidative stress in patients with ESRD, we measured a complex of OS markers (plasma and erythrocyte MDA, reactive carbonyls, TAC, total SH groups).
Our data showed that HD patients, regardless of EPO treatment, had increased oxidative stress compared to healthy subjects which is in concordance with the previous studies (26,27,28). Furthermore, regarding the influence of EPO treatment on oxidative stress parameters, we found that overall lipid and protein oxidation as well antioxidative activity were similar between EPO(+) and EPO(-) groups which is in contrast to Mircescu et al. study (25). However, after dividing patients into subgroups according to the varying period of EPO treatment, heterogeneous results were obtained. Our data revealed that increasing periods of EPO treatment is associated with a gradual decrease in serum MDA and RCG levels and a similar increase in serum antioxidative activity. Interestingly, there were no significant differences in iron indices between patients' subgroups treated with erythropoietin, and decreases in lipid peroxidation was achieved despite iron supplementation. This was probably related to an improvement in the circulating erythrocyte mass.
As the EPO treated subgroups in the present study had similar Hgb, albumin, uric acid, CRP, iron and ferritin values and were all on bicarbonate dialysis, the differences encountered between them with respect to oxidative stress cannot be attributed to varying degrees of anemia, hypoalbuminaemia, inflammation or to different dialysates.
Varying periods of exposure to EPO were the main difference between EPO subgroups, suggesting that prolonged EPO treatment may be an independent attenuator of the oxidative stress that accompanies uremia in HD patients.
HD patients showed higher levels of MDA production at the beginning of EPO treatment indicating an increased susceptibility to oxidative stress of RBC in these patients.
Turi et al. reported that the level of oxidative stress is transiently increased after the initiation of epoietin-α treatment, culminating at week 4 of treatment, as indicated by the elevations in the whole blood oxidized and reduced glutathione (GSSG/GSH) ratio and concentrations of the Hgb oxidation metabolites metHgb and hemichrome (29). The differences in the time course of MDA-formation between our EPO groups might be the consequence of this.
A previous study revealed an increase in erythrocyte membrane MDA and an inverse correlation between hemoglobin concentration and erythrocyte MDA (30). All our EPO patients had a similar range of hemoglobin concentration, so we concluded that EPO but not Hgb causes changes in oxidative stress parameters.
In the study of Koken et al., a strong correlation between the increase in oxidative stress and the duration of HD was seen (31). However, in our study groups, patients that received dialysis for the longest period of time (Group IIc, 91,2±51,1 months) also underwent the most extensive EPO treatment (>24 months). These patients had the lowest degree of oxidative stress in the erythrocyte membrane indicating that erythropoietin may exert a protective effect on erythrocytes. At the same time, higher levels of TAC were also verified in the group with the longest duration of EPO treatment (group IIc) but without any concomitant changes in the urate or albumin levels which represent valuable extracellular antioxidants. The most likely reason for this phenomenon is the increased activity of HO-1 oxygenase (23) but also sufficient antioxidant enzymes in the erythrocyte membrane.
We conclude that prolonged exposure to EPO, especially for more than 2 years, can act as an attenuating factor on uremia/anemia-associated oxidative stress. Owing to the cross-sectional design of our study, a cause-effect relationship between EPO treatment duration and oxidative stress could not be conclusively proven. Further studies are necessary to fully determine the respective influences of time-dependent EPO treatment on redox status in HD patients.
Acknowledgements
This study was supported by grant of Ministry of Science and Technological Development - project number 41018.
Competing Interests
The authors have declared that no competing interest exists.
References
1. Miyata T, Kurokawa K, Van Ypersele De Strihou C. Relevance of oxidative and carbonyl stres to long term uremic complications. Kidney Int. 2000;58(76):120-125
2. Descamps-Latscha B, Witko-Sarsat V. Importance of oxidatively modified proteins in chronic renal failure. Kidney Int. 2001;59(78):108-113
3. Zoccali C, Mallamaci F, Tripepi G. AGEs and carbonyl stres: potential pathogenetic factors of long-term uremic complications. Nephrol Dial Transplant. 2000;15(2):7-11
4. Locatelli F, Canaud B, Eckardt K, Stenvinkel P, Wanner C, Zoccali C. Oxidative stress in end-stage renal disease: an emerging threat to patient outcome. Nephrol Dial Transplant. 2003(18):1272-1280
5. Sommerburg O, Grune T, Hampl H. et al. Does long-term treatment of renal anaemia with recombinant erythropoietin influence oxidative stress in haemodialysed patients? Nephrol Dial Transplant. 1998;13:2583-2587
6. Besarab A. Iron and cardiac disease in the end-stage renal disease setting. Am J Kidney Dis. 1999;34(2):S18-S24
7. Usberti M, Gerardi G, Bufano G. et al. Effects of erythropoietin and vitamin E-modified membrane on plasma oxidative stress markers and anemia of hemodialyzed patients. Am J Kidney Dis. 2002;40:590-599
8. Inal M, Kanbak G, Sen S, Akyüz F, Sunal E. Antioxidant status and lipid peroxidation in hemodialysis patients undergoing erythropoietin and erythropoietin-vitamin E combined therapy. Free Radic Res. 1999;31:211-216
9. Mimic-Oka J, Simic T, Djukanovic L. Epoetin treatment improves red blood cell and plasma antioxidant capacity in hemodialysis patients. Ren Fail. 2002;24:77-87
10. Calo LA, Stanic L, Davis PA. et al. Effect of epoetin on HO-1 mRNA level and plasma antioxidants in hemodialysis patients. Int J Clin Pharmacol Ther. 2003;41:187-192
11. Siems W, Carluccio F, Radenkovic S, Grune T, Hampl H. Oxidative stress in renal anemia of hemodialysis patients is mitigated by epoetin treatment. Kidney Blood Press Res. 2005;28:295-301
12. Andreeva IL, Kožemjakin AL, Kishkun AA. Modifikacija metoda opredelenia perekisej lipidov v teste s tiobarbiturovoj kislotoj. Lab Delo. 1988;11:41-43
13. Jain SK, Levine NS, Duett J, Hollier B. Elevated lipid peroxidation levels in red blood cells of streptozotocin treated diabetic rats. Metabolism. 1990;39:971-975
14. Levine RL, Garland D, Oliver CN. et al. Determination of carbonyl content in oxidatively modified proteins. Meth Enzymol. 1990;186:464-478
15. Sedlak J, Lindsday R. Estimation of total protein bound and non-protein sulphydryl groups in tissue with Ellman's reagent. Anal Biochem. 1968;25:192-205
16. Koracevic D, Koracevic G, Djordjevic V, Andrejevic S, Cosic V. Method for the measurement of antioxidant activity in human fluids. J Clin Pathol. 2001;54:356-361
17. Celik G, Yöntem M, Bilge M, Cilo M, Ünaldi M. The relationship between the antioxidant system and anaemia in haemodialysis patients. J Int Med Res. 2011;39(5):1954-1960
18. Căpuşă C, Mircescu G. Oxidative stress, renal anemia, and its therapies: is there a link? J Ren Nutr. 2010;20(5):71-76
19. Cavdar C, Camsari T, Semin I, Gonenc S, Acikgoz O. Lipid peroxidation and antioxidant activity in chronic haemodialysis patients treated with recombinant human erythropoietin. Scand J Urol Nephrol. 1997;31:371-375
20. Siems W, Quast S, Carluccio F. et al. Oxidative stress in chronic renal failure as a cardiovascular risk factor. Clinical Nephrology. 2002;58(1):12-19
21. Lahera V, Goicoechea M, García de Vinuesa S. et al. Oxidative stress in uremia: the role of anemia correction. J Am Soc Nephrol. 2006;17:174-177
22. Katavetin P, Tungsanga K, Eiam-Ong S, Nangaku M. Antioxidative effects of erythropoietin. Kidney International. 2007;72:10-15
23. Katavetin P, Inagi R, Miyata T. Erythropoietin induces heme oxygenase-1 expression and attenuates oxidative stress. Biochem Biophys Res Commun. 2007;359:928-934
24. Bayés B, Pastor MC, Bonal J, Foraster A, Romero R. Oxidative stress, inflammation andcardiovascular mortality in haemodialysis - role of seniority and intravenous ferrotherapy: analysis at 4 years of follow-up. Nephrol Dial Transplant. 2006;21:984-990
25. Mircescu G, Cãpucã C, Stoian I. The influence of Epoietinum Therapy on the oxidative stress in HD patients. N Clin Practice. 2005;100(4):126-132
26. Miyata T, Sugiyama S, Saito A, Kurokawa K. Reactive carbonyl compounds related uremic toxicity (“carbonyl stress”). Kidney Int. 2001;78:25-31
27. Handelman GJ, Walter MF, Adhikarla R. et al. Elevated plasma F2-isoprostanes in patients on long-term hemodialysis. Kidney Int. 2001;59:1960-1966
28. Oberg BP, McMenamin E, Lucas FL. et al. Increased prevalence of oxidant stress and inflammation in patients with moderate to severe chronic kidney disease. Kidney Int. 2004;65:1009-1016
29. Turi S, Nemeth I, Varga I, Bodrogi T, Matkovics B. The effect of erythropoietin on the cellular defence mechanism of red blood cells in children with chronic renal failure. Pediatr Nephrol. 1992;6:536-541
30. Gallucci MT, Lubrano R, Meloni C. et al. Red blood cell membrane lipid peroxidation and resistance to erythropoietin therapy in hemodialysis patient, Clin. Nephrol. 1999;52:239-245
31. Köken T, Serteser M, Kahraman A, Gökçe C, Demir S. Changes in serum markers of oxidative stress with varying periods of haemodialysis. Nephrology. 2004;9(2):77-82
Author contact
![]() Corresponding author: Dr Zorica Dimitrijevic, Clinic of Nephrology and Hemodialysis, Clinical Center Nis, Serbia, Bul. Dr Zorana Djindjica 48, 18000 Nis, Serbia. Phone: +381-18-4201701, Fax: +381-18-4201701, email d.ivars.
Corresponding author: Dr Zorica Dimitrijevic, Clinic of Nephrology and Hemodialysis, Clinical Center Nis, Serbia, Bul. Dr Zorana Djindjica 48, 18000 Nis, Serbia. Phone: +381-18-4201701, Fax: +381-18-4201701, email d.ivars.