Impact Factor ISSN: 1449-1907

 Global reach, higher impact
Int J Med Sci 2012; 9(5):339-352. doi:10.7150/ijms.4414 This issue Cite
Research Paper
BioShuttle Mobility in Living Cells Studied with High-Resolution FCS & CLSM Methodologies
Klaus Braun1 ![]() , Marcel Beining2, Manfred Wiessler1, Twan Lammers3, Rüdiger Pipkorn4, Ute Hennrich1, Kiyoshi Nokihara5, Wolfhard Semmler1, Jürgen Debus6, Waldemar Waldeck2
, Marcel Beining2, Manfred Wiessler1, Twan Lammers3, Rüdiger Pipkorn4, Ute Hennrich1, Kiyoshi Nokihara5, Wolfhard Semmler1, Jürgen Debus6, Waldemar Waldeck2
1. German Cancer Research Center, Dept. of Imaging and Radiooncology, INF 280, D-69120 Heidelberg, Germany.
2. German Cancer Research Center, Central Peptide Synthesis Unit, INF 580, D-69120 Heidelberg, Germany.
3. Utrecht University, Dept. of Pharmaceutics, Sorbonnelaan 16, NL-3584 Utrecht, The Nederlands.
4. German Cancer Research Center, Division of Biophysics of Macromolecules, INF 580, D-69120 Heidelberg, Germany.
5. HiPep Laboratories, Nakatsukasa-cho, 486-46, Kamigyo-ku, Kyoto 602-8158, Japan.
6. Heidelberg University Hospital, Dept. of Radiation Oncology, INF 400, D-69120 Heidelberg, Germany.
Received 2012-3-29; Accepted 2012-6-18; Published 2012-7-1
Abstract
With the increase in molecular diagnostics and patient-specific therapeutic approaches, the delivery and targeting of imaging molecules and pharmacologically active agents gain increasing importance. The ideal delivery system does not exist yet. The realization of two features is indispensable: first, a locally high concentration of target-specific diagnostic and therapeutic molecules; second, the broad development of effective and safe carrier systems. Here we characterize the transport properties of the peptide-based BioShuttle transporter using FFM and CLSM methods. The modular design of BioShuttle-based formulations results in a multi-faceted field of applications, also as a theranostic tool.
Keywords: Drug Delivery, BioShuttle, Confocal Laser Scanning Microscopy-CLSM, Fluorescence Correlation Spectroscopy-FCS, Fluorescence Fluctuation Microscopy-FFM, Ligation chemistry, Non-Viral Carrier Systems, Spinning Disc Microscopy-SDM.
Introduction
The fields of molecular imaging, drug targeting, bioinformatics and biomedical research are currently merging in to the expanding field of theranostics [1-3]. The theranostic trends change increasingly from systemic towards patient-specific strategies [4-6]. Instead of native nucleic acids whose use as a drug is hampered by their nuclease sensitivity, the use of amine-polymers functionalized with the potential of Watson-Crick binding lacking nuclease sensitivity can produce relief [7-10]. The cell membrane however, forms an almost impassable obstacle. This basic problem of nucleic acid-based active molecules, responsible for their poor uptake into living cells and tissues, remains to be solved [11-14]. Great efforts resulted in multifaceted methods of viral [15-17] and non-viral carrier [18-22] solutions. Peptide-based molecules which harbour cell membrane penetrating properties are documented as CPP (cell penetrating peptides) [23-27]. In our hands, one approach to circumvent this hurdle and enter cells is based on functional peptides which are modularly composed depending on their conceptual formulation, hereafter called “BioShuttle” [11]: BioShuttle-based formulations employ amphiphilic peptides, ligated to their functional groups via disulfide bridge formation, for transport across the cell membrane. By the use of different cell immanent mechanisms, based on reductive conditions located in the cytoplasm, the disulfide-bridges can be cleaved. As a consequence, the CPP-part of the BioShuttle is separated after passage across the cell membrane from a nuclear localization sequence (NLS) -based address moiety [28-30], enabling the delivery of imaging molecules and/or pharmacologically active components into the nucleus [11, 31]
To provide an experimental proof-of-principle for these features, three BioShuttle constructs were tested, which are illustrated schematically in Figure 1:
illustrates schematically the investigated Bioshuttle-conjugates.
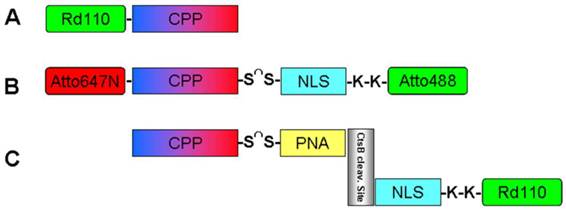
A. The CPP-Rd110 consists of the pAntp peptide fragment which is labeled with Rhodamine 110 at the N-terminus. The pAntp's (CPP) amino acid sequence is KKWKMRRNQFWIKIQRC which facilitates the passage of molecules across the cell membrane. All constructs are able to pass through cell membranes into the cytosol via the CPP.
B. The double-labeled BioShuttle construct (Atto647N)-CPP-S∩S-NLS-(Atto488) comprises pAntp (CPP) (KKWKMRRNQFWIKIQRC) conjugated to a NLS (VKRKKP) module by a disulfide linker. Both modules are conjugated to fluorescent dyes (coupled by a peptide bond to the N-terminus or to lysine, respectively): the CPP is labeled with Atto647N and the NLS sequence is labeled with Atto488. After crossing the cell membrane, the linker between the modules should be cleaved and the NLS should be transported into the nucleus. Hence, cytoplasm and nucleus will be labeled differently. After cleavage, the residual fluorescently labeled NLS can diffuse freely and can actively enter the cell nucleus.
C. The CtsB-PNA construct's structure is more complex (Rd110-NLS-GFGRK-cagcgctgcag-S∩S-CPP) [32]: The CPP is coupled to a peptide nucleic acid (PNA) sequence by a disulfide linker which can be cleaved by intracellular disulfide reductases. The PNA sequence (in italic) acts as an antisense sequence molecule and should hybridize specifically with the mRNA transcript of cathepsin B, which is a peptidase overexpressed in many (metastatic) cancer cell lines. A short peptide sequence (GFGRK) inserted between the complementary PNA and the nuclear localization sequence (NLS) module acts as a substrate, enabling specific cleavage by cathepsin B [33]. Nuclei of cells with normal Cathepsin B expression without an active gene product should be fluorescence-identifiable barely by this construct. This experiment should demonstrate the potential of FFM for imaging of gene expression in diagnostics. Here we used as an example the CtsB gene encoding the matrix metal proteinase CtsB whose activity is associated with tumor malignancy [34, 35].
Whereas functional modules associated with transmembrane-transport facilitating properties, like the cell penetrating peptides[12, 15, 23, 36, 36-39], nuclear localization sequences [28, 40-46] and the antisense molecules [47-53] have been broadly characterized, the intra- and extracellular dynamics and the subcellular distribution of modular carrier materials containing such moieties have not been evaluated in great detail. Here, the mobility of the three abovementioned BioShuttle constructs was investigated by fluorescence correlation spectroscopy (FCS). In FCS, dynamic parameters of a fluorescent sample are derived from statistical fluctuations in fluorescence intensity in a small detection volume of a confocal microscope [54]. These fluctuations are mainly induced by the diffusion of the fluorescent probe through the observation volume. The high spatial resolution and the applicability of FCS also in vivo are powerful tools for measuring the local concentration and the diffusion coefficient in different subcellular compartments [55]. In addition, BioShuttle-facilitated transmembrane transport, nuclear targeting and intracellular localization were investigated using an adapted confocal laser scanning microscopy (CLSM) protocol.
Material & Methods
Cell culture
Cells lines [HeLa and HeLa S3 (suspension culture), MCF7 and TP366 cells] were maintained in DMEM (RPMI1640 for HeLa S3) medium without phenol red and with 10 % fetal calf serum at 37°C in a humid atmosphere with 5 % CO2 and passaged twice in a week. Two days before the measurements, about 1 × 10⁵ cells were transferred into Lab-TekTM Number One chambers.
Fluorescence Fluctuation Microscopy
Briefly, to investigate the molecular diffusion and localization, a custom-made [54] Fluorescence Fluctuation Microscope (FFM), combining an FCS unit and a CLSM, was used. More details are published by the Langowski group [56]. The custom-made FFM software allowed taking pictures of the cells and measuring diffusion at selected loci in the cells. A diffusion model was fitted to the data to calculate 1) the diffusion coefficient, 2) the number of particles, and 3) the triplet states, using the custom-made software Quickfit 2 (http://download.cnet.com/QuickFit/3000-18541_4-10626451.html). Data with large fluctuations due to aggregated fluorescent molecules were filtered out. The FFM was calibrated every day with standard fluorophores (i.e. Alexa Fluor® 488 for the 488 nm laser; and Cy5 for the 647 nm laser [Life Technologies, Germany]. Both were used at a concentration of 20 nM).
PerkinElmer Spinning Disc confocal microscopy (SDM) - PerkinElmer Ultra View
SDM was carried out with a PerkinElmer Spinning Disc confocal microscope (Nikon Ti-inverse microscope). It produces high gray scale quality pictures due do the specific construction type and the rotating pinhole disc which allows the generation of high speed pictures of cells (exemplarily HeLa S3 cells). They exhibit a xyz-scan by use of an Ar/Kr laser (488/568/647 nm). The detection was carried out with a Hamamatsu EM-CCD camera (high-sensitive-grey-scale-values-CCD).
Fluorimeter spectroscopy
The excitation and emission spectra of fluorescent substances were measured with a fluorimeter (Aminco SLM 8100 SLM, Urbana, USA). As a standard, a highly concentrated Rhodamin B (RdB) solution was used. All spectra were recorded at room temperature.
Absorption spectra measurements
The absorption spectra were recorded with a Cary 4E spectrophotometer (Varian, Mulgrave, Australia) at room temperature. It is suitable for wave lengths of 175-900 nm with an accuracy of 0.001 optical density (OD). The molar extinction coefficients of the dyes were obtained from the manufacturer's websites.
Chemical Procedures
Synthesis of BioShuttle conjugates
For solid phase synthesis of the CPP (KKWKMRRNQFWIKIQRC) and the NLS (VKRKKP) as well as of the PNA (cagcgctgcag), we employed the Fmoc-strategy [57, 58] in a fully multiple automated synthesizer Syro II (MultiSyn Tech, Germany). Peptide chain assembly was performed using in situ activation of amino acid building blocks by 2-(1H-Benzotriazole-1-yl)-1,1,3,3-tetramethyluronium hexafluorophosphate (HBTU). The PNA sequences were synthesized on a PetiSyzer® [59] in the HiPep Laboratories Kyoto Japan and details are described elsewhere [33]. The different markers [Atto488, Atto565 and Atto647N (Atto-TEC, Germany); Rhodamine 110 (Santa Cruz Biotechnology, USA) were introduced as free acids or succinimidyl esters. A disulfide bridge between the N-terminal cysteine of drosophila's antennapedia derived peptide fragment “pAntp” CPP and the N-terminal cysteine residue of the NLS was formed by the activation of one cysteine using 2,2'-dithiopyridine and coupling to the cysteine of the other module. The coupling reaction was carried out in an ethanol / water buffer at 60 °C. The individual components and the complete conjugates (A, B, C) were validated using LCMS (Schimadzu LC-10 and LCQ electrospray Finnigan). The purity levels were generally >90%.
Purification of samples
To separate free dye from BioShuttle-conjugated dye, we used Vivaspin 500 3.000 MWCO centrifugal units (Sartorius, Göttingen, Germany) in TE buffer (Tris/EDTA) containing 0.02 % of the detergent Nonidet P40 (NP40) (Roche, Mannheim, Germany). The concentration was assessed using the absorption spectrometer (in silanized glass cuvettes). Two hundred µl of the sample was pipetted into the Vivaspin centrifugal unit and centrifuged at 11.000 rpm for 10 min as described by the manufacturer. The filtrate was measured again.
Optimizing Fluorescence correlation spectroscopy (FCS) measurements
Determination of the stability of measurements
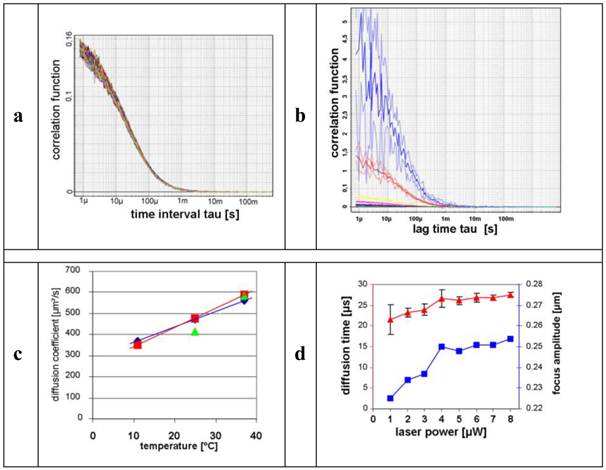
For the determination of the stability of the FCS measurements, n = 60 measurements of Alexa Fluor® 488 were conducted. Figure 2a shows the auto-correlation functions (ACFs) of these measurements. It is evident that all ACFs describe the identical particle with low divergence.
a) represents the auto-correlation functions (ACFs) of the performed Alexa Fluor® 488 measurements (n = 60). b) illustrates the decline of the autocorrelations under increasing concentrations of Alexa Fluor® 488 dye. Colour-coded curves of the dilution series: 0.2 nM (blue), 2 nM (red), 10 nM (yellow), 20 nM (magenta), 50 nM (black), 100 nM (brown), 200 nM (green). c) shows the graphs of the diffusion coefficients (ordinate) and the temperature profile (abscissa).  ,
,  , are equivalent to one and four runs and
  represents reference values. d) shows the plots of the corresponding diffusion times [µs] (red ordinate) and the focus amplitude (blue ordinate), the abscissa represents the laser output [µW]. The standard deviations of the diffusion times decreased (
 ) when the laser output increased, and in parallel the focus amplitude (excitation volume) increased (
 )] (n = 6).
Calibration measurements with Alexa Fluor® 488
In order to correlate diffusion with molecular mass, we compared small (Atto565) and large molecules (A: CPP-RD 110) (Figure 1). We measured diffusion coefficients of A under normal conditions (5 µW laser power, room temperature, calibrated FCS, dimmed room, etc.) (Figure 2). The standard deviation of 4.2 % verifies stable measurement, accuracy and precision. Arithmetic average and standard deviations were calculated ( ) and resulted in 586.13 ± 24.59 µm2/s as shown in Figure 2c.
Influence of Alexa Fluor® 488 concentration on the stability of measurements in solution
The influence of the concentration on the diffusion rate was determined with an Alexa Fluor® 488 dilution series from 0.2 up to 200 nM (n = 4 for each concentration; 30 s). Figure 2b shows the inverse proportionality of the decline of the amplitude while increasing the molar concentrations of the fluorescent dye.
Influence of measurement temperature on the diffusion coefficient
In order to optimize the influence of the measurement temperature on the diffusion behaviour of the samples in solution, we first tested an Alexa Fluor® 488 calibration solution at 11 °C, 25 °C, and 37 °C, respectively (n = 4 test runs; 20 s; see Figure 2c).
Influence of laser intensity on diffusion time
In order to receive adequate correlation functions, sufficient fluorescence signal intensities are needed. An increased laser power illuminates the effective focus volume more intensely. Therefore the influence of the laser output on the calculated focus amplitude as well as on the precision of the diffusion times was investigated using a standard solution of Alexa Fluor® 488 at several laser outputs (n = 6 test runs; 30 s). The resulting diffusion times were calculated using Quickfit 2 software and graphically illustrated as shown in Figure 2d.
Estimation of fluorophore diffusion properties by FCS
The diffusion characteristics of the fluorophores used in the study were determined by FCS at 25 °C in TE buffer (6 runs; 30 s). Table 1 provides an overview of the measured values. As reference dyes for the determination of the actual focus aperture, Alexa Fluor® 488 (488 nm), Rhodamin B (Rd B, 568 nm) and Cy5 (647 nm) were investigated. Except for the Atto674N, the measured diffusion coefficients oscillate around the corresponding literature values during the calibration procedure [60-62].
demonstrates the conclusion of the FCS characteristics. For a better understanding, the dyes are arranged according to the increasing MW.
| Line | MW [g/mol] | diffusion coefficient [µm²/s] | |
|---|---|---|---|
| 1 | Rd110 | 366*) | 502,760 ± 18,963 |
| 2 | RdB | 479*) | 418,308 ± 56,748 |
| 3 | Atto565 | 611 | 392,243 ± 13,927 |
| 4 | Alexa488 | 643 | 414,579 ± 14,295 |
| 5 | Atto647N | 746 | 546,647 ± 36,881 |
| 6 | Cy5 | 792 | 370,070 ± 9,640 |
| 7 | Atto488 | 804 | 448,956 ± 32,455 |
*) Fluka (Sigma-Aldrich), Switzerland.
Diffusion measurements of Atto565 mixed with CPP-Rd110 in vitro - calibration of the Fluorescence fluctuation microscope (FFM)
For investigation in more detail, we compared the Atto565 fluorescent dye and the conjugate CPP-Rd110 (A) at a final concentration of 20 mM dissolved in TE buffer (Tris/EDTA). A further CPP-Rd110 probe mixed with 0.02 % NP40 detergent was evaluated to avoid sticky effects. The FFM measurements were accomplished in µ-slides™ as detailed in [56], and the resulting graphs are shown in Figure 3.
displays the dependency of different FFM parameters on the measuring depth with Atto565 [20 mM]. The calculated particle number (black) and count rate (blue) feature a near identical run of the curves approximating the glass surface whereas the diffusion time (red) remains relatively constant. The graph of the averaged ACF (brown /×) shows a higher diffusion time slightly increasing near the glass surface.
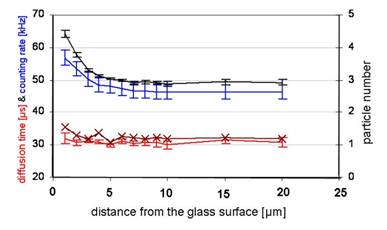
Impact of construct A and Atto565 on glass cuvette surfaces - measurements of the laser intensity and diffusion time dependent on FFM calibration in vitro
Up to 4 µW of laser power, the focus amplitude increased nearly linearly whereas at higher laser powers, it was saturated (Figure 2d). The data show a clear proportionality between the count rate and the calculated particle number, suggesting a concentration gradient. The constant diffusion time (32 µs) reveals neither an aggregation nor a structural adhesion (Figure 3). The FFM measurements with CPP-Rd110 A and Atto565 with and without NP40 are shown in Figure 4.
the graphs display the dependency of different FFM parameters on the measuring depth with CPP-Rd110 A [20 nM] without (A) and with NP40 detergent (B) [0.02 %]. The abscissa represents the spatial distance of the measured molecule from the glass's surface [µm]. Graph A demonstrates diagrams of the particle number (black), the counting rate (blue) [kHz], and the diffusion time (red) [µs] similar to the Atto565 diagrams (Figure 3).
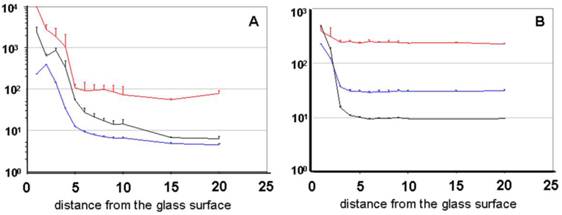
The probe treated with NP40 clearly offers a reduced adsorption, which is confirmed by the constant count rate as well as by the constant particle number. The distance from the surface between 4 and 20 µm as well as the slight increase near the measuring chamber's basement was taken into account. Graph B represents the diagrams of the probe treated with NP40 and shows an increase of the diffusion time under a distance of 3 µm.
In vitro test of the cleavage of the disulfide bridge of B using β-mercaptoethanol and dithio-threitol
An important step for the nuclear transport of the cargo by the BioShuttle, is its separation from the pAntp module (CPP) after reaching the cytosol. Since the pAntp module is linked to the rest of the construct via a disulfide bridge linker, it should be cleaved intracellulary by cytosolic reductases. In vitro, this molecule could be cleaved using strong reducing agents such as β-mercaptoethanol (2-Me) and dithio-threitol (DTT). The separation was validated using FCS, revealing an increased diffusion coefficient after cleavage in both cases (Table 2). The system can be used in a pH range of 6.5-9.0. In order to analyze the separation of the modules in TE buffer, the (Atto488)-CPP-S∩S-NLS-(Atto647N) B BioShuttle conjugate was treated with 2-Me or DTT. The BioShuttle construct had a final concentration of 40 nM. 2-Me was used in a concentration between 50 mM and 250 mM, DTT at 50 mM.
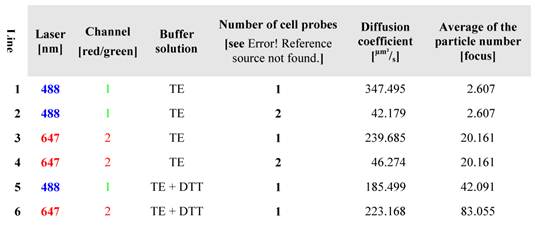
lists the diffusion characteristics of (Atto647N)-CPP-S∩S-NLS-(Atto488) B. The data confirm high quality purification and a cleavable disulfide bridge. The probe was measured in 100 mM TE-buffer, containing DTT.
BioShuttle applications - Addition of BioShuttle conjugates to cells
Low volumes of BioShuttle constructs dissolved in buffers were used for application to cells in order to avoid side effects of solvents such as NP40 and acetonitrile. To obtain a homogenous distribution of the molecules, 200 µl cell culture medium were mixed with 0.5-3 µl BioShuttle conjugate and then distributed on the cells and incubated for 24 h or overnight depending on the experiment. In live imaging experiments, BioShuttle administration was directly performed at the microscope stage after starting the image acquisition.
Fluorescence Imaging Studies in living cells
In HeLa and MCF7 cells, fluorescence imaging studies were carried out. We investigated the effects of CPP-Rd110 A on the phenotypical change of HeLa and MCF7 cells. Single pictures and real-time shots were generated by use of FFM and SDM microscopes, equipped with highly sensitive CCD cameras or photo-multipliers (PMTs).
Quantitative fluorescence analysis in HeLa S3 cells
Two samples with 0.56 ml of HeLa S3 suspension cells and two samples with 0.56 ml of cell medium (positive control) were treated with 50 µl (Atto647N)-CPP-S∩S-NLS-(Atto488)-BioShuttle B to obtain a final concentration of 1.46 µM (Atto647N)-CPP-S∩S-NLS-(Atto488)-BioShuttle B. As a negative control, an untreated HeLa S3 cell suspension was used. All samples were mixed, incubated for 1 h at 37 °C and centrifuged at 800 rpm for 5 min. The supernatant was analyzed in the absorption spectrometer to calculate the residual amount of (Atto647N)-CPP-S∩S-NLS-(Atto488)-BioShuttle B. Glass cuvettes were silanized before use.
Fluorescence analysis of Cathepsin B activity in HeLa, MCF7 and TP366 cells
The status analysis of the CtsB enzyme activity was performed with the BioShuttle conjugate C (Rd110-VKRKKPK-GFGRK-cagcgctgcag-S∩S-CPP) (1.46 µM). The data were obtained by FFM methodologies under identical treatment conditions over 24 h as described above (BioShuttle applications - Addition of BioShuttle conjugates to cells).
Contemplation of the BioShuttle measurement studies
The summarized parameters achieved by the instruments' calibration procedures can be considered as a complex but helpful analysis platform. It is needed for a deeper characterization of the dynamics of functional molecules, investigation of the transport of active components and imaging of molecules after crossing biological membranes.
Three different shuttle molecules were constructed and investigated. Molecule A was used to analyze the transport into cells, molecule B to detect the transfer into the nucleus after cleavage of the disulfide-bridge in the cytoplasm, and molecule C to examine the status of the activity of the Cathepsin B enzyme.
Results
Fluorescence fluctuation microscopy - FFM in living cells
For the evaluation of effects of CPP-Rd110-BioShuttle A in the FF microscope HeLa and MCF7 cell lines were used. The fluorescence micrographs were taken 2.5 h after incubation with A in a final concentration of 100 nM.
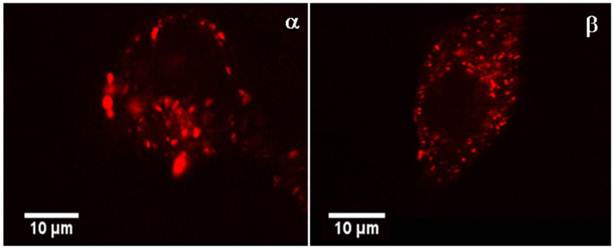
In the pictures in Figure 5, the CPP-Rd110-BioShuttle A is located inside of cytoplasmic vesicles and compactly aggregated in a size range between 0.5 and 3 µm. The nucleus is free of fluorescence signals.
the confocal FFM micrographs exhibit the intracellular distribution of CPP-Rd110 A in HeLa cells (picture α) and in MCF7 cells (picture β) 2.5 h after application. The red fluorescence signals are located almost exclusively in vesicle like structures inside of the cytoplasm.
Spinning Disc Microscopy studies - SDM
In the investigated HeLa S3 cells, the confocal equipment of the SDM (Perkin Elmer) realizes pictures of good quality. The low sensitivity of the available sensors, however, needed a high laser power to get noise-free pictures, which resulted in dramatic cell death. Therefore SDM was inappropriate for the creation of real time pictures and monitoring of the CPP-Rd110 BioShuttle's A passage across the cell membrane, but the SDM is ideally suited for Z-scans of BioShuttle construct A to visualize it inside of the cells (Figure 6).
illustrates the Z-scan through a HeLa S3 cell 1 h after incubation with CPP-Rd110 BioShuttle A [200 nM]. The series of pictures show optical longitudinal sections [300 nm] taken from bottom to top. The total high of the stack amounts to 9.3 µm.
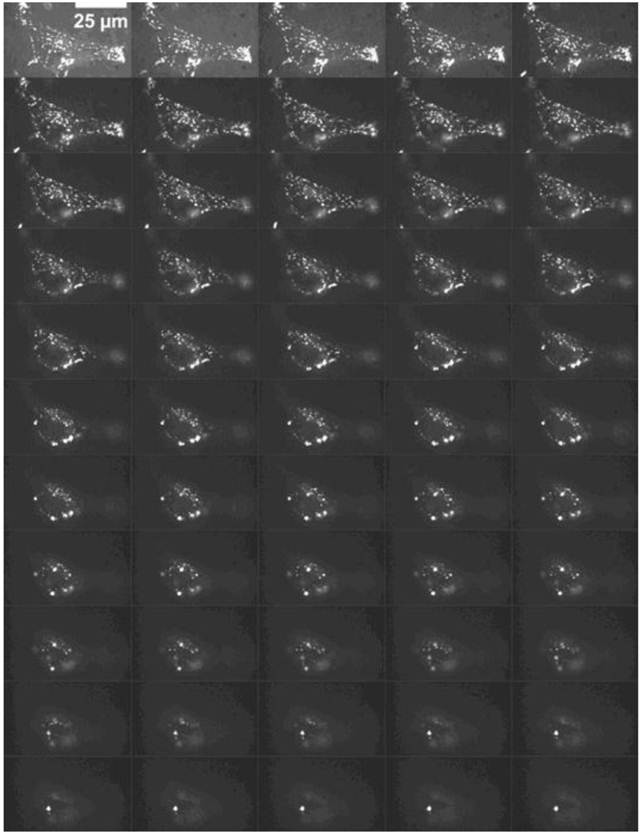
The results obtained in Figure 5 are confirmed here by scanning microscopy in the z-direction. A 3D reconstruction is visualized as a movie by the following link and illustrates the spatial distribution of the cytoplasm-located fluorescence signals whereas the cell nucleus area appears empty. (The software used was allocated at http://fiji.sc/wiki/index.php/3D_Viewer.)
Design of the double-labeled Shuttle for transport into the nucleus
In order to examine whether the construct can reach the nuclei, we built an extended shuttle labeled with Atto647N which contains a nuclear localization sequence (NLS) labeled with Atto488 (schematic Figure 1, B). The specific non-interacting spectra are shown in the atto-tec's website http://www.atto-tec.com. For excitation of the fluorescent dye, the measurements with the (Atto647N)-CPP-S∩S-NLS-(Atto488)-BioShuttle B required 488/647 nm wave lengths.
Quantitative fluorescence analysis in HeLa S3 cells
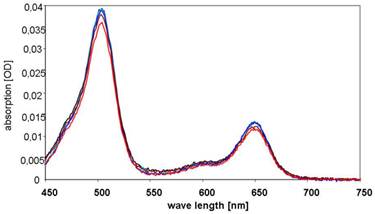
The relative amount of the BioShuttle in (Atto647N)-CPP-S∩S-NLS-(Atto488)-BioShuttle (sample B) was analyzed by assessing the intracellular fluorescence intensity of BioShuttle treated and subsequently washed HeLa S3 suspension cells after defined time periods. First, fluorimetric studies with HeLa S3 cells were conducted as described in the methods part for estimation of the relative amount of the free fluorescent dyes originating from the (Atto647N)-CPP-S∩S-NLS-(Atto488)-BioShuttle scheme (Figure 1, B). As a negative control the conjugate without fluorescent dyes and as a positive control medium plus fluorescent dyes were used. The resulting spectra, as illustrated in Figure 7, confirm the chemical stability of the construct. The negative control values were subtracted. Compared to the positive controls (A488 and A647N, separately dissolved in the medium), the intensities of the fluorescence signals originating from the (Atto647N)-CPP-S∩S-NLS-(Atto488) B are lower.
shows the absorption spectra of the cells's supernatants 1h after incubation with (Atto647N)-CPP-S∩S-NLS-(Atto488)-BioShuttle B. The curves are colour-coded as follows: initial concentration (black), probe 1 (blue), probe 2 (dark blue), supernatant of the Hela S3 probe 1 (brown), supernatant of the Hela S3 probe 2 (red).
Transmembrane transport, cleavage of the S-S-bridge of BioShuttle B and nucleus-directed transport
A CLSM-experiment for 60 min provided additional clarity about the transmembrane transport. HeLa cells were examined with a Nikon A1 microscope and after the application of (Atto647N)-CPP-S∩S-NLS-(Atto488)-BioShuttle B (100 nM), a time series was generated (10 s interval). As shown in the left hand panel of Figure 8 upper part, 30 s after incubation, the cells 1 and 2 are visible as non-fluorescent black areas. Sixty min after incubation as shown in the middle part and the right hand picture shows a membrane-located strong red fluorescence and inside of the cells 1 and 2 a clear green fluorescence is seen. The spatial separation of the fluorescence signals proofs the cleavage of the disulfide bridges.
The upper part illustrates the identical cross section of pictures at the time points of 30 sec (left) and 60 min (right) of a long-time uptake-experiment during 60 min with (Atto647N)-CPP-S∩S-NLS-(Atto488)-BioShuttle B into HeLa cells. The pictures represent a superimposition of the red and the green channels. The cells, marked 1 and 2 (left picture), were used for FCS measurements. The zoom into the image reveals particular signals with mixed fluorescence (3× arrows in the right picture). The graphs in the lower part of the figure visualize the intracellular fluorescence intensities relating to the separated transporter (Atto647N)-CPP-S∩S-NLS-(Atto488) B. The two arrays of curves indicate the intensity of the respective dye. The upper curves represent the fluorescence of Atto488, the lower array curves that of Atto647N in two selected cells during the time series under the Nikon A1Rsi. No saturation of the signal intensity is visible.
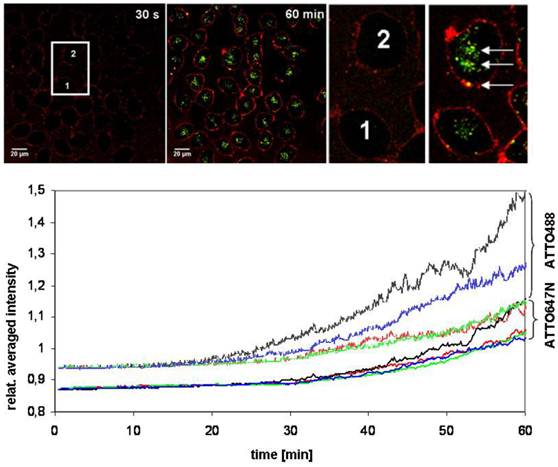
FCS diffusion studies of BioShuttle B in living cells
Two cells were selected (cells 1 and 2; highlighted in the center of the left panel of Figure 8) and their intracellular red and green fluorescence signal intensities were recorded over time (Figure 8). The intracellular fluorescence intensities of the separated BioShuttle B could be visualized. An interesting observance is given in the zoomed version of the cells of interest (ROI): Inside of the cell (2) particular signals with a mixed fluorescence are detectable (accentuated by arrows). Cell cycle phenomena as well as spill over effects can not be excluded and a background subtraction was not intended. Based on the long-term experiment it is shown that the dynamics of the transport of (Atto647N)-CPP-S∩S-NLS-(Atto488)-BioShuttle B could be better highlighted by FCS methodology.
In order to deepen the knowledge of the diffusion properties, the probe was measured with FCS in different solutions at 25°C (at 488 nm and 647 nm). The results are outlined in the Table 2. The measurements offer intact B molecules with a slightly different diffusion rate (line 2 and 4), wherein large molecules behave slowly and smaller molecules diffuse much faster (labelled cargo, line 1 and labelled CPP, line 3). The measurements of B at 488 nm and 647 nm, represent the decelerated diffusion (42.179 and 46.247 µm²/s, respectively) of the intact (i.e. uncleaved) BioShuttle B conjugate (lines 2 and 4). The in living cells cleaved conjugate B showed diffusion coefficient values of 347.495 and 239.685 µm²/s, (lines 1 and 3) which are lower but closer to the corresponding coefficient values (414.579 and 546.667 [µm²/s]) of the pure fluorescent dyes Atto647N and Atto488 (as shown in Table 1, lines 4 and 5). Table 1 also reflects the components of BioShuttle B after DTT mediated disulfide cleavage (Table 2, lines 5 and 6). The separated components (modules) of the double-labelled BioShuttle B are shown.
The separated probes treated in vitro with DTT, enabling disulfide bond cleavage, show diffusion coefficient values of 185.499 and 223.168 µm²/s respectively, indicating the retarded diffusion behaviour of both components after cleavage of the disulfide bond (Table 2, lines 5 and 6). The divergent coefficients demonstrate an independent diffusion.
Amplification cytoplasmic retention and cleavage of CtsB-PNA-BioShuttle C
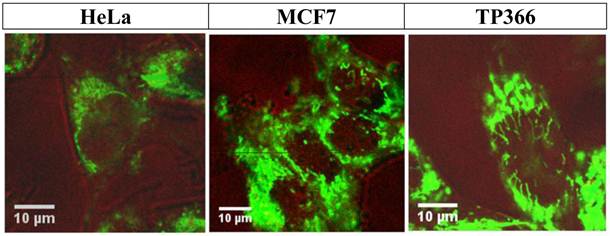
In order to achieve specific enrichment in areas of enhanced CtsB gene expression, a peptide-nucleic acid (PNA) complementary to CtsB mRNA was used in the design of BioShuttle C, to serve as an anchor inside treated cells by formation of CtsB mRNA/ CtsB-PNA hybrids. Twenty four hours after incubation with CtsB-PNA-BioShuttle C (final concentration 100 nM), HeLa, MCF7 and TP366 cells were investigated using FFM. All three cell lines show clear fluorescence signals in the cytoplasm.
The picture in the middle also presents clear cytoplasm located signals inside of the MCF-7 cells. Additionally, vesicularly structured areas with high fluorescence signals arranged perinuclearly are shown which indicate CtsB gene expression.
It is notable that particular vesicle-shaped fluorescence signals are depicted inside of the nucleus near the nuclear envelope of MCF-7 cells. In TP366 glioma cells we detected clear fluorescence signals spreading over the cytoplasm but also areas with a much stronger fluorescence in the nuclei. i) PNA trapping in cells with active CtsB enzyme resulted in clear fluorescence signals inside of the cell nucleus (Figure 9; right picture). Ii) Starting inside of the nuclear envelope to the core of the nucleus we could identify lamellarly shaped fluorescence signals as a network. Iii) This proofs accumulation of CPP by separation (disulfide-bridge cleavage), retardation of the molecule and a final nuclear transport.
shows confocal FFM images of HeLa (left), MCF7 (middle), and TP366 (right) cell lines 24 h after incubation with CtsB-PNA-BioShuttle C. All investigated cell lines show the successful uptake of CtsB-BioShuttle C as shown by the cytoplasm located fluorescence signals. In HeLa cells (left picture) the fluorescence signal is identified perinuclearly inside of the cell; however, no signal is shown inside of the nucleus. The middle picture illustrates MCF7 cells whose nuclei show band like fluorescence signals near the nuclear envelope and inside of the nuclei. TP366 glioma cells (right picture) show band like fluorescence signals inside of the cell nucleus.
Discussion
The efforts in transporter or vehicle development led to a myriad of viral vectors and non-viral peptide-based carrier systems with cell penetrating properties. Additionally, small functional peptides, also responsible for subcellular targeting, like nuclear localization sequences have been recognized and used. Also different physico-chemical uptake characteristics, like membrane-fusion and endocytotic mechanisms as well as immunological effects of the different membrane transport-facilitating molecules were documented [16, 63-70]. However, despite progress in the diagnostic and therapeutic fields, the targeted transport of imaging components and (nucleic acid-based) pharmacologically active agents remains a challenge.
A solution could be a combination of both: delivery and targeting systems by ligations of imaging molecules as a cargo with peptides harbouring biologic address informations which in turn are connected to a cell penetrating peptide via disulfide bridge formation. These can be selectively decomposed by enzymes, for instance by cytosolic disulfide reductases. Sophisticated specifications for safe and efficient delivery by such transporters are beyond dispute [71-79]. The compilation of the transporter specifications, however, needs specific parameters which can account for their characterizations' refinement. Therefore, we here - as an example - investigated the modular peptide-based BioShuttle drug delivery and targeting system in more detail using physical techniques. We used fluorescent molecules to demonstrate the enzymatic cleavage of the two subunits of the Atto488 and Atto647 double-labelled BioShuttle B conjugate (Figure 8). After cleavage of the disulfide bridge, the NLS module labelled with ATTO488 reaches the nucleus, whereas the membrane-transport facilitating module (CPP = cell penetrating peptide), labelled with ATTO647N raises the red fluorescence signals, membrane-located or in the direct environment. The depiction of the processes is documented [11, 80]. The FCS diffusion studies with this BioShuttle conjugate B, indicate that the FCS methodology turns out to be a suitable technique for analyzing BioShuttle intactness and separation. The variation in the diffusion behaviour can be considered as a meaningful parameter, as proven in Table 2. Moreover, the data can confirm a high quality and purification after solid phase peptide synthesis SPPS and an intact cleavable disulfide bridge.
In addition, the correlation coefficients' calibration procedures indicated measured values differing from the literature values (Table 1). This phenomenon is likely caused by physical interactions with the surface of the glass cuvettes of the molecules functionalized with fluorescent dyes due to their physicochemical properties [38]. Each measurement step was followed by a loss of probes caused by adhesion to pipette tips and reaction chamber surfaces. This perception is critical and demands intensive investigations on developing exigent standards not only for proper chemical synthesis methodologies, but also for the high quality of the educts and the intermediates and for the surface coating, e.g. silanizing, of reaction vessels, measurement chambers, and lastly for the packing materials. The development of standards according to pharmacopoeia principles, eligible for pharmaceutical use in e.g. personalized medicine, therefore is highly important.
A further interesting and important aspect in this context is the use of enzyme activities (here CtsB), which correlate with the invasive potential and behaviour of tumors. The BioShuttle's modular composition is detailed in [32], and allows the insertion of a peptide-based cathepsin B (CtsB) cleavage site, acting as a substrate for the active CtsB enzyme [81-84]. The molecular mechanism of C is documented [33]. As a further improvement, this BioShuttle variant C was tested on cell lines with different CtsB status and was visualized in Figure 9. Here the extent of the Atto488 fluorescence intensity and its subcellular localization could be observed depending on the CtsB gene expression level and on the corresponding CtsB enzyme activity status respectively [34, 85-87].
It is important to note that pre-treatment of cells is critical for the CLSM and FCS studies. Therefore, to avoid cellular artefacts which could distort the results, only living and non-fixed cells were used. The combined use of both methodologies may give insight into new aspects of theranostics via physicochemical characterization and can be consulted as a helpful concept for the directly comparable characterization of carrier and targeting constructs [88-90].
Care should be taken regarding unforeseen behaviour, like the adsorption of molecules at the cuvettes' surfaces which can influence measuring results as observed during fluorescence correlations spectroscopy (FCS) (Figure 3 and Figure 4). These difficulties and unexpected proceedings should be definitely considered. Furthermore, physical and equipment specific parameters in CLSM like laser intensities as well as sensitivity of the different sensors cannot be ignored in the interpretation of the results (Figure 2). It is generally agreed that the choice of technical equipments deriving from different manufactures can impact the outcome of measurements, as shown in the calibration studies. As shown here the characterization of such complex conjugates is possible.
Strong fluorescence signals are located inside of vesicular compartments indicating an internalization of the BioShuttle conjugates into vesicular particles. These phenomena were already observed and documented in previous BioShuttle publications [11] [91]. Their similarity to the structures documented as light granulation triggered by physical interference reactions of optical raggedly surfaces is evident [92]. This indicates that our observations in the CLSM measurements as well as in the magnetic resonance imaging (MRI) (not shown here) resemble the data derived from the laser speckle contrast imaging studies (well reviewed by Boas and Dunn in 2010) [93]. In this regard, BioShuttle carrier variants functionalized with fluorescent dyes [94], and/ or with MR contrast agents [95] can be considered as eligible tools in fluorescent speckle microscopy and in molecular imaging for studying intracellular metabolism dynamics in vivo, as documented by the Keating group [96]. Worth mentioning is also a BioShuttle conjugate which can be ligated to ultrasound contrast agents, as a tool in the field of acoustically modulated speckle imaging [97].
Outlook
All in all, despite the modular BioShuttle's drug delivery platform multi-faceted applications, the competent knowledge and the choice of many critical physical parameters as qualified measurement methods is pivotal. It is important for its further specification development, efficient drug delivery tools and for a hopeful outlook to further applications in the patient-specific medicine, not restricted to imaging. The observations focused on the physico-chemical properties of the imaging components and of the functional molecules should be discussed with respect to: 1) lipophilic/hydrophilic characteristics, 2) distribution kinetics and dynamics within dispersoids 3) for use as a theranostic tool in the personalized medicine.
Acknowledgements
This work was supported by the Deutsche Krebshilfe, D-53004 Bonn; Grant Number: 106335. The authors are thankful to Gabriele Müller, Biophysics of Macromolecules Department, DKFZ and Mario Koch, Central Peptide Synthesis Unit, DKFZ for their encouragement.
Competing Interests
The authors have declared that no competing interest exists.
References
1. Xie J, Lee S, Chen X. Nanoparticle-based theranostic agents. Adv Drug Deliv Rev. 2010;62:1064-79
2. Lammers T, Kiessling F, Hennink WE. et al. Nanotheranostics and image-guided drug delivery: current concepts and future directions. Mol Pharm. 2010;7:1899-912
3. Lammers T, Aime S, Hennink WE. et al. Theranostic Nanomedicines. Acc Chem Res. 2011;44:1029-38
4. Kateb B, Chiu K, Black KL. et al. Nanoplatforms for constructing new approaches to cancer treatment, imaging, and drug delivery: what should be the policy? Neuroimage. 2011;54(Suppl 1):S106-S124
5. Roach MIII, Alberini JL, Pecking AP. et al. Diagnostic and therapeutic imaging for cancer: therapeutic considerations and future directions. J Surg Oncol. 2011;103:587-601
6. Fernald GH, Capriotti E, Daneshjou R. et al. Bioinformatics Challenges for Personalized Medicine. Bioinformatics. 2011;27:1741-8
7. Nielsen PE, Egholm M, Berg RH. et al. Sequence-selective recognition of DNA by strand displacement with a thymine-substituted polyamide. Science. 1991;254:1497-500
8. Demidov VV, Potaman VN, Frank Kamenetskii MD. et al. Stability of peptide nucleic acids in human serum and cellular extracts. Biochem Pharmacol. 1994;48:1310-3
9. Christensen L, Fitzpatrick R, Gildea B. et al. Solid-phase synthesis of peptide nucleic acids. J Pept Sci. 1995;1:175-83
10. Nielsen PE. Peptide nucleic acid: a versatile tool in genetic diagnostics and molecular biology. Curr Opin Biotechnol. 2001;12:16-20
11. Braun K, Peschke P, Pipkorn R. et al. A biological transporter for the delivery of peptide nucleic acids (PNAs) to the nuclear compartment of living cells. J Mol Biol. 2002;318:237-43
12. Koppelhus U, Nielsen PE. Cellular delivery of peptide nucleic acid (PNA). Adv Drug Deliv Rev. 2003;55:267-80
13. Kilk K, Langel U. Cellular delivery of peptide nucleic acid by cell-penetrating peptides. Methods Mol Biol. 2005;298:131-41
14. 14. Joergensen M, Agerholm-Larsen B, Nielsen PE, et al. Efficiency of cellular delivery of antisense peptide nucleic acid by electroporation depends on charge and electroporation geometry. Oligonucleotides. 2011;21:29-37
15. Vives E, Brodin P, Lebleu B. A truncated HIV-1 Tat protein basic domain rapidly translocates through the plasma membrane and accumulates in the cell nucleus. J Biol Chem. 1997;272:16010-7
16. Vives E, Richard JP, Rispal C. et al. TAT peptide internalization: Seeking the mechanism of entry. Current Protein & Peptide Science. 2003;4:125-32
17. Schwarze SR, Hruska KA, Dowdy SF. Protein transduction: unrestricted delivery into all cells? Tr Cell Biol. 2000;10:290-5
18. Derossi D, Joliot AH, Chassaing G. et al. The third helix of the Antennapedia homeodomain translocates through biological membranes. J Biol Chem. 1994;269:10444-50
19. Perez F, Joliot A, Bloch Gallego E. et al. Antennapedia homeobox as a signal for the cellular internalization and nuclear addressing of a small exogenous peptide. J Cell Sci. 1992;102:717-22
20. Sharma A, Madhunapantula SV, Robertson GP. Toxicological considerations when creating nanoparticle-based drugs and drug delivery systems. Expert Opin Drug Metab Toxicol. 2012;8:47-69
21. Braun K, Pipkorn R, Waldeck W. Development and Characterization of Drug Delivery systems for Targeting Mammalian Cells and Tissues: A Review. Curr Med Chem. 2005;12:1841-58
22. Prochiantz A. Antennapedia Homeobox Peptide Regulates Neural Morphogenesis. M S-Medecine Sciences. 1991;7:508
23. Lindgren M, Hallbrink M, Prochiantz A. et al. Cell-penetrating peptides. Trends Pharmacol Sci. 2000;21:99-103
24. Lundberg P, Langel U. A brief introduction to cell-penetrating peptides. Journal of Molecular Recognition. 2003;16:227-33
25. Pooga M, Soomets U, Bartfai T. et al. Synthesis of cell-penetrating peptide-PNA constructs. Methods Mol Biol. 2002;208:225-36
26. Langel U, Pooga M, Bartfai T. Cell Penetrating PNA Constructs. J Neurochem. 1997;69:S260
27. Holm T, Andaloussi SE, Langel U. Comparison of CPP uptake methods. Methods Mol Biol. 2011;683:207-17
28. Kalderon D, Roberts BL, Richardson WD. et al. A short amino acid sequence able to specify nuclear location. Cell. 1984;39:499-509
29. Escriou V, Carriere M, Scherman D. et al. NLS bioconjugates for targeting therapeutic genes to the nucleus. Adv Drug Deliv Rev. 2003;55:295-306
30. Jans DA, Xiao CY, Lam MHC. Nuclear targeting signal recognition: a key control point in nuclear transport? Bioessays. 2000;22:532-44
31. Gorlich D, Mattaj IW. Nucleocytoplasmic transport. Science. 1996;271:1513-8
32. Pipkorn R, Waldeck W, Spring H. et al. Delivery of substances and their target-specific topical activation. Biochim Biophys Acta. 2006;1758:606-10
33. Pipkorn R, Wiessler M, Waldeck W. et al. Improved Synthesis Strategy for Peptide Nucleic Acids (PNA) appropriate for Cell-specific Fluorescence Imaging. Int J Med Sci. 2012;9:1-10
34. Keppler D, Sameni M, Moin K. et al. Tumor progression and angiogenesis: cathepsin B & Co. Biochem Cell Biol. 1996;74:799-810
35. Strojnik T, Zajc I, Bervar A. et al. Cathepsin B and its inhibitor stefin A in brain tumors. Pflugers Arch. 2000;439:R122-R123
36. Derossi D, Chassaing G, Prochiantz A. Trojan peptides: the penetratin system for intracellular delivery. Tr Cell Biol. 1998;8:84-7
37. Joliot AH, Triller A, Volovitch M. et al. alpha-2,8-Polysialic acid is the neuronal surface receptor of antennapedia homeobox peptide. New Biol. 1991;3:1121-34
38. Derossi D, Calvet S, Trembleau A. et al. Cell internalization of the third helix of the Antennapedia homeodomain is receptor-independent. J Biol Chem. 1996;271:18188-93
39. Prochiantz A. Messenger proteins: homeoproteins, TAT and others. Curr Opin Cell Biol. 2000;12:400-6
40. Friend DR, Pangburn S. Site-specific drug delivery. Med Res Rev. 1987;7:53-106
41. Boulikas T. Nuclear localization signals (NLS). Crit Rev Eukaryot Gene Expr. 1993;3:193-227
42. Boulikas T. Putative nuclear localization signals (NLS) in protein transcription factors. J Cell Biochem. 1994;55:32-58
43. Duverger E, Pellerin Mendes C, Mayer R. et al. Nuclear import of glycoconjugates is distinct from the classical NLS pathway. J Cell Sci. 1995;108:1325-32
44. Floer M, Blobel G. The nuclear transport factor karyopherin beta binds stoichiometrically to Ran-GTP and inhibits the Ran GTPase activating protein. J Biol Chem. 1996;271:5313-6
45. Schlenstedt G. Protein import into the nucleus. FEBS Lett. 1996;389:75-9
46. Rolland A. Nuclear gene delivery: the Trojan horse approach. Expert Opin Drug Deliv. 2006;3:1-10
47. Zamecnik PC, Stephenson ML. Inhibition of Rous sarcoma virus replication and cell transformation by a specific oligodeoxynucleotide. Proc Natl Acad Sci U S A. 1978;75:280-4
48. Stephenson ML, Zamecnik PC. Inhibition of Rous sarcoma viral RNA translation by a specific oligodeoxyribonucleotide. Proc Natl Acad Sci U S A. 1978;75:285-8
49. Toulme JJ, Helene C. Antimessenger oligodeoxyribonucleotides: an alternative to antisense RNA for artificial regulation of gene expression--a review. Gene. 1988;72:51-8
50. Crooke ST. Antisense technology. Curr Opin Biotechnol. 1991;2:282-7
51. Cohen JS. Oligonucleotides as therapeutic agents. Pharmacol Ther. 1991;52:211-25
52. Helene C, Giovannangeli C, Guieysse Peugeot AL. et al. Sequence-specific control of gene expression by antigene and clamp oligonucleotides. Ciba Found Symp. 1997;209:94-102
53. Constancia M, Pickard B, Kelsey G. et al. Imprinting mechanisms. Genome Res. 1998;8:881-900
54. Wachsmuth M. Fluoreszenzfluktuationsmikroskopie: Entwicklung eines Prototypes, Theorie und Messung der Beweglichkeit von Biomolekülen im Zellkern. Ruprecht-Karls-Universität Heidelberg. 2001
55. Haustein E, Schwille P. Ultrasensitive investigations of biological systems by fluorescence correlation spectroscopy. Methods. 2003;29:153-66
56. Wachsmuth M, Weidemann T, Muller G. et al. Analyzing intracellular binding and diffusion with continuous fluorescence photobleaching. Biophys J. 2003;84:3353-63
57. Merriefield RB. Solid Phase Peptide Synthesis. I The Synthesis of a Tetrapeptide. J Americ Chem Soc. 1963;85:2149-54
58. Carpino LA, Han GY. The 9-Fluorenylmethoxycarbonyl Amino-Protecting Group. J ORG CHEM. 1972;37:3404-9
59. Nokihara K, Yamamoto S, Toda C, Wang J. Development of a simple and low cost manual synthesizer for chemical library construction. Kyoto, Japan: The Japanese Peptide Society. 2002:61-4
60. Petrasek Z, Schwille P. Precise measurement of diffusion coefficients using scanning fluorescence correlation spectroscopy. Biophys J. 2008;94:1437-48
61. Loman A, Dertinger T, Koberling F. et al. Comparison of optical saturation effects in conventional and dual-focus fluorescence correlation spectroscopy. Chemical Physics Letters. 2008;459:18-21
62. Gendron PO, Avaltroni F, Wilkinson KJ. Diffusion coefficients of several rhodamine derivatives as determined by pulsed field gradient-nuclear magnetic resonance and fluorescence correlation spectroscopy. J Fluoresc. 2008;18:1093-101
63. Crombez L, Aldrian-Herrada G, Konate K. et al. A new potent secondary amphipathic cell-penetrating peptide for siRNA delivery into mammalian cells. Mol Ther. 2009;17:95-103
64. Magzoub M, Graslund A. Cell-penetrating peptides: small from inception to application. Q Rev Biophys. 2004;37:147-95
65. Holm T, Johansson H, Lundberg P. et al. Studying the uptake of cell-penetrating peptides. Nat Protoc. 2006;1:1001-5
66. Alves ID, Jiao CY, Aubry S. et al. Cell biology meets biophysics to unveil the different mechanisms of penetratin internalization in cells. Biochim Biophys Acta. 2010;1798:2231-9
67. Lindgren M, Gallet X, Soomets U. et al. Translocation properties of novel cell penetrating transportan and penetratin analogues. Bioconjug Chem. 2000;11:619-26
68. Richard JP, Melikov K, Vives E. et al. Cell-penetrating peptides: A re-evaluation of the mechanism of cellular uptake. J Biol Chem. 2002;278:585-90
69. Vives E. Cellular uptake of the Tat peptide: an endocytosis mechanism following ionic interactions. Journal of Molecular Recognition. 2003;16:265-71
70. Joliot A, Prochiantz A. Transduction peptides: from technology to physiology. Nature Cell Biology. 2004;6:189-96
71. Kratz F. Drug conjugates with albumin and transferrin. Expert Opin Ther Patents. 2002;12:433-9
72. Marty JJ, Oppenheim RC, Speiser P. Nanoparticles--a new colloidal drug delivery system. Pharm Acta Helv. 1978;53:17-23
73. Robinson JR. Sustained and controlled release drug delivery systems. In: (ed.) Dekker M. Drugs and Pharmaceutical Sciences. New York NY. 1978:773
74. Freeman AI, Mayhew E. Targeted drug delivery. Cancer. 1986;58:573-83
75. Leserman L, Machy P, Leonetti JP. et al. Targeted liposomes and intracellular delivery of macromolecules. Prog Clin Biol Res. 1990;343:95-102
76. Ledley FD. Nonviral gene therapy: the promise of genes as pharmaceutical products. Hum Gene Ther. 1995;6:1129-44
77. Storm G, Crommelin DJA. Colloidal systems for tumor targeting. Hybridoma. 1997;16:119-25
78. Stehle G, Heene DL, Wunder A. et al. Direct convective macromolecule delivery. J Neurosurg. 1999;90:610-1
79. Lammers T, Hennink WE, Storm G. Tumour-targeted nanomedicines: principles and practice. Br J Cancer. 2008;99:392-7
80. Heckl S, Debus J, Jenne J. et al. CNN-Gd(3+) Enables Cell Nucleus Molecular Imaging of Prostate Cancer Cells: The Last 600 nm. Cancer Res. 2002;62:7018-24
81. Podgorski I, Sloane BF. Cathepsin B and its role(s) in cancer progression. Biochem Soc Symp. 2003:263-76
82. Sloane BF, Moin K, Krepela E. et al. Cathepsin B and its endogenous inhibitors: the role in tumor malignancy. Cancer Metastasis Rev. 1990;9:333-52
83. Golaszewski Z, Gacko M, Chyczewska E. et al. Proteolytic enzymes in proliferation and neoplastic metastases formation. Rocz Akad Med Bialymst. 1997;42(Suppl 1):48-59
84. Friedrich B, Jung K, Lein M. et al. Cathepsins B, H, L and cysteine protease inhibitors in malignant prostate cell lines, primary cultured prostatic cells and prostatic tissue. Eur J Cancer. 1999;35:138-44
85. Berquin IM, Sloane BF. Cathepsin B expression in human tumors. Adv Exp Med Biol. 1996;389:281-94
86. Chan AT, Baba Y, Shima K. et al. Cathepsin B expression and survival in colon cancer: implications for molecular detection of neoplasia. Cancer Epidemiol Biomarkers Prev. 2010;19:2777-85
87. Kim DE, Kim JY, Schellingerhout D. et al. Molecular imaging of cathepsin B proteolytic enzyme activity reflects the inflammatory component of atherosclerotic pathology and can quantitatively demonstrate the antiatherosclerotic therapeutic effects of atorvastatin and glucosamine. Mol Imaging. 2009;8:291-301
88. Kircher MF, Josephson L, Weissleder R. Ratio imaging of enzyme activity using dual wavelength optical reporters. Mol Imaging. 2002;1:89-95
89. Bremer C, Tung CH, Bogdanov AJr. et al. Imaging of differential protease expression in breast cancers for detection of aggressive tumor phenotypes. Radiology. 2002;222:814-8
90. Ntziachristos V, Bremer C, Tung C. et al. Imaging cathepsin B up-regulation in HT-1080 tumor models using fluorescence-mediated molecular tomography (FMT). Acad Radiol. 2002;9(Suppl 2):S323-S325
91. Heckl S, Debus J, Jenne J. et al. Novel Delivery System for Gadolinium enables rapid and specific cellular uptake into tumor cells. Proc Intl Soc Mag Reson Med. 2002:1
92. Buchanan JD, Cowburn RP, Jausovec AV. et al. Forgery: 'fingerprinting' documents and packaging. Nature. 2005;436:475
93. Boas DA, Dunn AK. Laser speckle contrast imaging in biomedical optics. J Biomed Opt. 2010;15:011109
94. Braun K, Wiessler M, Pipkorn R. et al. A cyclic-RGD-BioShuttle functionalized with TMZ by DARinv "Click Chemistry" targeted to alphavbeta3 integrin for therapy. Int J Med Sci. 2010;7:326-39
95. Braun K, Dunsch L, Pipkorn R. et al. Gain of a 500-fold sensitivity on an intravital MR contrast agent based on an endohedral gadolinium-cluster-fullerene-conjugate: a new chance in cancer diagnostics. Int J Med Sci. 2010;7:136-46
96. Keating TJ, Borisy GG. Speckle microscopy: when less is more. Curr Biol. 2000;10:R22-R24
97. Jacques SL, Kirkpatrick SJ. Acoustically modulated speckle imaging of biological tissues. Opt Lett. 1998;23:879-81
Author contact
![]() Corresponding author: Klaus Braun, Ph.D. German Cancer Research Center (DKFZ), Dept. of Imaging and Radiooncology, Im Neuenheimer Feld 280, D-69120 Heidelberg, Germany. Phone: +49 6221-42 2495 Fax: +49 6221-42 3326 e-mail: k.braunde.
Corresponding author: Klaus Braun, Ph.D. German Cancer Research Center (DKFZ), Dept. of Imaging and Radiooncology, Im Neuenheimer Feld 280, D-69120 Heidelberg, Germany. Phone: +49 6221-42 2495 Fax: +49 6221-42 3326 e-mail: k.braunde.