Impact Factor ISSN: 1449-1907

 Global reach, higher impact
Int J Med Sci 2012; 9(5):334-338. doi:10.7150/ijms.4553 This issue Cite
Research Paper
Expression of Glioma-associated Oncogene Homolog 1 is Associated with Invasion and Postoperative Liver Metastasis in Colon Cancer
Yin-lu Ding1, Yong Zhou1, Lei Xiang2, Zhi-peng Ji1 ![]() , Zhou-hong Luo3
, Zhou-hong Luo3 ![]()
1. Department of General Surgery, the Second Hospital of Shandong University, Jinan , Shandong 250033, P.R. China.
2. Department of Pathology, School of Medicine, Shandong University, Jinan, Shandong 250012, P.R. China.
3. Laboratory of Electrocardiology, The Tumor Hospital of Xinjiang Medical University, Xinjiang 830000, P.R. China.
Received 2012-5-3; Accepted 2012-6-12; Published 2012-6-21
Abstract
Objective: To investigate the expression of glioma-associated oncogene homolog 1(Gli-1) in colon cancer and its association with clinicopathological parameters and postoperative liver metastasis.
Methods: Expression of Gli-1 was detected by immunohistochemistry in paraffin-embedded specimens of 96 cases of colon cancer. Relationship between Gli-1 expression and clinicopathological parameters, postoperative liver metastasis were analyzed.
Results: Gli-1 protein expression was significantly increased in colon cancer tissues compared to normal colon tissues (P = 0.037). Gli-1 expression in colon tissues was increased in patients with lymph node metastases (P = 0.022) and higher T stages (P = 0.030). Postoperative live metastasis-free survival period was significantly longer in low Gli-1 expression group than that of high Gli-1 expression group (48.22±10.03 months vs 20.46±6.32 months, P=0.001). Multivariate analysis showed that Gli-1 expression level is an independent prognostic factor for postoperative live metastasis-free survival.
Conclusion: Colon cancer is associated with an upregulation of Gli-1 protein expression in colon tissues. In patients with colon cancer, Gli-1 expression level is closely related to lymph node metastases, T stages and postoperative live metastasis-free survival periods, indicative of a possible role of Gli-1 expression in colon cancer progression.
Keywords: Colon neoplasm, Glioma-associated oncogene 1, Liver metastasis.
Introduction
Colon cancer is one of the most common human malignancies and a major cause of cancer related death worldwide [1]. The major cause of death from colon cancer is liver metastasis, which is usually resistant to conventional therapies [2]. 35%-55% of patients with colon cancer will develop liver metastases during the course of illness. Survival following hepatic resection of colorectal metastasis now approaches 35%-50%. However, the recurrence rate in 5 years is as high as approximately 65% [3]. To date, the precise mechanisms leading to liver metastasis in colon cancer remains unknown, and biomarkers for liver metastasis are still lacking.
The hedgehog (Hh) signaling pathway is known to play essential roles in multiple aspects of embryonic development. Dysregulation in Hh signaling has been implicated in the pathogenesis of a variety of human tumors including tumors of skin, cerebellum, muscle, lung, digestive tract, pancreas and prostate [4-9]. Furthermore, the activation of the Hh signaling pathway is associated with the malignancy of tumors and their progression to metastatic stages [10,11]. Glioma-associated oncogene homolog 1(Gli-1) protein is a component in Hh signaling pathway, which functions as an activator of transcription [12, 13]. Cyclin D2 and FOXM1 have been identified as the downstream target genes of Gli-1 in basal cell carcinomas [14, 15]. Accumulating evidences have shown that Gli-1 is involved in tumor progression [16, 17].
The aim of the present study is to explore the potential role of Gli-1 in colon cancer development. For this purpose, Gli-1 protein expression was detected in colon cancer and normal colon tissues by immunohistochemistry using tissue microarray. In addition, the correlation of Gli-1 protein expression with the clinicopathological data and prognostic variables was analyzed.
Materials and methods
Patients and Tissue samples
Tissue samples were collected from patients with colon cancer who underwent surgical operation in the Second Hospital of Shandong University from July 2002 to December 2007. Formalin-fixed and paraffin-embedded tissue specimens from 96 patients with colon cancer were included. All patients received no chemotherapy and/or other therapies before surgical operation. Table 1 presents the clinicopathological data of the 96 patients. All hematoxylin and eosin (H&E)-stained slides for each patient were reviewed by two pathologists. Clinical and pathological classification and staging were determined according to the American Joint Committee on Cancer criteria [18]. The study protocol was approved by the ethics committee of Shandong University. Written informed consent was obtained from each participant before data collection.
Clinicopathological parameters in relation to nuclear Gli-1 immunoreactivity.
| Variable | Categorization | Patients n(%) | GLi-1 expressiona | P valueb | |
|---|---|---|---|---|---|
| high | low | ||||
| Gender | |||||
| male | 60 | 44 | 16 | ||
| female | 36 | 32 | 4 | 0.354 | |
| Age | |||||
| ≥60 | 50 | 36 | 14 | ||
| <60 | 46 | 40 | 6 | 0.402 | |
| Tumour size | |||||
| ≥5cm | 42 | 30 | 12 | ||
| <5cm | 54 | 46 | 8 | 0.086 | |
| Tumour grade (WHO) | |||||
| G1+G2 | 64 | 48 | 16 | ||
| G3+G4 | 32 | 28 | 4 | 0.958 | |
| Lymph node status | |||||
| N+ | 51 | 49 | 2 | ||
| N0 | 45 | 27 | 18 | 0.022 | |
| T stages | |||||
| T2 | 30 | 21 | 9 | ||
| T3 | 45 | 34 | 11 | ||
| T4 | 21 | 19 | 2 | 0.030 | |
aGLi-1 expression, high means IRS≥6 and low means IRS<6
bP values were evaluated by chi-square test or the Fisher's exact test
Tissue microarray (TMA)
For each H&E-stained slide, two representative areas were selected and the corresponding spots were marked on the surface of the paraffin block. Using a tissue microarray punching instrument, the selected areas were punched out and were placed into the recipient block side by side. Each tissue core was 2 mm in diameter and was assigned with a unique tissue microarray location number that was linked to a database containing other clinicopathological data.
Immunohistochemistry (IHC)
The expression of Gli-1 was detected by streptavidin-peroxidase-biotin (SP) immunohistochemical method. In brief, paraffin-embedded specimens were cut into 4μm sections and baked at 60°C for 60 min. The sections were deparaffinized with xylenes and rehydrated. Then sections were submerged into EDTA antigenic retrieval buffer in a pressure cooker for 10 minutes and then cooled at room temperature for 20 minutes. The sections were treated with 3% hydrogen peroxide in methanol to quench the endogenous peroxidase activity, followed by incubation with normal serum to block nonspecific binding. The sections were incubated with Gli-1 monoclonal antibody (1:50; Santa Cruz; sc-20687, CA) overnight at 4°C. After washing, the tissue sections were incubated with biotinylated secondary antibody (Maixin Biotechnology Company, Fuzhou, China) for 1h at room temperature, followed by incubation with streptavidin-horseradish peroxidase for 20 minutes. After washing with PBS, diaminobenzidine (DAB) was added for visualization. The sections were counterstained with haematoxylin. For negative controls, the anti-Gli-1 antibody was replaced with PBS.
Evaluation of Immunohistochemical Staining
The stained slides were reviewed and scored independently by two observers blinded to the patients' information. Gli-1 protein expression was evaluated using the Immuno-Reactive-Score (IRS) system (combining positive cell ratio and staining intensity) as suggested by Remmele and Stegner [19]. Staining intensity was graded according to the following criteria: 0 (-, no staining); 1 (+, weak staining= light yellow); 2 (++, moderate staining = yellow brown) and 3 (+++, strong staining = brown). IRS is the product of staining intensity and the percentage of positively stained cells (graded between 0 and 4, being 1 = <25%, 2 = 25%-50%; 3 = 51%-75%, and 4 = >75%, respectively). Cases with discrepancies in IRS score were discussed together with other pathologists until consensus was reached.
Statistical Analysis
Analyses were performed using the statistical software package SPSS 13.0 (SPSS, Chicago, IL, USA). A two-sided Fisher's exact test or Χ2 test was performed to analyze possible associations between Gli-1 expression and clinical parameters. The cumulative survival time was computed using the Kaplan-Meier method and compared by the log-rank test. Multivariate analyses were based on the Cox proportional hazards regression model. P < 0.05 was considered statistically significant.
Results
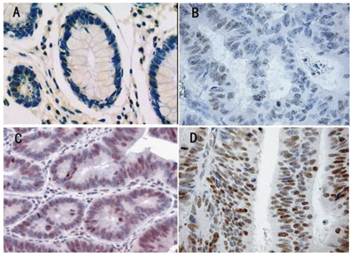
Gli-1 protein expression and localization was studied on a large TMA including normal (n = 26) and tumorous colon tissues (n = 96). Gli-1 staining was detectable in both the cytoplasm and the nucleus of benign and malignant colon epithelial cells. However, nuclear expression was more abundant, and as Gli-1 is a transcription factor, nuclear Gli-1 expression was scored for subsequent data analyses and correlation studies. In the nucleus of normal colon tissues (Figure 1A), Gli-1 protein expression was less abundant (median IRS =4) than in the nucleus of colon cancer cells (median IRS = 8) (P = 0.037). In the cells of the colon cancer, Gli-1 expression was present in different intensities and different cell distributions. Following the staging criteria of stain intensity, no cases were identified as completely negative, 10 cases (10.4%) were identified as “+” (Figure 1B), 22 cases (23.0%) were identified as “++” (Figure 1C), and 64 cases (66.7%) were identified as “+++” (Figure 1D). We evaluated Gli-1 protein expression in colon cancer cells by determining the IRS, with scores of 1, 2, 3, 4, 6, 8, 9 or 12. The optimal cutoff value for high and low expression level was identified: an IRS score of ≥ 6 was used to define tumors with high expression of Gli-1, and an IRS score of <6 was used to indicate low expression. The high level (IRS≧6), low level (IRS<6) expression of Gli-1 in colon cancer was observed in 76 cases (79.2%) and 20 cases (20.8%), respectively.
Immunohistochemical expression analysis of GLi-1 protein in normal colon tissue, and colon tumours using a TMA(SP, 200×). (A) normal colon tissue, Gli-1 negative. (B) colon cancer tissue, Gli-1 positive + , the staining is weak. (C) colon cancer tissue, Gli-1 positive ++ , the staining is moderate. (D) Colon cancer tissue, Gli-1 positive ++ +, the staining is strong.
There was no significant correlation between the expression level of Gli-1 and biological factors such as patients' age (P=0.402), gender (P=0.354), tumor size (P = 0.086), Tumor grade (P = 0.958). In contrast, statistical analyses indicated that Gli-1 expression was positively related to lymph node status, T stages and the correlation was statistically significant (P= 0.022/0.030, respectively). The results of these analyses are summarized in Table 1.
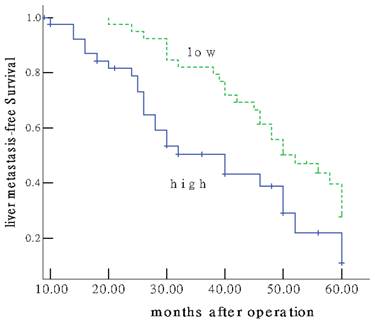
Of the 96 patients with colon cancer, none was lost to follow-up. The median observation period was 38.4 months (ranged, 5.6-60.0 months), with 62 postoperative live metastases. The median postoperative live metastasis-free survival was 30.27±8.99 months. To answer the question whether Gli-1 overexpression might have an impact on patients' clinical outcome. Univariate survival probability curves were calculated based on the immunohistochemical results. Using Kaplan-Meier analysis we found that postoperative live metastasis-free survival in the group of low Gli-1 expression was significantly longer than that of high expression (48.22±10.03 vs 20.46±6.32 months, P=0.001) (Figure 2). Multivariate analysis showed Gli-1 expression status was evaluated as an independent prognostic factor for postoperative live metastasis-free survival (P = 0.002).
Colon cancer patients expressing high GLi-1 protein (IRS≥6) show unfavourable prognosis. Univariate Kaplan-Meier analysis was performed on the basis of GLi-1 expression results derived from the TMA. Patients with low GLi-1 expression(IRS<6) displayed longer liver metastasis-free survival estimation (upper graph) compared to patients with high nuclear GLi-1 expression (lower graph) (P =0.001).
Discussion
Gli-1, which is located on chromosome 12q13.2-q13.3, was initially identified as an amplified gene in a human malignant glioma [12]. Gli-1 and the other two members of the Gli family, namely, Gli-2 and Gli3, are the nuclear mediators of the Shh signaling pathway that plays an essential role in the regulation of early development of central nervous system [20]. For example, the Shh-Gli-1 pathway is required for the differentiation of the floor cell and ventral neurons in the neural tube, granule cell precursor proliferation in the cerebellum, and dorsal brain growth [21-23]. Besides its role in normal development, Shh-Gli-1 pathway has been implicated in tumorigenesis, [20, 24-26]. There has been evidence showing that dysregulation of Shh-Gli-1 pathway is associated with the development of oesophageal squamous cell carcinomas, basal cell carcinomas and brain tumors [17,27,28].
In the present study, we examined the Gli-1 expression in paraffin-embedded tumor samples using the IHC method with the monoclonal antibody. Our results showed that Gli-1 is in the cytoplasm and nucleus of cells as the product leaflet of the antibody indicates. Previous studies by Yoshikawa et al [29] and Mori et al [17] have demonstrated that nuclear staining pattern of Gli-1 in cancer cells is associated with early recurrence and poor prognosis. Therefore, in the present study, the evaluation of Gli-1 expression by the Immuno-Reactive-Score (IRS) system was based on the nuclear staining.
Abberant Gli-1 expression has been implicated in a variety of solid tumors. ten Haaf A et al [30] studied Gli-1 expression in paraffin-embedded breast cancer samples and showed that increased Gli-1 expression is correlated with unfavorable overall survival, higher tumour stage and an increased number of tumour-positive axillar lymph node. Similarly, Zhu W et al [31] reported that Gli-1 expression is correlated with large tumor size, locoregional progression and poor locoregional progression-free survival, distant progression-free survival and overall survival in esophageal squamous cell carcinomas. In patients with head and neck squamous cell carcinoma, high Gli-1 expression was also found to be associated with poorer outcomes and higher TNM stages [32].
In the present study, high Gli-1 expression (IRS≥6) in the colon cancer tissues was detected in 76% of the patients. Furthermore, Gli-1 expression level is correlated with lymph node metastasis (P = 0.042) and T status (P = 0.030), which suggests that Gli-1 may have some correlation with worse biological behavior and clinical aggressiveness. Our findings are consistent with the results of a previous study by Xu M et al [33].
The molecular mechanism underlying liver metastasis in colon cancer is unclear. Traditional clinicopathological parameters including the depth of invasion, the presence of venous invasion, and lymph node metastasis, have limited prognostic values [34]. Other variables, such as CD10, CD44, VEGF, TGF-a and the density of macrophages in the invasive front have been shown to be correlated with liver metastasis, however the predictive efficacy of these factors remains uncertain [35]. In the present study, postoperative live metastasis-free survival in the group of low Gli-1 expression was significantly longer than that of high expression (P=0.001). Furthermore, result of multivariate analysis demonstrated that Gli-1 expression was an independent prognostic factor for postoperative live metastasis-free survival. To our knowledge, this is the first report of the relationship between Hh signaling pathway and postoperative live metastasis. These findings suggested that the abberant expression of Gli-1 might contribute to the development of colon cancer and postoperative liver metastasis.
Conclusion
In the present study, we demonstrated Gli-1 expression is upregulated in colon cancer cells. Furthermore, the Gli-1 level in colon cancer cells is correlated with lymph node metastasis, T stage, postoperative liver metastasis-free survival. These findings suggested abberant Gli-1 expression may play a role in the pathogenesis of colon cancer, and raised the possibility of using Gli-1 as a prognostic marker for poor liver metastasis-free survival in patients with colon cancer.
Acknowledgements
This study was supported by Independent Innovation Foundation of Shandong University, China (IIFSDU, Grant No. 2010TS009). We would like to appreciate Dr. Yuan-tao Liu for critical reading of the manuscript.
Competing Interests
The authors have declared that no competing interest exists.
References
1. Jemal A, Siegel R, Xu J. et al. Cancer statistics, 2010. CA Cancer J Clin. 2010;60:277-300
2. Fidler IJ. Critical factors in the biology of human cancer metastasis: twenty-eight GHA Clowes Memorial Award Lecture. Cancer Res. 1990;50:6130-6138
3. Mayo SC, Pawlik TM. Current management of colorectal hepatic metastasis. Expert Rev Gastroenterol Hepatol. 2009;3:131-144
4. Berman DM, Karhadkar SS, Maitra A. et al. Widespread requirement for Hedgehog ligand stimulation in growth of digestive tract tumours. Nature. 2003;425:846-851
5. Cowan R, Hoban P, Kelsey A. et al. The gene for the naevoid basal cell carcinoma syndrome acts as a tumour-suppressor gene in medulloblastoma. Br J Cancer. 1997;76:141-145
6. Johnson RL, Rothman AL, Xie J. et al. Human homolog of patched, a candidate gene for the basal cell nevus syndrome. Science. 1996;272:1668-1671
7. Karhadkar SS, Bova GS, Abdallah N. et al. Hedgehog signalling in prostate regeneration, neoplasia and metastasis. Nature. 2004;431:707-712
8. Thayer SP, di Magliano MP, Heiser PW. et al. Hedgehog is an early and late mediator of pancreatic cancer tumorigenesis. Nature. 2003;425:851-856
9. Watkins DN, Berman DM, Burkholder SG. et al. Hedgehog signalling within airway epithelial progenitors and in small-cell lung cancer. Nature. 2003;422:313-317
10. Stecca B, Mas C, Clement V. et al. Melanomas require HEDGEHOG-GLI signaling regulated by interactions between GLI1 and the RAS-MEK/AKT pathways. Proc Natl Acad Sci USA. 2007;104:5895-5900
11. Yoo YA, Kang MH, Kim JS. et al. Sonic hedgehog signaling promotes motility and invasiveness of gastric cancer cells through TGF-beta-mediated activation of the ALK5-Smad 3 pathway. Carcinogenesis. 2008;29:480-490
12. Kinzler KW, Bigner SH, Bigner DD. et al. Identification of an amplified, highly expressed gene in a human glioma. Science. 1987;236:70-73
13. Jacob J, Briscoe J. Gli proteins and the control of spinal-cord patterning. EMBO Rep. 2003;4:761-765
14. Teh MT, Wong ST, Neill GW. et al. FOXM1 is a downstream target of Gli1 in basal cell carcinomas. Cancer Res. 2002;62:4773-4780
15. Yoon JW, Kita Y, Frank DJ. et al. Gene expression profiling leads to identification of GLI1-binding elements in target genes and a role for multiple downstream pathways in GLI1-induced cell transformation. Journal of Biological Chemistry. 2002;277:5548-5555
16. Dahmane N, Lee J, Robins P. et al. Activation of the transcription factor Gli1 and the Sonic hedgehog signalling pathway in skin tumors. Nature. 1997;389:876-881
17. Mori Y, Okumura T, Tsunoda S. et al. Gli-1 expression is associated with lymph node metastasis and tumor progression in esophageal squamous cell carcinoma. Oncology. 2006;70:378-389
18. Edge SBB, Compton CC, Fritz AG. et al. AJCC Cancer Staging Manual (7th Edition). New York: Springer. 2010
19. Remmele W, Stegner HE. Recommendation for uniform definition of an immunoreactive score (IRS) for immunohistochemical estrogen receptor detection (ER-ICA) in breast cancer tissue. Pathologe. 1987;8:138-140
20. Dahmane N, Sánchez P, Gitton Y. et al. The Sonic Hedgehog-Gli pathway regulates dorsal brain growth and tumorigenesis. Development. 2001;128:5201-5212
21. Echelard Y, Epstein DJ, St-Jacques B. et al. Sonic hedgehog, a member of a family of putative signaling molecules, is implicated in the regulation of CNS polarity. Cell. 1993;75:1417-1430
22. Roelink H, Augsburger A, Heemskerk J. et al. Floor plate and motor neuron induction by vhh-1, a vertebrate homolog of hedgehog expressed by the notochord. Cell. 1994;76:761-775
23. Dahmane N, Ruiz i Altaba A. Sonic hedgehog regulates the growth and patterning of the cerebellum. Development. 1999;126:3089-3100
24. Clement V, Sanchez P, de Tribolet N. et al. HEDGEHOG-GLI-1 Signaling Regulates Human Glioma Growth, Cancer Stem Cell Self-Renewal, and Tumorigenicity. Curr Biol. 2007;17:165-172
25. Kasper M, Regl G, Frischauf AM. et al. GLI transcription factors: mediators of oncogenic Hedgehog signalling. Eur J Cancer. 2006;42:437-445
26. Xie J. Hedgehog signaling pathway: development of antagonists for cancer therapy. Curr Oncol Rep. 2008;10:107-113
27. Ghali L, Wong ST, Green J. et al. GLi-1 protein is expressed in basal cell carcinomas, outer root sheath keratinocytes and a subpopulation of mesenchymal cells. Normal Human Ski. 1999;113:595-599
28. Altaba A, Stecca B, Sßnchez P. Hedgehog-Gli signaling in brain tumors: stem cells and paradevelopmental programs in cancer. Cancer Letters. 2004;204:145-157
29. Yoshikawa R, Nakano Y, Tao L. et al. Hedgehog signal activation in oesophageal cancer patients undergoing neoadjuvant chemoradiotherapy. Br J Cancer. 2008;98:1670-1674
30. ten Haaf A, Bektas N, von Serenyi S. et al. Expression of the glioma-associated oncogene homolog (GLI) 1 in human breast cancer is associated with unfavourable overall survival. BMC Cancer. 2009;25:298
31. Zhu W, You Z, Li T. et al. Correlation of hedgehog signal activation with chemoradiotherapy sensitivity and survival inesophageal squamous cell carcinomas. Jpn J Clin Oncol. 2011;41:386-393
32. Chung CH, Dignam JJ, Hammond ME. et al. Glioma-associated oncogene family zinc finger 1 expression and metastasis in patients with headand neck squamous cell carcinoma treated with radiation therapy (RTOG 9003). J Clin Oncol. 2011;29:1326- 1334
33. Xu M, Li X, Liu T. et al. Prognostic value of hedgehog signaling pathway in patients with colon cancer. Med Oncol. 2011 doi: 10.1007/s12032-011-9899-7
34. Bird NC, Mangnall D, Majeed AW. Biology of colorectal liver metastases: A review. J Surg Oncol. 2006;94:68-80
35. Zhou Q, Peng RQ, Wu XJ. et al. The density of macrophages in the invasive front is inversely correlated to liver metastasis in colon cancer. Journal of Translational Medicine. 2010;8:13
Author contact
![]() Corresponding author: Zhi-peng Ji or Zhou-hong Luo, E-mail: doctorjzpcom or lzhong09com. Telephone: 0086-531-85875563 Fax: 0086-531-85875563.
Corresponding author: Zhi-peng Ji or Zhou-hong Luo, E-mail: doctorjzpcom or lzhong09com. Telephone: 0086-531-85875563 Fax: 0086-531-85875563.