Impact Factor ISSN: 1449-1907

 Global reach, higher impact
Int J Med Sci 2011; 8(7):628-634. doi:10.7150/ijms.8.628 This issue Cite
Research Paper
Comparison of Nutritional Parameters among Adult and Elderly Hemodialysis Patients
Gülperi Çelik1 ![]() , Bahar Oc2, Inci Kara2, Mümtaz Yılmaz3, Ali Yuceaktas4, Seza Apiliogullari2
, Bahar Oc2, Inci Kara2, Mümtaz Yılmaz3, Ali Yuceaktas4, Seza Apiliogullari2
1. Department Internal Medicine, Division of Nephrology, Faculty of Medicine, Selcuk University, Konya, Turkey.
2. Department of Anesthesia and Intensive Care, Faculty of Medicine, Selcuk University, Konya, Turkey.
3. Department Internal Medicine, Division of Nephrology, Kütahya State Hospital, Kütahya, Turkey.
4. Department of Anesthesia and Intensive Care, Education and Research Hospital, Konya, Turkey.
Received 2011-6-24; Accepted 2011-8-2; Published 2011-10-13
Abstract
Aim: The aim of this study was to compare the nutritional biochemical parameters, prealbumin levels, and bioimpedance analysis parameters of adult and elderly hemodialysis (HD) patients.
Methods: This prospective cross-sectional study included 50 adult HD patients (42.0 % female). Nutritional status was assessed by post-dialysis multifrequency bioimpedance analysis (BIA), serum prealbumin and other nutritional biochemical parameters.
Results: Mean age of patients was 57.4±15.1 years (range: 30-83 years) and mean dialysis duration was 68.3 ± 54.5 months (range: 3-240 months). When the patients were divided into two groups according to age of patients (<65 and ≥65), prealbumin (p=0.003), blood urea nitrogen (BUN) (p=0.000), serum creatinine (p=0.013), albumin (p=0.016), protein catabolic rate per normalized body weight (nPCR) (p=0.001), intracellular water (ICW)/total body weight (0.003) , body fat mass (p00.000), lean body mass (p=0.031), lean dry mass (p=0.001), illness marker (p=0.005), basal metabolism (p=0.007), body mass index (BMI) (p=0.028), body fat mass index (BFMI) (p=0.000), fat free mass index (FFMI) (p=0.040) values were significantly different between the groups. In the elderly patients (age ≥65), body fat mass, illness marker, BMI, BFMI were higher compared to adult patients (age <65). Additionally, in the elderly patients, prealbumin, BUN, creatinine, albumin, nPCR, ICW/ total body weight, lean body weight, lean dry weight, basal metabolism and FFMI were lower than adult patients.
Conclusions: Our results indicate that BFMI were higher, albumin, prealbumin, nPCR and lean body mass and FFMI were lower in elderly patients compared to adults. These results imply that elderly HD patients may be prone sarcopenic obesity and may require special nutritional support.
Keywords: Body composition analysis, bioelectric impedance, lean body mass, intracellular fluid, elderly hemodialysis patients, protein energy malnutrition.
Introduction
Protein energy malnutrition (PEM) is a common finding in geriatric patients and is associated with increased morbidity and mortality (1,2). PEM also affects more than 50% of hemodialysis (HD) patients and is unequivocally associated with morbidity and mortality. Whether related to diminished dietary intake, inflammation, adequacy of dialysis, and socioeconomic factors, or a combination these, patients with evidence of PEM have an increased relative risk of death (between two- and ten-fold, depending on the severity of PEM and the interaction of PEM with other factors (age, anemia and dialysis vintage, etc) (3-9). In the clinical practice, various biochemical parameters including albumin, prealbumin, and bioimpedance analysis (BIA) are used as markers of PEM (10-12).
Plasma proteins are used as indirect markers of PEM (12). Albumin is traditionally used in HD patients for evaluation of nutritional status. However, in these patients, the serum prealbumin provides prognostic value independent of the serum albumin and other established predictors of mortality in this population (3,7). In the older patients, repeated measurement of prealbumin is used to provide an assessment of the adequacy of nutrient intake over time (13). Several studies have advocated the use of serum prealbumin, as a better surrogate of nutritional status in HD patient population (9,14). The National Kidney Foundation Kidney Disease Quality Initiative (KDOQI) guideline has recommended prealbumin (also known as transthyretin) as a useful measure of nutritional status (15). The risk of death was unambiguously increased among individuals with serum prealbumin < 25 mg/dL (3).
BIA has been developed recently for assessing body composition and is considered as an ideal noninvasive technique of body composition analysis as accepted by the National Institutes of Health (NIH, U.S.A.) for nutritional monitoring (11, 16-21). PEM is a result of negative energy balance leading to a reduction of both somatic proteins of fat-free mass (FFM) and of visceral proteins in the elderly patients. In addition, body composition is altered in patients with chronic kidney disease because of protein-energy malnutrition, altered micronutrient status, and variable fluid homeostasis (22,23). Many studies in HD patients have demonstrated that BIA is a widely used and proven method for evaluating patient's body composition (11,24). Body cell mass (BCM), intracellular water (ICW) and ICW/body weight, extracellular water (ECW), total body water (TBW), lean body mass, body fat mass and nutrition index (ECW/ TBW) are some important BIA parameters for assessing nutritional status (11,16,25,26).
To the best of our knowledge, there is no report about PEM using both BIA and biochemical markers in elderly HD patients. The primary aim of this study was to compare the BIA and nutritional biochemical markers in elderly and adult HD patients.
Materials and Methods
This cross-sectional study received approval from the institutional Ethics Committee and all subjects gave written informed consent before participation. Twenty-five consecutive stable outpatient uremic adults aged ≥65 years undergoing HD for at least 3 months were recruited in group E (elderly) (n=25) and 25 consecutive adults aged <65 years were recruited in group A (adult) (n=25). Dialysis treatment consisted of 3 weekly sessions. Dialysis duration was 3 to 5 hours depending on the individual prescription. All patients received an oral diet with a calorie intake of 35 kcal/kg/day and protein intake of 1.2 g/kg/day. Exclusion criteria were acute illness in the last 3 months, recent change in dialysis modality, limb amputation, or presence of arteriovenous fistula in both arms, severe sepsis, shock, multiple organ failure, ongoing enteral or parenteral nutrition and refusal to cooperate in the study.
Dialysis strategies: The dialyses were carried out using a commercially available machine (Fresenius 4008 B device, Fresenius Medical Care, Germany) and a standard bicarbonate dialysate. The characteristics of the sessions were the same for all of the patients. HD patients were treated with synthetic low-flux standard membranes. The dialysis water was derived from a reverse osmosis system (Aqua RO modular, Fresenius Medical Care, Bad Hamburg, Germany) equipped with an endotoxin filter. The quality of dialysis water was regularly checked according to recommended guidelines. The blood flow rate was 250-350 ml/min and the dialysate flow rate was 500 ml/min. Vascular access were arteriovenous fistula in the upper limbs and permanent catheter. The adequacy of dialysis (as measured by Kt/V) was calculated using the single-compartment Daugirdas formula, standard urea removal ratio (URR = 100 (1 − R), where R = post-dialysis urea/pre-dialysis urea) and protein catabolic rate per normalized body weight (nPCR, g/kg/day) using the formula recommended by the Kidney Disease Outcomes Quality Initiative Hemodialysis Adequacy Work Group (27,28).
Patients' demographic information and biochemical determinations were recruited. Peripheral venous blood samples were collected from HD patients just prior to the start of a mid-week dialysis session. Serum total cholesterol, triglyceride, high-density lipoprotein, low-density lipoprotein, albumin, calcium (Ca) and phosphorus (P) were measured using a Roche Integra 400 Autoanalyzer (Roche, USA). Prealbumin and transferrin were measured using a Roche Cobas C 501 Autoanalyzer (Roche, Japan). Complete blood count measurements were performed using a Beckman Coulter HMX Autoanalyzer (Beckman Coulter, USA). Intact parathyroid hormone (PTH) was measured using electrochemiluminescence (Roche E170). C-reactive protein (CRP) was assayed on a Roche Integra 400 using an immunoturbidimetric method.
Impedance measurements were performed using a multifrequency bioelectrical impedance analyzer (MF-BIA; QuadScan 4000, Bodystat with 5, 50,100, 200 kHz, Isle of Man, UK) after mid-week dialysis session. Measurements were carried out on the non-access site of the body in standardized conditions (quiet environment, ambient temperature 22 °C to 24°C after the patient was laying for at least 30 minutes), to remove potential causes of bias (17). With regard to the placement of electrodes, an inner sensing electrode was attached on the dorsal surface of the patients' wrist and an outer source electrode placed on the dorsal surface of the third metacarpal bone, the second pair of electrodes being positioned on the anterior surface of the ankle and the third metatarsal bone, respectively. BIA included body fat, lean body mass, FFM, BCM, TBW, ECW and ICW. The current range of 50-100 kHz displays body fat, body fat mass %, body fat mass index (BFMI), lean body mass and body fat-free mass index (FFMI), basal metabolism, basal metabolism/weight, activity metabolism illness marker (which is a an impedance index for clinical assessment of body cell health status and is a predictor of outcome in seriously ill patients using BIA multifrequency technology impedance values at 5kHz and 200 kHz, independent of weight, age and sex) (29).
Clinical and laboratory data were expressed as the mean ± standard deviation (SD). Differences in the means between the groups were evaluated by unpaired Student's t-test. Data that showed skewed distributions were compared with the Mann-Whitney U-test. Categorical data were compared between the groups by the chi-square test. Correlations were evaluated by the Pearson correlation test. p <0.05 was considered as significant.
Results
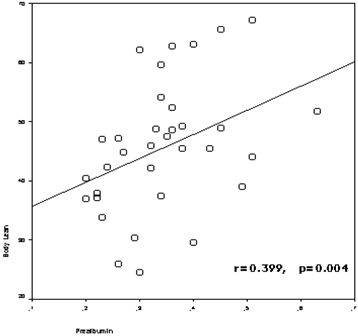
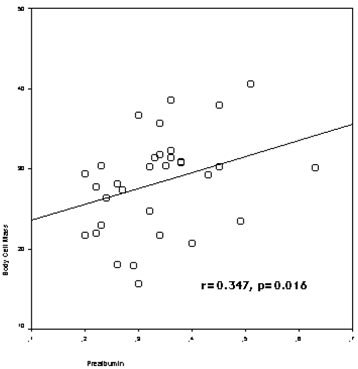
The study included 50 HD patients (42.0 % female), with a mean of 57.4±15.1 years (range: 30-83 years) and a mean HD duration of 68.3 ± 54.5 months (range: 3-240 months). The patients divided into two groups according to age of patients (age<65 and age≥65), and demographic clinical characteristics of the groups were presented in Table 1. Prealbumin levels correlated with age (r=-0.510, p=0.000), nPCR (r=0.569, p=0.000), body fat mass (r=-0.289, p=0.042), lean body mass (r=0.399,p=0.004) (figure 1), lean dry mass (r=0.578, p=0.000), ICW (r=0.320, p=0.040), body cell mass (r=0.347, p=0.016) (figure 2), nutrition index (ECW/TBW ratio) (r=-0.477, p=0.001), illness marker (r=-0.387, p=0.007) and BFMI (r=-0.321, p=0.023).
Demographic and clinical characteristics of hemodialysis patients.
| Parameters | Age < 65 | Age ≥ 65 |
|---|---|---|
| Age (year) (mean± SD) | 48.6±9.9 | 74.0±6.2 |
| Female / Male (%) | 24.0 / 38.0 | 18.0 / 20 |
| Diabetes (%) | 10.0 | 0.0 |
| Coronary artery disease (%) | 4.0 | 6.0 |
| Duration of hemodialysis (months) (mean± SD) | 53.2±53.1 | 101.7±78.3 |
| Weight (kg) | 63.0±10.9 | 66.4±12.0 |
| Waist /Hip Ratio | 0.9±0.1 | 0.9±0.1 |
| Systolic BP (mmHg) | 135.2 ±0.1 | 149.8±29.4 |
| Diastolic BP (mmHg) | 77.6±8.8 | 85.0±16.3 |
| Kt/V | 1.3±0.2 | 1.3±0.2 |
| URR (%) | 65.4±7.3 | 68.1±5.9 |
SD: Standard deviation, BP: Blood pressure, URR= Urea removal ratio.
The correlation between prealbumin levels and lean body mass
The correlation between prealbumin levels and body cell mass
When the patients were grouped according to age of patients (age<65 and age≥65), prealbumin (p=0.003), phosphorus (p=0.003), calcium X phosphorus (p=0.007), PTH(p=0.36), BUN (p=0.000), creatinine (p=0.013) , albumin (p=0.016), uric acid (p=0.040), nPCR (p=0.001), ICW/Total body weight (p=0.003) , body fat mass (p=0.000) , body fat mass % (p=0.000), lean body mass (p=0.031), lean body mass % (p=0.000), lean dry mass (p=0.001), ICW % (p=0.002), illness marker (p=0.005), basal metabolism (p=0.007), basal metabolism/weight (p=0.007), activity metabolism (p=0.001), BMI (p=0.028), BFMI (p=0.000), FFMI (p=0.040) values were significantly different between the groups.
In the group E (age ≥65), body fat mass, body fat mass %, illness marker, BMI, BFMI were higher compared to patients in group A (age <65). Additionally, in the group E, prealbumin, phosphorus, calciumXphosphorus, PTH, BUN, creatinine, albumin, uric acid, nPCR, ICW/TBW, lean body mass, lean body mass %, lean dry mass, ICW, basal metabolism, basal metabolism/weight, activity metabolism and FFMI were lower than group A. Biochemical and BIA parameters of groups are displayed in Table 2.
Biochemical and bioimpedance parameters of patients in elderly and adult hemodialysis patients.
| Parameters | Age < 65 | Age ≥ 65 | P |
|---|---|---|---|
| Prealbumin (g/L) (mean± SD) | 0.4±0.1 | 0.3±0.7 | 0.003 |
| Albumin (g/dL) (mean± SD) | 4.3±0. 7 | 4.0±0.3 | 0.016 |
| Phosphorus (mg/dL) (mean± SD) | 6.2±1.7 | 5.0±1.2 | 0.003 |
| Calcium X Phosphorus (mean± SD) | 56.1±15.8 | 46.1±11.4 | 0.007 |
| PTH (pg/mL) (mean± SD) | 836.5±511.2 | 540.8±409.4 | 0.036 |
| CRP (mg/L) (mean± SD) | 13.2±19.6 | 14.2±17.1 | 0.640 |
| BUN (mg/dL) (mean± SD) | 65.7±14.4 | 49.6±14.1 | 0.000 |
| Creatinine (mg/dL) (mean± SD) | 10.5±3.4 | 8.2±2.1 | 0.013 |
| Uric acid (mg/dl) (mean± SD) | 6.4±1.3 | 5.7±0.8 | 0.040 |
| nPCR (g/kg/day) (mean± SD) | 1.0±0.2 | 0.8±0.2 | 0.003 |
| ICW/total body weight (L/kg) (mean± SD) | 0. 3±0.1 | 0.3±0.1 | 0.003 |
| Body Fat Mass (kg) (mean± SD) | 14.5±6.5 | 23.8±9.3 | 0.000 |
| Body Fat Mass (%) (mean± SD) | 22.7±8.7 | 36.1±11.6 | 0.000 |
| Lean Body Mass (kg) (mean± SD) | 48.7±9.7 | 42.6±11.4 | 0.031 |
| Lean Body Mass (%) (mean± SD) | 77.3±8.7 | 64.0±11.59 | 0.000 |
| Lean Dry Mass (kg) (mean± SD) | 11.4±3.7 | 7.4±4.4 | 0.001 |
| ICW (%)(mean± SD) | 33.0±3.7 | 29.0±4.5 | 0.002 |
| Illness marker (mean± SD) | 0.8±0.1 | 0.8±0.1 | 0.005 |
| Basal Metabolism (kcal/day) (mean± SD) | 1542.0±231.6 | 1359.4±256.4 | 0.007 |
| Basal Metabolism/weight (mean± SD) | 24.7±2.7 | 20.6±2.5 | 0.000 |
| Activity Metabolism (kcal) (mean± SD) | 2476.6±695.9 | 1937.7±712.9 | 0.001 |
| BMI (kg/m2) | 23.6±4.6 | 26.8±5.3 | 0.028 |
| BFMI (mean± SD) | 5,6±3.3 | 10.0±4.8 | 0.000 |
| FFMI (mean± SD) | 18.0±2.4 | 16.6±2.5 | 0.040 |
PTH: Parathyroid hormone, CRP: C- reactive protein, BUN: Blood urea nitrogen, nPCR: protein catabolic rate per normalized body weight, ICW: Intracellular water, ECW: Extracellular water, TBW: Total body water, BFMI: body fat mass index, FFMI: fat free mass index, BMI: Body mass index.
Discussion
Nutritional derangement in older age may be categorized as malnutrition, sarcopenia and cachexia with a certain overlap. Sarcopenia is very prevalent in elderly persons (1). We determined the tendency of age-related sarcopenic obesity in our elderly HD patients. In our study, body fat mass, body fat mass %, BFMI were higher in the elderly HD patients than in the adult HD patients. Conversely, lean body mass, lean body mass %, lean dry mass and FFMI were lower in the elderly group than in the adult group. In group A, all nutritional biochemical parameters were within normal range (30). However, in the elderly group, nPCR and all other nutritional biochemical values were significantly lower than in adult group. Furthermore, ICW/total body weight was lower in elderly group than in adult group. Our results clearly showed that elderly HD patients were more malnourished than adult HD patients and also had sarcopenic obesity.
Malnutrition generally describes a condition due to the inadequate intake of nutrients in which the metabolic rate is usually reduced. Particularly in HD patients, this condition tends to occur concomitantly and coexist with the Malnutrition-Inflammation Complex Syndrome and Malnutrition, Inflammation and Atherosclerosis Syndrome (31). These syndromes directly affect the mortality and morbidity of dialysis patients. Furthermore, PEM is also common in the elderly (1,2). In our study, basal metabolism, basal metabolism/weight, activity metabolism were lower in the elderly HD patients than in the adult HD patients. Consistent with the literature, the metabolic rates of our elderly HD patients were reduced (32).
Malnutrition profile was rather unique, with relatively favorable objective findings. Many biochemical parameters have been proposed as a means of evaluating nutritional status in children and adults on dialysis patients, including visceral proteins (albumin, prealbumin), serum creatinine and creatinine kinetics, total and partial lymphocyte counts and standard biochemistry (3,33). In addition, there is no doubt that BIA is the most widely used method to assess body composition in clinical practice worldwide and is recognized as a useful tool for monitoring nutritional status in dialysis patients(32).
The PCR is a useful indicator of protein intake in patients in steady state and more precise than the dietary protein intake obtained from dietary recall. Nutrient intake, as estimated by means of dietary recall or by calculating the protein catabolic rate (PCR) was included in the minimal nutritional assessment recommended by the KDOQI in 2000 (34). nPCR should be measured in clinically stable HD patients and be above 1.0 g/kg /day (31). In the present study, nPCR values in elderly HD group were lower than in the adult HD group. This finding demonstrates that the protein intake of elderly HD patients is lower than in adult HD patients.
Serum albumin has been the most commonly employed marker of PEM, based largely on the statistical association between diminished serum albumin, mortality, and morbidity (3,33). However, albumin is not an ideal marker of nutritional status, because it may be affected by hydration status, infection and other causes of inflammation that stimulate the cytokine-mediated acute-phase response and increase capillary leakage of albumin (33). Other biochemical parameters that can indirectly reflect nutritional status are hemoglobin, hematocrit and serum creatinine. Low serum hemoglobin and creatinine levels may therefore indicate the need for a thorough nutritional assessment (35,36). In the present study, in the elderly group, serum albumin, phosphorus, BUN, creatinine and uric acid levels were lower than in the adult group. These findings indicate that there is a tendency of malnutrition in elderly HD patients, of which one of the reasons may be the inadequate intake of nutrients as shown by decreased nPCR.
Prealbumin is a 54,000 D protein synthesized primarily by the liver. In patients receiving maintenance HD, a low serum prealbumin is an indicator of protein-energy wasting (9). In contrast to serum albumin, however, its half-life is relatively short (~2 to 3 days). It has therefore been suggested that prealbumin may be a more sensitive indicator of nutritional status than either serum albumin or transferrin (3,37). In our study, prealbumin levels correlated with nPCR, nutrition index and illness marker. Moreover, serum prealbumin levels were lower in the elderly than in the adult HD group. In the elderly group, the percentage of patients who had prealbumin levels below 3 g/L is 16%, however this percentage in adult patient group is 8%. Rambod et al have shown that (9), there was an inverse association between serum prealbumin and the percentage of total body fat. In patients with higher prealbumin, proportion of body fat mass, lean body mass and protein intake (nPCR) were lower, rather than higher, and serum concentrations of creatinine and albumin were higher. In our study, consistent with findings by Rambod et al, prealbumin levels positively correlated with lean body weight, lean dry weight, ICW and body cell mass. Furthermore, serum prealbumin levels correlated negatively with body fat mass and BFMI.
Changes in body composition consistent with malnutrition are also frequent in long-term HD patients and are powerful predictors of mortality (29,38). This is a condition characterized by loss of lean body mass combined with normal or even increased fat mass and inadequate response to nutrient supplementation (32). More precise measures of ICW should provide a better measure of somatic protein stores (body cell mass rather than lean body mass, which includes ECW and bone) than does measurement of lean body mass alone (11). In fact, measures of ICW are used as a close approximation of body cell mass and body cell mass has been deemed a key parameter for assessing nutritional status (25,26). Dumler et al (17) have reported that HD patients exhibited a significantly lower body cell mass and fat free mass. In the present study in the elderly group, ICW/total body weight, lean body mass, lean dry mass, ICW and FFMI were lower than adult group. Additionally, in the elderly patients, illness marker was higher than adult patients.
Senescence is associated with body composition changes and related functional decline. Cross-sectional population studies in humans suggest that body weight and fatness increase up to the sixth decade with a gradual decline thereafter in skeletal muscle mass (39). Previously, a cross-sectional study showed that in healthy subjects > 65 years, fat-free mass (FFM) decreased, while fat mass (FM) tended to increase (1). Body cell mass (BCM) which is the metabolically, oxygen-consuming compartment of the FFM also decreases with age in cross-sectional studies, although to a lesser extent than FFM (22). Most longitudinal studies confirmed the loss of FFM and BCM with aging (39,40). In elderly, fat free mass loss due to malnutrition is a condition overlapping with sarcopenia, which is defined as the loss of muscle mass and strength that occurs with age (12). In our study, elderly HD patients had higher BMI, BFMI and lower FFMI, lean dry mass and lean body mass than adult HD patients. This study shows that loss of skeletal muscle mass, tendency of sarcopenia and obesity occurs with advancing age in elderly male and female HD patients.
There are some limitations to of our study. Firstly, the sample was restricted to elderly HD patients so that the role of prealbumin in elderly peritoneal dialysis patients or in elderly individuals with advanced chronic renal insufficiency could not be evaluated. Secondly, we did not include a healthy age and sex matched geriatric patient group as a control. Thirdly, no dietary recall or food frequency questionnaires were performed. Therefore, no information about the effective dietary intakes could have been reported.
Conclusions
Our results indicate that body fat mass index was higher, and serum albumin, prealbumin, nPCR, lean body mass and FFMI were lower in elderly HD patients compared to adult HD patients. These results imply that elderly HD patients may be prone sarcopenic obesity and, therefore may require special nutritional support.
Conflict of Interest
The authors have declared that no conflict of interest exists.
References
1. Rösler A, Lehmann F, Krause T. et al. Nutritional and hydration status in elderly subjects: clinical rating versus bioimpedance analysis. Arch Gerontol Geriatr. 2010;50(3):e81-85
2. Drescher T, Singler K, Ulrich A. et al. Comparison of two malnutrition risk screening methods (MNA and NRS 2002) and their association with markers of protein malnutrition in geriatric hospitalized patients. Eur J Clin Nutr. 2010;64(8):887-893
3. GM Ackert K, Lew NL Lazarus JM. et al. Prealbumin is as important as albumin in the nutritional assessment of hemodialysis patients. Kidney Int. 2000;58(6):2512-2517
4. Kalantar-Zadeh K. Recent advances in understanding the malnutrition-inflammation-cachexia syndrome in chronic kidney disease patients: What is next? Semin Dial. 2005;18:365-369
5. Kopple JD. Nutritional status as a predictor of morbidity and mortality in maintenance dialysis patients. ASAIO J. 1997;43:246-250
6. Chertow GM. Assessing the nutritional status of patients with end-stage renal disease. Semin Dial. 1997;10:108-114
7. Chertow GM, Ackert K, Lew NL. et al. Prealbumin is as important as albumin in the nutritional assessment of hemodialysis patients. Kidney Int. 2000;58(6):2512-2517
8. Chazot C, Jean G, Vo-Van C. et al. The plasma level of brain natriuretic peptide is increased in malnourished hemodialysis patients. Blood Purif. 2009;28(3):187-192
9. Rambod M, Kovesdy CP, Bross R. et al. Association of serum prealbumin and its changes over time with clinical outcomes and survival in patients receiving hemodialysis. Am J Clin Nutr. 2008;88(6):1485-1494
10. Morais AA, Silva MA, Faintuch J. et al. Correlation of nutritional status and food intake in hemodialysis patients. Clinics. 2005;60(3):185-192
11. Kaysen GA, Zhu F, Sarkar S. et al. Estimation of total-body and limb muscle mass in hemodialysis patients by using multifrequency bioimpedance spectroscopy. Am J Clin Nutr. 2005;82(5):988-995
12. Sergi G, Coin A, Enzi G. et al. Role of visceral proteins in detecting malnutrition in the elderly. Eur J Clin Nutr. 2006;60(2):203-209
13. Dennis RA, Johnson LE, Roberson PK. et al. Changes in prealbumin, nutrient intake, and systemic inflammation in elderly recuperative care patients. J Am Geriatr Soc. 2008;56(7):1270-1275
14. Kopple JD, Mehrotra R, Suppasyndh O. et al. Observations with regard to the National Kidney Foundation K/DOQI clinical practice guidelines concerning serum transthyretin in chronic renal failure. Clin Chem Lab Med. 2002;40:1308-1312
15. Clinical practice guidelines for nutrition in chronic renal failure. K/DOQI, National Kidney Foundation. Am J Kidney Dis. 2000;35(Suppl 2 ):S1-S140
16. Chertow GM, Lazarus JM, Lew NL, Ma L. et al. Bioimpedance norms for the hemodialysis population. Kidney Int. 1997;52:1617-1621
17. Dumler F, Kilates C. Body composition analysis by bioelectrical impedance in chronic maintenance dialysis patients: comparisons to the National Health and Nutrition Examination Survey III. J Ren Nutr. 2003Apr;13(2):166-72
18. Mushnick R, Fein PA, Mittman N. et al. Relationship of bioelectrical impedance parameters to nutrition and survival in peritoneal dialysis patients. Kidney Int Suppl. 2003Nov(87):S53-6
19. Azar R, Al-Moubarak I, Barsumau J. et al. Assessment and follow-up of nutritional status in hemodialysis patients. Nephrol Ther. 2009Jul;5(Suppl 5):S317-322
20. Di Iorio BR, Scalfi L, Terracciano V. et al. A systematic evaluation of bioelectrical impedance measurement after hemodialysis session. Kidney Int. 2004Jun;65(6):2435-40
21. Chertow GM, Lowrie EG, Wilmore DW. et al. Nutritional assessment with bioelectrical impedance analysis in maintenance hemodialysis patients. J Am Soc Nephrol. 1995;6:75-81
22. Kyle UG, Piccoli A, Pichard C. Body composition measurements: interpretation finally made easy for clinical use. Curr Opin Clin Nutr Metab Care. 2003;6:387-393
23. Chumlea WC. Anthropometric and body composition assessment in dialysis patients. Semin Dial. 2004;17:466-470
24. Dell'Aquila R, Rodighiero MP, Di Loreto P. et al. A new home based bioimpedance system for PD. Contrib Nephrol. 2006;150:326-335
25. Earthman C, Traughber D, Dobratz J. et al. Bioimpedance spectroscopy for clinical assessment of fluid distribution and body cell mass. Nutr Clin Pract. 2007;22(4):389- 405
26. Jacobs LH, van de Kerkhof JJ, Mingels AM. et al. Inflammation, overhydration and cardiac biomarkers in haemodialysis patients: a longitudinal study. Nephrol Dial Transplant. 2010;25(1):243-248
27. Daugirdas JT. Second generation logarithmic estimates of single-pool variable volume Kt/V: an analysis of error. J Am Soc Nephrol. 1993;4:1205-1213
28. DOQI HD Adequacy WorkGroup. http://www.kidney.org/professionals/kdoqi/guidelines_updates/nut_appx05a.html
29. Donadio C, Consani C, Ardini M. et al. Estimate of body water compartments and of body composition in maintenance hemodialysis patients: comparison of single and multifrequency bioimpedance analysis. J Ren Nutr. 2005;15(3):332-344
30. Fouque D, Vennegoor M, Ter Wee P. et al. EBPG guideline on nutrition. Nephrol Dial Transplant. 2007;22(Suppl. 2):ii45-87
31. Vlatkovic V, Trbojevic-Stankovic J, Stojimirovic B. Malnutrition-inflammation complex syndrome and hepatitis C in maintenance hemodialysis patients. Ther Apher Dial. 2009;13(2):113-120
32. Paglialonga F, Edefonti A. Nutrition assessment and management in children on peritoneal dialysis. Pediatr Nephrol. 2009Apr;24(4):721-730
33. Herselman M, Esau N, Kruger JM. et al. Relationship between serum protein and mortality in adults on long-term hemodialysis: exhaustive review and meta-analysis. Nutrition. 2010Jan;26(1):10-32
34. Clinical practice guidelines for nutrition in chronic renal failure. K/DOQI, National Kidney Foundation. Am J Kidney Dis. 2000Jun;35:S1-140
35. Faintuch J, Morais AA, Silva MA. et al. Nutritional profile and inflammatory status of hemodialysis patients. Ren Fail. 2006;28(4):295-301
36. Jha V, Jairam A, Sharma MC. et al. Body composition analysis with bioelectric impedance in adult Indians with ESRD: comparison with healthy population. Kidney Int. 2006;69(9):1649-1653
37. Chrysostomou S, Stathakis C, Petrikkos G. et al. Assessment of prealbumin in hemodialysis and renal-transplant patients. J Ren Nutr. 2010Jan;20(1):44-51
38. Kotler DE, Burastero S, Wang J. et al. Prediction of body cell mass, fat-free mass, and total body water with bioelectrical impedance analysis: effects of race, sex, and disease. Am J Clin Nutr. 1996;64(Suppl):489S-497S
39. Gallagher D, Ruts E, Visser M. et al. Weight stability masks sarcopenia in elderly men and women. Am J Physiol Endocrinol Metab. 2000;279:E366-375
40. Woo J, Ho SC, Sham A. Longitudinal changes in body mass index and body composition over 3 years and relationship to health outcomes in Hong Kong Chinese age 70 and older. J Am Geriatr Soc. 2001;49:737-746
Author contact
![]() Corresponding author: Gülperi Çelik; MD, Department Internal Medicine, Division of Nephrology, Faculty of Medicine, Selcuk University, Konya, Turkey. Tel: 903322415000; Fax: 903322416065; gulpericelikcom
Corresponding author: Gülperi Çelik; MD, Department Internal Medicine, Division of Nephrology, Faculty of Medicine, Selcuk University, Konya, Turkey. Tel: 903322415000; Fax: 903322416065; gulpericelikcom