Impact Factor ISSN: 1449-1907
- Issue 8; 2026
- Issue 7; 2026
- Issue 6; 2026
- Issue 5; 2026
- Issue 4; 2026
- Volume 23; 2026
- Past Issues
- Editorial Board
- Cover Images
- Index & Coverage
- Cover Suggestion
- Special Issues
Introduction
Methods
Statistics
Results
Vector Velocity Imaging (VVI)
Discussion
Conclusions
Abbreviations
References

 Global reach, higher impact
Int J Med Sci 2011; 8(2):106-113. doi:10.7150/ijms.8.106 This issue Cite
Research Paper
Segment-orientated analysis of two-dimensional strain and strain rate as assessed by velocity vector imaging in patients with acute myocardial infarction
Thomas Butz* ![]() , Corinna N. Lang*, Marc van Bracht, Magnus W. Prull, Hakan Yeni, Petra Maagh, Gunnar Plehn, Axel Meissner, Hans-Joachim Trappe
, Corinna N. Lang*, Marc van Bracht, Magnus W. Prull, Hakan Yeni, Petra Maagh, Gunnar Plehn, Axel Meissner, Hans-Joachim Trappe
Department of Cardiology and Angiology, Marienhospital Herne, Ruhr University Bochum, Hoelkeskampring 40, D-44625 Herne, Germany
* Both authors contributed equally to this work
Received 2010-11-14; Accepted 2011-1-31; Published 2011-2-1
Abstract
Aims: Strain rate imaging techniques have been proposed for the detection of ischemic or viable myocardium in coronary artery disease, which is still a challenge in clinical cardiology. This retrospective comparative study analyzed regional left ventricular function and scaring with two-dimensional strain (2DS) in the first 4 to 10 days after acute anterior myocardial infarction (AMI).
Methods and results: The study population consisted of 32 AMI patients with an LAD occlusion and successful reperfusion. The assessment of peak systolic 2DS and peak systolic strain rate (SR) was performed segment-oriented with the angle-independent speckle tracking algorithm Velocity Vector Imaging (VVI). The infarcted, adjacent and non-infarcted segments were revealed by late enhancement MRI (LE-MRI), which was used as reference for the comparison with 2DS. The infarcted segments showed a significant decrease of tissue velocities, 2DS and SR in comparison to the non-affected segments.
Conclusion: 2DS and SR as assessed by VVI seem to be a suitable approach for echocardiographic quantification of global and regional myocardial function as well as a promising tool for multimodal risk stratification after anterior AMI.
Keywords: Myocardial infarction, Two-dimensional strain, Strain rate imaging, Late Enhancement MRI
Introduction
After acute myocardial infarction (AMI) the discrimination of avital scar tissue and vital reversible harmed myocardium is crucial for the optimal individual therapy, and for risk stratification 1. Further intervention, such as a percutaneous coronary intervention (PCI) or a coronary artery bypass graft (CABG), is only indicated if the myocardium is hypokinetic due to insufficient blood supply (“hibernating” or “stunned” myocardium), but still viable. Until now only late enhancement magnetic resonance imaging (LE-MRI) has provided a certain distinction. However, its application is still limited due to high expense and restricted availability. Therefore, current studies are mostly concerned with the question if newly emerged parametric echocardiographic methods, measuring left ventricular (LV) function and viability by the deformation indices two-dimensional strain (2DS) and strain rate (SR), might be an alternative approach in clinical routine.
Tissue Doppler Imaging (TDI) and 2D Speckle Tracking (2DST) algorithms facilitate the assessment of tissue velocities and deformation markers. But only strain - procentual length alteration relative to a base length - can distinguish between active and passive movement. Strain rate records the change of length per time unit 2-6.
Previous studies using TDI or 2DST demonstrated a reduction of the myocardial deformation indices 2DS and SR in infarcted segments after AMI 7-13. The goal of our retrospective study - since only limited data has been obtained thus far - was the further validation of the 2DST software “Velocity Vector Imaging” (VVI) for the differentiation between infarcted and non-infarcted segments as well as, the correct localization of the infarcted segments in comparison to LE-MRI 14-15.
Methods
Patients with their first AMI and successful reperfusion of the left anterior descending artery (LAD) by primary PCI were retrospectively enrolled in this study.
Inclusion criteria were AMI caused by LAD occlusion (type I, ESC) and coronary artery disease affecting only 1 or 2 vessels. Patients with previous AMI, with 3 affected coronary arteries, after CABG, non-ischemic cardiomyopathy or high grade valvular disease were excluded.
Standard echocardiography and cardiac LE-MRI were performed 4 to 10 days after AMI. The segments were categorized by cardiac LE-MRI as follows: infarcted (LE 51-100% of wall thickness and LAD territory), adjacent (either LE 1-50% of wall thickness or no LE but LAD perfusion territory) and non-infarcted (LE 0%, no LAD perfusion territory)9. The results of the VVI offline analysis of the tissue velocities (S´, E´, A´) derived from 2DST and deformation markers (2DS, 2DSR) were compared intra-individually to the MRI findings.
The study protocol was approved by the local ethics committee of the Ruhr-University of Bochum.
Conventional 2D Doppler Echocardiography
In left lateral decubital position the patients underwent transthoracic echocardiography according to the ASE guidelines16 on a Sequoia C512 ultrasound system (Siemens Healthcare, Erlangen, Germany) equipped with a phased array transducer (frequency range of 3.75 - 4.25 MHz). ECG-controlled parasternal long axis, parasternal short axis, apical 4-, 3-, and 2-chamber views of LV walls were obtained in endexspiration. 3 cardiac cycles of each view were digitally stored with the KardioPACS-Software 7.0 (medPACS, Essen, Germany). LV ejection fraction (LV-EF) was calculated by the modified Simpson´s method. LA and LV diameter were measured by M-Mode echocardiography. High grade cardiac valvular disease was excluded by Color, PW and CW Doppler according to current guidelines 16.
Velocity vector imaging (VVI)
The principle of angle-independent VVI (Siemens, Erlangen, Germany) has been developed from M-Mode modifications17. Using 2D gray scale images VVI analysis can be carried out in order to measure tissue velocities (S´, E´, A´), 2DS and SR. We employed the ASE recommendation of a 17 segments model for our research to examine MRI and Echo data 18. The observer defined the endocardial border manually and placed regions of interests (ROI) in the middle of every segment (see Figure 1).
VVI approach to tissue velocities and deformation in the left ventricle (Four chamber view)
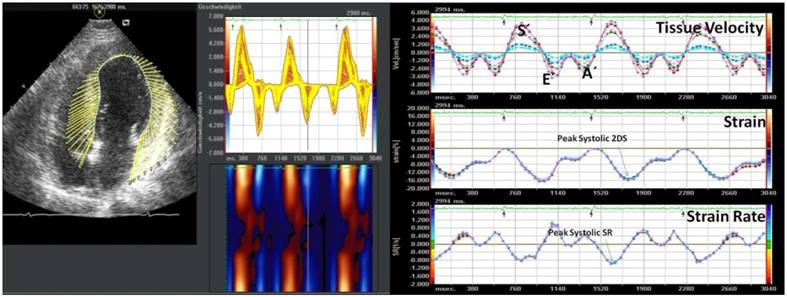
The endocardial border and the myocardium was then automatically tracked frame-by-frame by the VVI software throughout the cardiac cycle. The VVI algorithm includes speckle tracking, global motion coherence, and consistency of periodicity between cardiac cycles, which are described in detail in the producers patent (US 6.909.914) and the patent application publications (US 2005/0070798, US 2005/0074153) 19-20.
In our study we focused on the longitudinal velocities and deformation markers because ischemia especially affects subendocardial fibers first, which are mainly responsible for longitudinal movement 21.
Late enhancement magnetic resonance imaging (LE-MRI)
Using a 1.5-Tesla Magnetom Sonata system (Siemens, Erlangen, Germany) we scanned the heart and surrounding structures of 32 patients ECG-triggered in endexspiration and produced the standard views of the long and short axes, as well as the left ventricular outflow tract. With the CMRtools software (Cardiovascular Imaging Solutions, London, UK) we calculated volumes as well as the LV-EF of the left ventricle according to the reference data of Maceira et al. 22.
Late gadolinium enhancement images were acquired 10 to 25 minutes after applicating 0.1-0.2 mmol/kg bodyweight Magnevist® (Bayer, Leverkusen, Germany) with a 2D-segmented, spoilt, turbo gradient echo sequence (TRUFISP, Siemens, Erlangen, Germany). This sequence technique developed by Simonetti et al. allows a detection of myocardial necrosis, scars and fiber tissue (hyperenhancement of the myocardium) 30. The inversion time was individually adapted.
The segments were labeled in infarcted (LE 51-100% of wall thickness), adjacent (either LE 1-50% or no LE but LAD perfusion territory) and non-infarcted (LE 0%, no LAD perfusion territory) as proposed before9.
Statistics
All continuous values were expressed as mean ± standard deviation after ascertaining a normal distribution. We performed the unpaired or paired t-tests and one-way repeated measures analysis of variance (ANOVA). If the ANOVA test results were significant we followed up with the post hoc Scheffé procedure. ROC analysis was performed as previously described 23. Coefficients of variance were calculated for the inter- and intra-observer variation. Differences were considered significant when the p-value was less than 0.05. We used the statistic software SPSS 15.0 (Chicago, IL, USA) for all analyses.
Results
Between August 2006 and April 2009, 32 patients (27 men) with a mean age of 58±12 years (range 38-81 years), who had their first anterior AMI (23 STEMI; 9 NSTEMI) and underwent successful reperfusion of the LAD by PCI, were enrolled in this study. Successful acute revascularization of the infarcted area was achieved by recanalisation, PCI and Stenting of the culprit lesion in the infarct-related artery (LAD). No patient had to underwent CABG. In the 11 patients with 2 vessel disease a stenosis > 50% was found in the circumflex artery in 4 patients and in the right coronary artery in 7 patients. Complete revascularization in the patients with 2-vessel disease was achieved by serial PCI of the remaining diseased coronary arteries according to hemodynamic relevance and morphology of the stenosis during the further clinical course. Basic clinical data are listed in Table 1.
Basic clinical characteristics
| Gender (male/female) | 27/5 |
|---|---|
| Age (years) | 58 ± 12 |
| Height (cm) | 1.72 ± 9 |
| Weight (kg) | 81 ± 15 |
| BMI (kg/m2) | 27 ± 4 |
| ECG (STEMI/NSTEMI) | 23/9 |
Echocardiography was performed 7.8±3.6 days after AMI. With a mean of 49±12 %, the LV-EF was mildly impaired after the AMI. M-Mode and B-Mode transthoracic echocardiographic diameters and volumes are displayed in Table 2.
Echocardiographic data set
| Ejection fraction, EF (%) | 49 ± 12 |
|---|---|
| IVSD (cm) | 1.1 ± 0.2 |
| HWD (cm) | 1.0 ± 0.1 |
| LVDD (cm) | 5.2 ± 0.4 |
| LVSD (cm) | 3.7 ± 1.2 |
| LV-EDV (ml) | 166 ± 46 |
| FS (%) | 29 ± 12 |
| LA (cm) | 3.8 ± 0.6 |
| RVDD (cm) | 2.1 ± 0.7 |
| Aorta(cm) | 3.0 ± 0.5 |
Vector Velocity Imaging (VVI)
In 386 (71%) of 544 segments the analysis by VVI was feasible. Segments were excluded if the endocardial border was not tracked properly, if the digital storage of 3 cardiac cycles was not completed, and if movement of the files was evoked by breathing excursions of the patient. The mean picture frame rate (PFR) was 45±16 s-1. The average values for the global longitudinal deformation were: 2DS -11.67 ± 5.38 %; systolic SR (sSR) -0.65 ± 0.27 s-1; early diastolic SR (Sre) 0.60 ± 0.35 s-1.
The analysis of tissue velocities demonstrated a gradient of systolic (S´) and diastolic (early E´ and late A´) velocities from the apex to the basis of the heart with significant differences between basal, midventricular and apical myocardium (see Table 3).
Tissue velocities (S´, E´, A´) of basal, mid and apical segments as assessed by VVI
| Basal | Mid | Apical | p ANOVA | |
|---|---|---|---|---|
| S´ (cm/s) | 3.64 ± 1.63 | 2.41 ± 1.07 | 1.06 ± 0.65 | p < 0.001 |
| E´ (cm/s) | -2.60 ± 1.37 | -1.68 ± 0.91 | -0.72 ± 0.67 | p < 0.001 |
Comparison of VVI and LE-MRI
MRI was performed 8.1±1.4 days after AMI. The LE-MRI study resulted in 209 (38%) segments with a LE ≥ 51%, 91 (17%) with a LE of 1-50% and 244 (45 %) segments without LE. The categorization labeled 209 segments (38%) as infarcted, 162 (30%) as adjacent and 173 (32%) as non-infarcted.
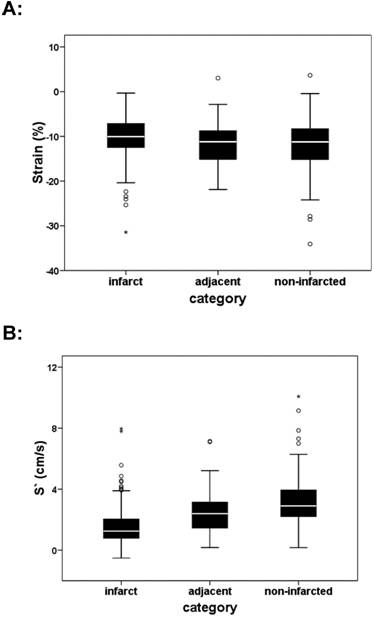
The comparison of infarcted and non-infarcted segments showed a significant difference (p < 0.05) according to 2DS, dSR and tissue velocities, which is depicted in Table 4 and Figures 2, 3. Infarcted segments demonstrated significantly decreased 2DS as well as tissue velocities in comparison to adjacent and non-infarcted segments.
Comparison of deformation and tissue velocities in AMI according to the categorization of the segments as infarcted, adjacent and non-infarcted (see methods).
| infarcted | adjacent | non-infarcted | p ANOVA | |
|---|---|---|---|---|
| 2DS (%) | -10.37 ± 4.75 | -11.45 ± 4.55 | -12.01 ± 5.42 | p < 0.05 |
| sSR (s-1) | -0.62 ± 0.25 | -0.68 ± 0.25 | -0.66 ± 0.27 | n.s. |
| SRe (s-1) | 0.53 ± 0.32 | 0.60 ± 0.34 | 0.63 ± 0.40 | p < 0.05 |
| S´ (cm/s) | 1.61 ± 1.27 | 2.43 ± 1.33 | 3.10 ± 1.66 | p < 0.001 |
| E´ (cm/s) | -1.10 ± 0.94 | -1.65 ± 1.08 | -2.25 ± 1.42 | p < 0.001 |
| A´ (cm/s) | -1.00 ± 0.84 | -1.36 ± 0.96 | -1.88 ± 1.19 | p < 0.001 |
Significant difference of Strain (A; ANOVA: p < 0.05) and S´ (right) between infarcted, adjacent and non-infarcted segments (B; ANOVA: p<0.01)
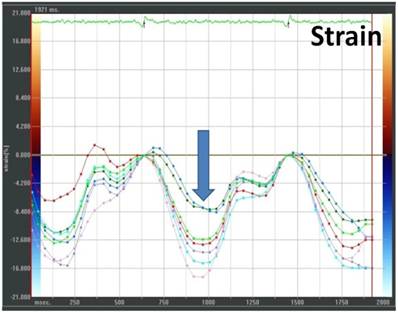
Example of a VVI analysis with markedly reduced strain (arrow) in septal segments after AMI (four-chamber view; green and blue ROI representing the mid and apical septal segments)
To investigate infarct transmurality we also compared the segments with LE ≥ 51%, LE 1-50% and no LE. We demonstrated significant differences of 2DS, dSR, S´, E´, A´ (p < 0.05) between segments with LE ≥ 51% and segments with no LE. According to tissue velocity values we additionally found significant differences between segments with LE ≥ 51% and LE 1-50% (p < 0.05). The data is presented in Table 5.
Comparison of deformation imaging and infarct transmurality by LE-MRI
| No LE | LE 1- 50% | LE ≥ 51% | p ANOVA | |
|---|---|---|---|---|
| 2DS (%) | -11.87 ± 5.42 | -11.73 ±4.28 | -10.34 ± 4.76 | p < 0.05 |
| sSR (s-1) | -0.66 ± 0.26 | -0.69 ± 0.26 | -0.62 ± 0.25 | n.s. |
| SRe (s-1) | 0.69 ± 0.26 | 0.58 ± 0.34 | 0.53 ± 0.32 | p < 0.05 |
| S´ (cm/s) | 3.01 ± 1.64 | 2.30 ± 1.25 | 1.60 ± 1.26 | p < 0.001 |
| E´ (cm/s) | -2.22 ± 1.40 | -1.60 ± 1.03 | 1.10 ± 0.94 | p < 0.001 |
| A´ (cm/s) | 1.85 ± 1.17 | -1.30 ± 0.93 | -0.99 ± 0.84 | p < 0.001 |
In a receiver operating characteristic curve (ROC) analysis VVI-derived mean peak systolic velocity S´ of all infarcted segments in comparison to the mean peak S´ velocities of the adjacent and non-infarcted segments predicted infarction (LE ≥ 51%) with 80% sensitivity and 70% specificity (area under the curve, AUC: 0.8, confidence interval 0.77-0.86) for a cut-off value less than 1.95 cm/s (Figure 4, Table 6).
ROC analysis for the detection of previous segmental myocardial infarction by strain, sSR, dSR or S´ after AMI
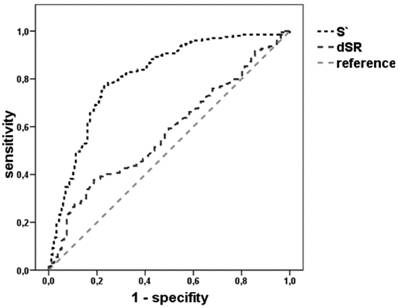
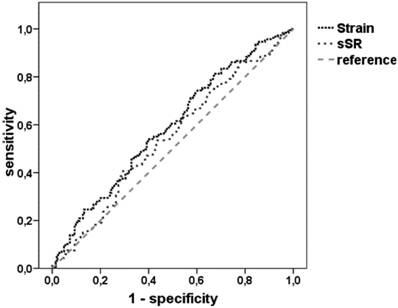
Receiver operating characteristic (ROC) analysis for different modalities for the detection of infarcted segments
| cut-off | AUC | sensitivity | specificity | |
|---|---|---|---|---|
| Strain (%) | -12.00 | 0.6 | 70% | 43% |
| -10.34 | 0.6 | 54% | 59% | |
| -6.50 | 0.6 | 23% | 87% | |
| sSR (s-1) | -0.73 | 0.54 | 70% | 36% |
| SRe (s-1) | 0.34 | 0.6 | 80% | 20% |
| S´ (cm/s) | 1.95 | 0.8 | 80% | 70% |
For intra-observer variability the same observer reviewed the echocardiographic images of 20 patients and repeated VVI measurements several weeks after the initial measurement. In 8 cases we blinded a second observer to the first VVI measurements and MRI data for another review. The results were reported as correlation coefficients. For intra-observer variability we found a correlation coefficient of 11%, for inter-observer variability we demonstrated a correlation coefficient of 17%. A paired t-test did not confirm any significant difference between the obtained data sets.
Discussion
The main finding of this study is the significant difference of strain, SRe and tissue velocities between infarcted and non-infarcted segments demonstrated by an comparison between 2D Speckle Tracking (2DST) and late enhancement MRI (LE-MRI).
Deformation imaging after AMI
Our data demonstrated a significant difference of tissue velocities (S´, E´) between infarcted and non-infarcted segments assessed by VVI. Mean peak systolic velocity S´ predicted infarcted segments (LE ≥ 51%) in comparison to adjacent and non-infarcted segments with a sensitivity of 80% and a specificity of 70% (AUC 0.8) with a cut-off value of less than 1.95 cm/s.
Poor agreement between VVI and TDI measurements have been previously demonstrated, and therefore they are not interchangeable 23,37. The measured tissue velocities in the present study are lower than in previous VVI studies 14,15, which might be explained by the extent of infarct size or relatively lower PFR´s in our study. At the moment there are no normal values of a large cohort of healthy controls and validated recommendations for the PFR in VVI analysis are still not available. The data of former studies showed that a mean PFR about 40-50 Hz is suitable for VVI analysis. A far higher PFR might not assure the proper capturing of the speckle pattern, and a lower frame rate might cause even decreased values. No relevant affection of the measurements due to the PFR should be expected because our analysis and interpretation of the results based on an intra-individual comparison of the segments.
As velocity measurements alone are not able to differentiate between active and passive movement, deformation imaging is crucial to identify ischemic tissue 7, 24-29. In principle, our findings are confirming previously published studies about infarct detection and size, who described significant differences of the radial and circumferential strain and strain rate by 2DST in normo-, hypo-, akinetic and dyskinetic segments of post-infarct patients 8-13, 30-37, which were not reliably accessible by TDI. Radial strain also allowed the differentiation between transmural and non-transmural infarction31, a layer specification10, and the identification of segments, which will recover after a revascularization therapy 32.
In addition, our data is supporting the findings of Chen et al. 14, who were able to differentiate between segments of healthy controls, infarcted and non-infarcted segments of post AMI patients by VVI. Jurcut et al.15 also showed significant differences of infarcted and non-infarcted segments by VVI with LE-MRI as reference method. Additionally, they could differentiate between adjacent segments and infarcted segments as well as between adjacent and non-infarcted segments. Referring to the latter, we were able to show significant differences by tissue velocity analysis, but not by strain analysis between infarcted and adjacent segments.
Segments with LE ≥ 51% demonstrated significantly decreased strain and velocities in comparison to segments with no LE. Comparing segments with LE ≥ 51% and LE 1-50% presented a significant difference of tissue velocities (S´ and E´), but not of strain and strain rate values. In contrast to our results, one previous study showed significant differences of the peak systolic longitudinal strain between segments with LE ≥ 51% and LE 1-50% 15.
By using the previously proposed cut-off value 15 for strain of -6.5 % a sensitivity of 23 % and specificity of 87 % was calculated for the detection of infarcted segments (AUC 0.6, confidence interval 0.53 - 0.64). A cut-off value of -10.34% resulted in a sensitivity of 54 % and specificity of 59 % (see Table 6).
The intra- and inter-observer variation of our data is congruent with the data of Jarnert et al. and Zeng et al.38-39. In general, the variability, which has been assessed in this study, do not differ from previously published data of parametric echocardiography, already clinically integrated and established 15.
Limitations
Based on 2D gray scale images the quality of VVI data is strictly dependent on the quality of the echocardiographic loops. A problem of all Strain Rate Imaging algorithms is the huge variability of comparable parameters and values, which are provided by different ultrasound machines and software algorithms. There are neither guidelines, standardized technical settings, nor normal values for each of the different software packages, which complicates the comparison of the different approaches 30. Although we analyzed the segments following a strict protocol we had to exclude segments in which the tracking failed (feasibility 71%).
One could also criticize the intra-individual comparison instead of considering a control group. In our opinion, as the infarct is a regional process, there is no better match than the non-infarcted segment of the same patient for an infarcted segment. Otherwise there will always be confounders like age, blood pressure, and heart rate.
Conclusions
Velocity Vector imaging (VVI) is a clinically feasible approach for strain measurements in infarcted myocardium allowing an accurate assessment of global and regional myocardial function, and a differentiation between infarcted and non-infarcted segments. Further research for the definition of cut-off values and technical standards will be needed to fully integrate this method into clinical practice. The detection of scarred as well as vital, but dysfunctional myocardium by VVI might be useful for multimodal risk stratification and the determination of different therapeutic approaches as well as prognosis in future.
Abbreviations
AMI: Acute myocardial infarction;
A': Peak late diastolic tissue velocity [cm/s];
E': Peak early diastolic velocity [cm/s];
ECG: Electrocardiography ;
EF: Ejection fraction [%];
2DS: 2-dimensional peak systolic strain [%];
2DST: 2-dimensional speckle tracking ;
Echo: Echocardiography;
CAD: Coronary artery disease;
LAD: Left anterior descending artery;
LE: Late Enhancement [%];
LV: Left ventricle;
MRI: Magnetic resonance Imaging;
PCI: Percutaneous coronary intervention;
RCA: Right coronary artery;
CX: Circumflex artery;
S': Peak systolic tissue velocity [cm/s];
SR: strain rate [s-1];
sSR: peak systolic strain rate [s-1];
SRe: eak early diastolic systolic strain rate [s-1];
ROI: Region of interest;
TDI: Tissue Doppler Imaging;
VVI: Velocity Vector Imaging.
Conflict of Interest
The authors have declared that no conflict of interest exists.
References
1. Kloner RA, Przyklenk K. Hibernation and stunning of the myocardium. N Engl J Med. 1991;325(26):1877-1879
2. D'Hooge J, Heimdal A, Jamal F. et al. Regional strain and strain rate measurements by cardiac ultrasound: principles, implementation and limitations. Eur J Echocardiogr. 2000;1(3):154-170
3. Mirsky I, Parmley WW. Assessment of passive elastic stiffness for isolated heart muscle and the intact heart. Circ Res. 1973;33(2):233-243
4. Pavlopoulos H, Nihoyannopoulos P. Strain and strain rate deformation parameters: from tissue Doppler to 2D speckle tracking. Int J Cardiovasc Imaging. 2008;24(5):479-491
5. Sutherland GR, Di Salvo G, Claus P, D'Hooge J, Bijnens B. Strain and strain rate imaging: a new clinical approach to quantifying regional myocardial function. J Am Soc Echocardiogr. 2004;17(7):788-802
6. Voigt JU, Flachskampf FA. Strain and strain rate. New and clinically relevant echo parameters of regional myocardial function. Z Kardiol. 2004;93(4):249-258
7. Weidemann F, Wacker C, Rauch A. et al. Sequential changes of myocardial function during acute myocardial infarction, in the early and chronic phase after coronary intervention described by ultrasonic strain rate imaging. J Am Soc Echocardiogr. 2006;19(7):839-847
8. Adamu U, Schmitz F, Becker M, Kelm M, Hoffmann R. Advanced speckle tracking echocardiography allowing a three-myocardial layer-specific analysis of deformation parameters. Eur J Echocardiogr. 2009;10(2):303-308
9. Becker M, Hoffmann R, Kuhl HP. et al. Analysis of myocardial deformation based on ultrasonic pixel tracking to determine transmurality in chronic myocardial infarction. Eur Heart J. 2006;27(21):2560-2566
10. Becker M, Ocklenburg C, Altiok E. et al. Impact of infarct transmurality on layer-specific impairment of myocardial function: a myocardial deformation imaging study. Eur Heart J. 2009;30(12):1467-1476
11. Chan J, Hanekom L, Wong C, Leano R, Cho GY, Marwick TH. Differentiation of subendocardial and transmural infarction using two-dimensional strain rate imaging to assess short-axis and long-axis myocardial function. J Am Coll Cardiol. 2006;48(10):2026-2033
12. Gjesdal O, Hopp E, Vartdal T. et al. Global longitudinal strain measured by two-dimensional speckle tracking echocardiography is closely related to myocardial infarct size in chronic ischaemic heart disease. Clin Sci (Lond). 2007;113(6):287-296
13. Leitman M, Lysyansky P, Sidenko S. et al. Two-dimensional strain-a novel software for real-time quantitative echocardiographic assessment of myocardial function. J Am Soc Echocardiogr. 2004;17(10):1021-1029
14. Chen J, Cao T, Duan Y, Yuan L, Yang Y. Velocity vector imaging in assessing the regional systolic function of patients with post myocardial infarction. Echocardiography. 2007;24(9):940-945
15. Jurcut R, Pappas CJ, Masci PG. et al. Detection of regional myocardial dysfunction in patients with acute myocardial infarction using velocity vector imaging. J Am Soc Echocardiogr. 2008;21(8):879-886
16. Cheitlin MD, Armstrong WF, Aurigemma GP. et al. ACC/AHA/ASE 2003 Guideline Update for the Clinical Application of Echocardiography: summary article. A report of the American College of Cardiology/American Heart Association Task Force on Practice Guidelines (ACC/AHA/ASE Committee to Update the 1997 Guidelines for the Clinical Application of Echocardiography). J Am Soc Echocardiogrt. 2003;16(10):1091-1110
17. Tonti G, Riccardi G, Denaro FM, Trambaiolo P, Salustri A. From digital image processing of colour Doppler M-mode maps to noninvasive evaluation of the left ventricular diastolic function: a dedicated software package. Ultrasound Med Biol. 2000;26(4):603-611
18. Lang RM, Bierig M, Devereux RB. et al. Recommendations for chamber quantification: a report from the American Society of Echocardiography's Guidelines and Standards Committee and the Chamber Quantification Writing Group, developed in conjunction with the European Association of Echocardiography, a branch of the European Society of Cardiology. J Am Soc Echocardiogr. 2005;18(12):1440-1463
19. Cannesson M, Tanabe M, Suffoletto MS, Schwartzman D, Gorcsan J3rd. Velocity vector imaging to quantify ventricular dyssynchrony and predict response to cardiac resynchronization therapy. Am J Cardiol. 2006;98(7):949-953
20. Vannan MA, Pedrizzetti G, Li P. et al. Effect of cardiac resynchronization therapy on longitudinal and circumferential left ventricular mechanics by velocity vector imaging: description and initial clinical application of a novel method using high-frame rate B-mode echocardiographic images. Echocardiography. 2005;22(10):826-830
21. Sutherland GR, Hatle L, Claus P, D'Hooge J, Bijnens B. Doppler Myocardial Imaging - A Textbook. Hasselt: BSWK bvba, Scientific Consulting and Publishing. 2006
22. Maceira AM, Prasad SK, Khan M, Pennell DJ. Normalized left ventricular systolic and diastolic function by steady state free precession cardiovascular magnetic resonance. J Cardiovasc Magn Reson. 2006;8(3):417-426
23. Butz T, Piper C, Langer C. et al. Diagnostic superiority of a combined assessment of the systolic and early diastolic mitral annular velocities by tissue Doppler imaging for the differentiation of restrictive cardiomyopathy from constrictive pericarditis. Clin Res Cardiol. 2010;99(4):207-15
24. Bach DS, Armstrong WF, Donovan CL, Muller DW. Quantitative Doppler tissue imaging for assessment of regional myocardial velocities during transient ischemia and reperfusion. Am Heart J. 1996;132(4):721-725
25. Edvardsen T, Aakhus S, Endresen K, Bjomerheim R, Smiseth OA, Ihlen H. Acute regional myocardial ischemia identified by 2-dimensional multiregion tissue Doppler imaging technique. J Am Soc Echocardiog. 2000;13(11):986-994
26. Heimdal A, Stoylen A, Torp H, Skjaerpe T. Real-time strain rate imaging of the left ventricle by ultrasound. J Am Soc Echocardiog. 1998;11(11):1013-1019
27. Rademakers F, Van de Werf F, Mortelmans L, Marchal G, Bogaert J. Evolution of regional performance after an acute anterior myocardial infarction in humans using magnetic resonance tagging. J Physiol. 2003;546(Pt 3):777-787
28. Van Leuven SL, Waldman LK, McCulloch AD, Covell JW. Gradients of epicardial strain across the perfusion boundary during acute myocardial ischemia. Am J Physiol. 1994;267(6 Pt 2):2348-2362
29. Masuda K. Assessment of Dyssynchronous Wall Motion During Acute Myocardial Ischemia Using Velocity Vector Imaging. JACC Cardiovasc Imaging. 2008;1(2):210-20
30. Amundsen BH, Helle-Valle T, Edvardsen T. et al. Noninvasive myocardial strain measurement by speckle tracking echocardiography: validation against sonomicrometry and tagged magnetic resonance imaging. J Am Coll Cardiol. 2006;47(4):789-793
31. Becker M, Bilke E, Kuhl H. et al. Analysis of myocardial deformation based on pixel tracking in two dimensional echocardiographic images enables quantitative assessment of regional left ventricular function. Heart. 2006;92(8):1102-1108
32. Becker M, Lenzen A, Ocklenburg C. et al. Myocardial deformation imaging based on ultrasonic pixel tracking to identify reversible myocardial dysfunction. J Am Coll Cardiol. 2008;51(15):1473-1481
33. Cho GY, Chan J, Leano R, Strudwick M, Marwick TH. Comparison of two-dimensional speckle and tissue velocity based strain and validation with harmonic phase magnetic resonance imaging. Am J Cardiol. 2006;97(11):1661-1666
34. Voigt JU. Tissue doppler for the assessment of LV function - what makes sense? Z Kardiol. 2005;94(Suppl 4):38-42
35. Marwick TH. Measurement of strain and strain rate by echocardiography: ready for prime time? J Am Coll Cardiol. 2006;47(7):1313-1327
36. Butz T, van Buuren F, Mellwig KP, Langer C, Plehn G, Meissner A, Trappe HJ, Horstkotte D, Faber L. Two-dimensional strain analysis of the global and regional myocardial function for the differentiation of pathologic and physiologic left ventricular hypertrophy: A study in athletes and in patients with hypertrophic cardiomyopathy. International Journal of Cardiovascular Imaging. 2010 in press
37. Butz T, van Buuren F, Mellwig K. et al. Systolic and early diastolic left ventricular velocities assessed by tissue Doppler imaging in 100 top-level handball players. European Journal of Cardiovascular Prevention & Rehabilitation. 2010;17:342-348
38. Jarnert C, Melcher A, Caidahl K, Persson H, Ryden L, Eriksson MJ. Left atrial velocity vector imaging for the detection and quantification of left ventricular diastolic function in type 2 diabetes. Eur J Heart Fail. 2008;10(11):1080-1087
39. Zeng S, Zhou QC, Peng QH. et al. Assessment of regional myocardial function in patients with dilated cardiomyopathy by velocity vector imaging. Echocardiography. 2009;26(2):163-170
Author contact
![]() Corresponding author: Thomas Butz, MD, Department of Cardiology and Angiology, Marienhospital Herne, Ruhr-University Bochum, Hoelkeskampring 40, D-44625 Herne, Germany. Phone: +49 (0)2323 499-0; Fax: +49 (0)2323 499-360; Mail: Thomas.Butzde
Corresponding author: Thomas Butz, MD, Department of Cardiology and Angiology, Marienhospital Herne, Ruhr-University Bochum, Hoelkeskampring 40, D-44625 Herne, Germany. Phone: +49 (0)2323 499-0; Fax: +49 (0)2323 499-360; Mail: Thomas.Butzde