Impact Factor ISSN: 1449-1907

 Global reach, higher impact
Int J Med Sci 2011; 8(1):39-47. doi:10.7150/ijms.8.39 This issue Cite
Research Paper
MALDI-TOF MS Combined With Magnetic Beads for Detecting Serum Protein Biomarkers and Establishment of Boosting Decision Tree Model for Diagnosis of Colorectal Cancer
Chibo Liu1 ![]() , Chunqin Pan1, Jianmin Shen2, Haibao Wang3
, Chunqin Pan1, Jianmin Shen2, Haibao Wang3 ![]() , Liang Yong4
, Liang Yong4
1. Department of Clinical Laboratory, Taizhou Municipal Hospital, Taizhou, Zhejiang, 318000, China
2. Department of Radiology, Taizhou Municipal Hospital, Taizhou, Zhejiang, 318000, China
3. Hospital Office, Taizhou Municipal Hospital, Taizhou, Zhejiang, 318000, China
4. Department of Oncology, Taizhou Municipal Hospital, Taizhou, Zhejiang, 318000, China
Received 2010-9-25; Accepted 2010-12-20; Published 2011-1-3
Abstract
The aim of present study is to study the serum protein fingerprint of patients with colorectal cancer (CRC) and to screen protein molecules that are closely related to colorectal cancer during the onset and progression of the disease with Matrix-assisted laser desorption/ionization time-of-flight mass spectrometry (MALDI-TOF MS). Serum samples from 144 patients with CRC and 120 healthy volunteers were adopted in present study. Weak cation exchange (WCX) magnetic beads and PBSII-C protein chips reader (Ciphergen Biosystems Ins.) were used. The protein fingerprint expression of all the Serum samples and the resulted profiles between cancer and normal groups were analyzed with Biomarker Wizard system. Several proteomic peaks were detected and four potential biomarkers with different expression profiles were identified with their relative molecular weights of 2870.7Da, 3084Da, 9180.5Da, and 13748.8Da, respectively. Among the four proteins, two proteins with m/z 2870.7 and 3084 were down-regulated, and the other two with m/z 9180.5 and 13748.8 were up-regulated in serum samples from CRC patients. The present diagnostic model could distinguish CRC from healthy controls with the sensitivity of 92.85% and the specificity of 91.25%. Blind test data indicated a sensitivity of 86.95% and a specificity of 85%. The result suggested that MALDI technology could be used to screen critical proteins with differential expression in the serum of CRC patients. These differentially regulated proteins were considered as potential biomarkers for the patients with CRC in the serum and of the potential value for further investigation.
Keywords: MALDI, colorectal cancer, Biomarker, Protein, serum
Introduction
Colorectal cancer (CRC) is one leading cause of cancer death worldwide, with approximately 940 000 new cases and 500 000 deaths reported annually [1]. Colorectal cancer is also the second most common cancer in Europe [2.3]. Colorectal cancer was regarded as a multigenic disease and genetic abnormality plays a critical role in the development and progression of cancer cells besides the environmental factors [4]. The five year survival rate for colorectal cancer diagnosed at early stages is higher than 90%, while the five year survival rate for those diagnosed with widespread cancer stage is less than 10% [5]. Mortality from CRC is primarily due to its metastasis to the liver, accounting for over 70% of death cases [6]. Surgical resection currently provides the best way of cure. However, only 20% to 25% of CRC patients are eligible for surgery treatments, with recurrence rates range from 40% to 70 % [7, 8]. Early diagnosis of CRC is therefore of great importance.
Currently the sensitivity of the single biomarker based CRC diagnosis is low and complicated with a high probability of 'false-positives' cases. Carcinoembryonic antigen (CEA) is of proved benefits in prognosis and follow-up, but with limited sensitivity (30-40%) for early CRC diagnosis [9]. It should be noted that none of these existed serum markers could be used individually for screening for CRC with sufficient accuracy [30-34]. Endoscopic examination of the colon remains to be the gold standard for diagnosis, which is however invasive, unpleasant and carries associated risk of morbidity and mortality. Identification of high-risk patients using a less invasive test would decrease the numbers of such procedures required. Serial feacal occult blood testing was proved to be useful but suffers from high false-negative and false-positive rates [10; 11]. Additionally, stool DNA analysis for multiple targets showed a sensitivity of 71-91% in preliminary studies and larger studies were underway currently [12; 13]; however, a serum-based assay with equivalent sensitivity and specificity would be more feasible and acceptable to many patients.
A new method for diagnosing the early stage of CRC from serum samples is still an urgent need in clinical practice. In this study, we employed advanced proteomic approaches- Matrix-assisted laser desorption/ionization time-of-flight mass spectrometry (MALDI-TOF-MS) to identify relevant biomarkers that could replace invasive and nonspecific tests for the early diagnosis of CRC. This is a relatively new technique, which is superior to 2D-gel-electrophoresis in proteomic research because of its high sensitivity for proteins in low molecular weight range and the capability for high throughput screening, even for proteins with extreme characteristics (highly hydrophobic, acidic or basic). In this technique, whole serum was applied onto protein chips with different chromatographic affinities in a suitable binding buffer. Selectively bound proteins were retained on the surface and non-selectively bound proteins were washed off. In the mass spectrometer, a laser desorbed the bound proteins from the chip surface, which were subsequently detected in the TOF analyzer by their respective mass-to-charge ratios (m/z) [35, 36]. As whole patterns of proteins in the serum samples were analyzed, more than one biomarker would be detected. Combination of several biomarkers for the evaluation of a patient's status could lead to enhanced sensitivity and specificity [37, 38, 39, 40, 41].
In present study, we aimed to search differentially expressed proteins as potential biomarkers in colorectal cancer patients by MALDI-TOF MS. We used WCX magnetic beads to screen potential serum biomarkers for colorectal cancer detection. A total of 264 serum samples from colorectal cancer patients and healthy volunteers was collected and analyzed. A panel of differentially expressed proteins was advocated for biomarkers of diagnosis for colorectal cancer.
Materials and methods
Patients
Experiment was performed in Taizhou Municipal Hospital, Zhejiang, China in April 2010. Samples used were collected from 144 patients diagnosed with CRC (ages ranging from 37-76) and 120 controls (healthy volunteers, ages ranging from 33-68) at Taizhou Municipal Hospital and The First Affiliated Hospital of Medical College, Zhejiang University. All CRC patients were diagnosed according to combined clinical criteria, including Endoscopic examination of the colon, a combination of computed tomography (CT), positron emission tomography (PET), or both, and further confirmed by histopathological analysis (Table 1). The studies were approved by the local Ethics Committee of Taizhou Municipal Hospital, and had the informed consent of the patients and volunteers. The patients and serum samples were then divided into two groups: the ''training'' set and the blinded ''test'' set (Table 2).The blood samples were collected in 5 ml BD Vacutainers without anticoagulation and allowed to clot at room temperature for up to 1 hr; the samples were then centrifuged at 4℃ for 5 min at 10000 rpm. The sera were frozen and stored at -80℃ for future analysis.
Clinical Tumor-Node-Metastasis Stages of 144 patients with CRC
| Stage | No. of patients (Training set) | No. of patients (blind set) |
|---|---|---|
| DUKES A | 18 | 10 |
| DUKES B | 44 | 22 |
| DUKES C | 15 | 8 |
| DUKES D | 21 | 6 |
| Total | 98 | 46 |
Serum samples used in training and testing sets
| Samples | Training set | blind set | Total |
|---|---|---|---|
| Colorectal cancer | 98 | 46 | 144 |
| Healthy volunteers | 80 | 40 | 120 |
| Total | 178 | 86 | 264 |
WCX magnetic beads analysis
Sample pretreatments and proteomic analysis in the proteomic profiling analysis, the serum samples from the diseased and control groups were randomized, and blinded to investigators. Serum samples were pretreated with weak cation exchange (WCX) magnetic beads (SEDTM) (Beijing SED Science & Technology, Inc.). 10 μl of each serum sample was mixed with 20 μl of U9 solution (9 mol/L urea, 2% CHAPS, pH 9.0) in a 0.5 ml centrifuge-tube and incubated for 30 min at 4℃. Denatured serum samples were diluted with 370 μl binding buffer (50 mmol/L sodium acetate, 0.1% Triton X-100, pH 4.0). At the same time, 50 μl of WCX magnetic beads were placed in a PCR-tube and the tube was placed in a magnet separator for 1 min, after which the supernatant was discarded carefully by using a pipette. The magnetic beads were then washed twice with 100 μl binding buffer. Then 100 μl of the diluted serum sample was added to the activated magnetic beads, mixed and incubated for 1 h at 4℃, after which the beads were washed twice with 100 μl binding buffer.
MALDI-TOF MS
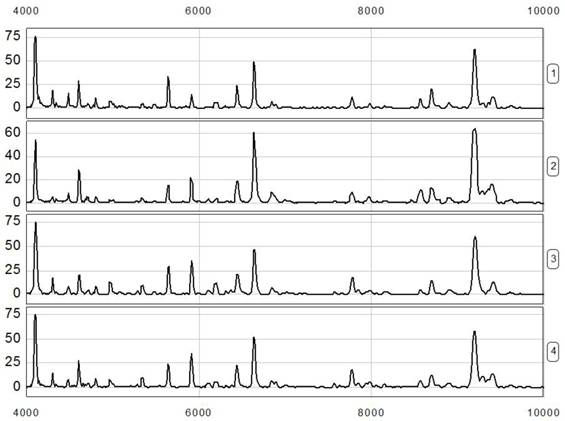
Following binding and washing, the bound proteins were eluted from the magnetic beads using 10 μl of 0.5% trifluoroacetic acid. Then, 5 μl of the eluted sample was diluted 1:2 fold in 5 μl of SPA (saturated solution of sinapinic acid in 50% acetonitrile with 0.5% trifluoroacetic acid). Two microliters of the resulting mixture was aspirated and spotted onto the gold-coated ProteinChip array. After air-drying for 5 minutes at room temperature, protein crystals on the chip were scanned with the ProteinChip (Model PBS IIc) reader (Ciphergen) to determine the masses and intensities of all peaks over the range m/z 1,000 to 50,000. The reader was set up as follows: mass range (1,000 to 50,000 Daltons), optimized mass range (1,000 to 20,000 Daltons), laser intensity (200), and sensitivity (9). Mass calibration was performed using an all-in-one peptide reference standard which contained vasopressin (1084.2Da), somatostatin (1637.9Da), bovine insulin β chain (3495.9 Da), human insulin recombinant (5807.6Da), hirudin (7033.6Da) (Ciphergen Biosystems, Fremont, CA, USA). The default background subtraction was applied, and the peak intensities were normalized using the total ion current from a mass charge of 1000 to 50,000Da. A biomarker detection software package (Ciphergen Biomarker Wizards, Ciphergen Biosystems, Inc) was used to detect protein peaks (Figure 1).
Spectra illustrating reproducibility of 4 separate analyses from the healthy controls of blood type O. It should be noted that the results were replicable and showed same protein peaks.
Protein peaks were selected based on a first pass of signal-noise ratio of 3 and a minimum peak threshold of 20% of all spectra. This process was completed with a second pass of peak selection at 0.2% of the mass window, and the estimated peaks were added. These selected protein peaks were averaged as clusters and were exported to a commercially available software package (Biomarker Patterns, Ciphergen Biosystems, Fremont, CA, USA) for further classification analysis.
Detection and Statistical Data Analysis
The data were analyzed by Ciphergen's ProteinChip Software (version 3.1). When the differentiated expressions of protein mass peak were found between the groups of colorectal cancer and healthy controls, these data in the Excel format were imported into the Biomarker Pattern Software (BPS) to construct the classification tree of CRC. The significantly different expression of protein mass peaks (P < 0.01) was listed by the software. Subsequently, the differentiated expressions of protein mass peak were analyzed by discriminatory analysis. Briefly, the dataset formed a "root node". The software tried to find the best peak to separate this dataset into two "child nodes" based on peak intensity. To achieve this, the software would identify the best peak and set a peak intensity threshold. If the peak intensity of a blind sample was lower than or equal to the threshold, this peak would go to the left-side child node. Otherwise, the peak would go to the right-side child node. After rounds of decision making, the training set was found to be discriminatory with the least error.
All the results were expressed as mean±S.D., and P values < 0.01 were considered statistically significant. Sensitivity was calculated as the ratio of the number of correctly classified diseased samples to the total number of diseased samples. Specificity was calculated as the ratio of the number of negative samples correctly classified to the total number of true negative samples.
Results
Detection of the Protein Peaks
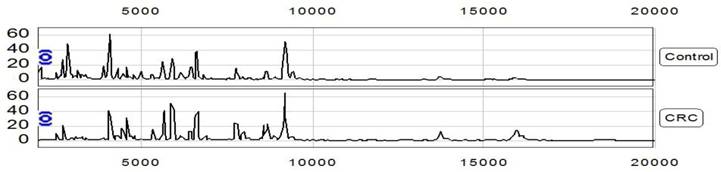
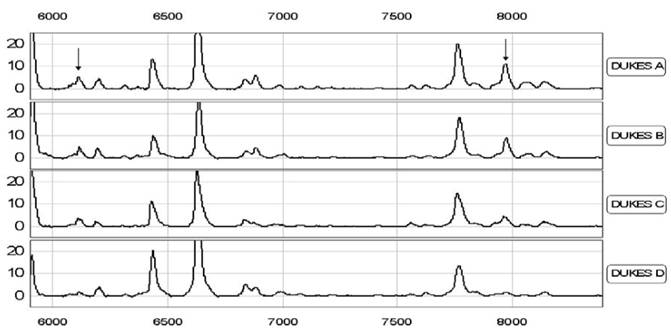
Proteomic data from the samples of the training set (consisting of 98 CRC and 80 controls) were analyzed with Biomarker Wizard software 3.1. Up to 252 protein peaks per spot were detected between m/z 1000 and m/z 50000 and this proved the effectiveness of the MALDI technology in separated detection of low molecular weight proteins (<2 0000) (Figure 2, 3). Additionally, we compared the spectrums from patients in different stages of CRC to evaluate the consistency of these biomarkers in early diagnosis. Interestingly we found that in serum from early stage patients at DUKES A showed two more m/z peaks at 6111 and 7978, which would diminish in serum samples from later stage patients (B, C, D) (Figure 4).
Representative protein spectrum of 2 separate analyses from CRC patient and control by MALDI-TOF MS combined with WCX magnetic beads, showing the protein m/z between 1000 and 20000. The figure showed some different peaks on the spectrum.
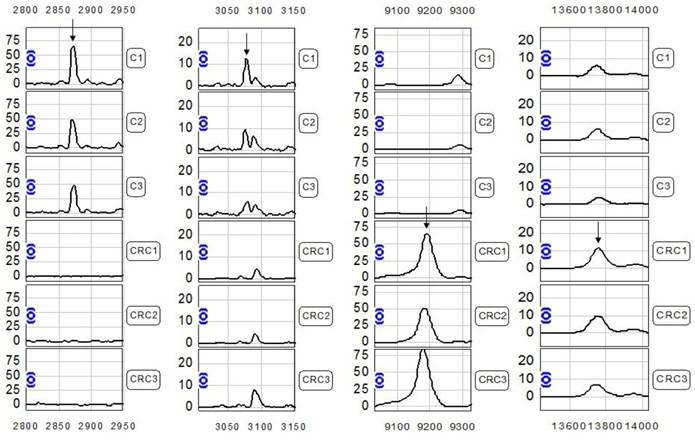
Differential expression of MALDI peak m/z 2870.7, 3084, 9180.5, 13748.8 in CRC and control sera. Each peak were represented by three control and three patient samples. The arrow indicated the peak difference.
The representative m/z peaks at 6111 and 7978 in different stage CRC patients with DUKES A and Patients with DUKES B DUKES C and DUKES D. This data suggested that in different stages of CRC patients, there could be differential regulation of biomarkers, and some of them could diminish in late stages.
Protein Fingerprint Analysis of Serum Samples in Patients with CRC and Healthy Controls
The protein profile of the serum samples from the 98 patients with CRC and the 80 healthy controls were extracted by magnetic beads and examined by MALDI-TOF-MS. The data were analyzed by Biomarker Wizard Version 3.1; 68 m/z peaks were found to discriminate the patients with CRC and healthy controls (Table 3). We were able to simultaneously analyze the protein profiles of 90 serum samples from both CRC patients and healthy volunteers. We identified several biomarkers specific for CRC (Figure 2, 3).
The 68 discriminating m/z peaks among CRC and normal controls
| m/z | p | m/z | p | m/z | p | m/z | p | m/z | p |
|---|---|---|---|---|---|---|---|---|---|
| 5635.3 | 2.0×10⁻⁸ | 11513.2 | 3.2×10⁻⁶ | 4599.1 | 1.2×10⁻⁵ | 9498.9 | 6.8×10⁻⁵ | 4112.6 | 8.6×10⁻⁴ |
| 4284.5 | 4.2×10⁻⁸ | 13748.8* | 3.5×10⁻⁶ | 6837.5 | 1.5×10⁻⁵ | 23415.8 | 7.9×10⁻⁵ | 4159.9 | 8.9×10⁻⁴ |
| 2870. 7* | 4.9×10⁻⁸ | 2915.8 | 4.6×10⁻⁶ | 2949.1 | 1.9×10⁻⁵ | 2744.9 | 2.5×10⁻⁴ | 7628.5 | 9.1×10⁻⁴ |
| 4476.5 | 7.3×10⁻⁸ | 5910.8 | 5.1×10⁻⁶ | 3400.7 | 2.1×10⁻⁵ | 2800.6 | 3.6×10⁻⁴ | 6435.3 | 9.5×10⁻⁴ |
| 9180.5* | 1.5×10⁻⁷ | 5703.4 | 5.8×10⁻⁶ | 3817.5 | 2.3×10⁻⁵ | 3377.9 | 4.5×10⁻⁴ | 7564.4 | 0.001 |
| 2894.6 | 2.2×10⁻⁷ | 3320.4 | 6.3×10⁻⁶ | 5905.1 | 2.4×10⁻⁵ | 6361. 8 | 5.1×10⁻⁴ | 3692.4 | 0.001 |
| 3084* | 4.5×10⁻⁷ | 3975.31 | 6.8×10⁻⁶ | 3219.4 | 2.9×10⁻⁵ | 14784.8 | 5.5×10⁻⁴ | 7839.8 | 0.001 |
| 4452.9 | 5.8×10⁻⁷ | 4647.4 | 7.1×10⁻⁶ | 6194.6 | 3.3×10⁻⁵ | 18378.9 | 5.7×10⁻⁴ | 9342.9 | 0.002 |
| 5213 | 6.4×10⁻⁷ | 9286.1 | 7.4×10⁻⁶ | 4703.3 | 3.8×10⁻⁵ | 4387.29 | 5.8×10⁻⁴ | 24092.6 | 0.004 |
| 4945.9 | 8.8×10⁻⁷ | 2152.5 | 8.9×10⁻⁶ | 2686.1 | 4.1×10⁻⁵ | 4350.5 | 6.5×10⁻⁴ | 4299.3 | 0.004 |
| 9713.5 | 9.8×10⁻⁷ | 15114.2 | 9.2×10⁻⁶ | 5545.4 | 4.5×10⁻⁵ | 5479.3 | 6.6×10⁻⁴ | 7941 | 0.006 |
| 8564.3 | 9.9×10⁻⁷ | 2545.7 | 9.4×10⁻⁶ | 13270.1 | 4.6×10⁻⁵ | 11076.0 | 7.0×10⁻⁴ | 15309 | 0.009 |
| 5809.6 | 1.1×10⁻⁶ | 8146.1 | 9.6×10⁻⁶ | 4985.2 | 6.2×10⁻⁵ | 6883.3 | 7.5×10⁻⁴ | 2821.5 | 0.009 |
| 3089.7 | 2.0×10⁻⁷ | 2756.8 | 9.9×10⁻⁶ | 5504.8 | 6.3×10⁻⁵ | N/A | N/A | N/A | N/A |
m/z means mass-to-charge ratio. P was generated by peak comparison between CRC and normal controls. Peaks labeled by * were selected as biomarkers for CRC diagnostic model.
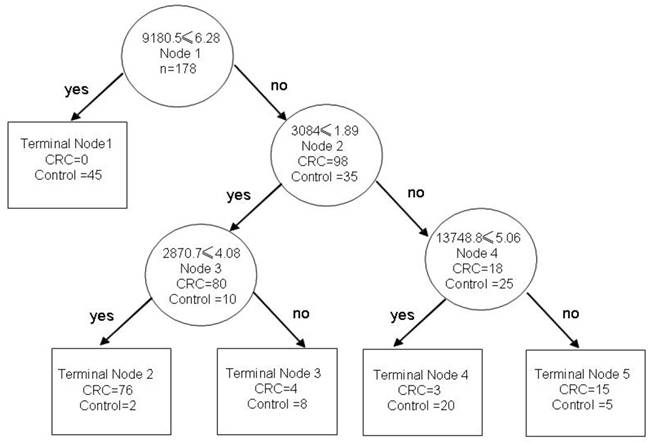
Four peaks, m/z 2870.7Da, 3084Da, 9180.5Da, 13748.8Da were then chosen to set up the decision tree [24-25] (Figure 5). At Node l, samples of m/z 9180.5 with peak intensities lower than or equal to 6.28 went to terminal Node 1, which had 45 healthy volunteer. Otherwise, samples entered Node 2, which had 35 healthy volunteers and 98 CRC samples. At Node 2, samples of m/z 3084 with peak intensities lower than or equal to 1.89 went to Node 3, which had 10 healthy volunteers and 80 CRC samples. The other samples entered terminal Node 4, which had 18 CRC samples and 25 healthy volunteers. At Node 3, samples of m/z 2870.7 with peak intensities lower than or equal to 4.08 went to terminal Node 2, which had 2 healthy volunteer samples and 76 CRC. The other samples went to terminal Node 3, which had 8 healthy volunteer samples and 4 CRC. At Node 4, samples of m/z 13748.8 with peak intensities lower than or equal to 5.06 went to terminal Node 4, which had 20 healthy volunteer samples and 3 CRC. The other samples entered terminal Node 5, which had 5 healthy volunteer samples and 15 CRC samples (Figure 5).
The decision trees of diagnostic model for CRC. Each node was represented with different m/z value and the diagnosis result went left or right depending on the detected peaks in test sample. The sensitivity and specificity of diagnosis would significantly increase when several biomarkers were combined in use.
Identification of Biomarker Pattern and Construction of Diagnostic Model
The decision tree could differentiate samples of CRC and healthy controls. Here, we used the biomarker wizard function of the ProteinChip software to identify clusters of peaks differentially presented in CRC serum samples compared with healthy controls. We obtained 68 different protein peaks in sera (showed in Table 3). To develop biomarker patterns for the diagnosis of CRC, the intensities of the protein peaks in the training set were submitted to BPS. A total of four peaks (2870.7, 3084, 9180.5, 13748.8) with the highest discriminatory power were automatically selected to construct a classification tree (Figure 5). Figure 5 shows the tree structure and sample distribution. The classification tree using the combination of the four peaks identified 98 CRC and 80 healthy controls with a calculated sensitivity of 92.85% and a specificity of 91.25%. In the blind test set, 34 out of 40 true control cases were correctly classified, and 40 out of 46 CRC samples were correctly classified as malignant. These results yield a sensitivity of 86.95% and a specificity of 85% (Table 4).
The prediction results of the diagnostic model for CRC
| Group | Samples | Cases | Correct-classed | Accurate % |
|---|---|---|---|---|
| Training set | CRC | 98 | 91 | 92.85 |
| control | 80 | 73 | 91.25 | |
| Blinding set | CRC | 46 | 40 | 86.95 |
| control | 40 | 34 | 85 |
Discussion
Mass spectrometry proteomics suggests that it is possible to detect molecular changes before the tumor is palpable. This technique has an important role in the diagnosis and monitoring of tumor progression. MALDI-TOF-MS is a newly-developed technique to evaluate proteins separately in past decade The WCX magnetic beads have established the expression of tumor protein in the serum specimens including lung, breast, and gastric cancer. Some of the proteins from magnetic beads have become the newly discovered markers for tumor diagnosis, with higher sensitivity and specificity than the former markers [14-18]. Currently, there are many noninvasive diagnostic methods of colorectal cancer such as the fecal occult blood test, the serum markers (e.g., CA199, CEA), immunologic and biochemistry test. But, the sensitivity and specificity of the current biomarkers in tumor diagnosis is low (usually less than 70%) and complicated by high return of 'false-positives' and 'false negatives' [19]. The data in this paper supported these past studies. These identified potential biomarkers would require validation with large numbers of patients, and if successful, could point to the development of more widely applicable immunoassays. Moreover, this is sensitive enough to early stage CRC detection, suggesting its prospective application in early diagnosis of CRC.
It is possible now to find new tumor markers for diagnosing and monitoring the occurrence and development of tumors given the progresses that the proteomics tools have achieved [20]. Some studies identified several potential biomarkers for CRC with these tools, but lack enough specificity and sensitivity [30-34]. Matrix-assisted laser desorption/ionization time-of-flight mass spectrometry (MALDI-TOF MS) is one useful tool for integrating separation and analysis of complex mixtures of proteins. Captured proteins are then analyzed by TOF-MS, generating a spectral map depicting approximations of the molecular weight (m/z) and relative concentration (intensity) of each protein (ion). WCX magnetic beads could capture more proteins in serum than strong anionic exchange magnetic beads, especially in the low molecular weight range. It has been extensively applied to the researches about tumor markers [21.22], such as prostate cancer [23.24], breast carcinoma [25], bladder cancer [26], hepatocellular carcinoma [27], nasopharyngeal cancer [28, 42] and so on [29]. The initial serum proteome profiles of CRC were generated by using the combination of MALDI-TOF MS and WCX magnetic beads as well as pattern recognition software in our study. The 68 different protein peaks between CRC and control subjects suggested that the broad pathological changes occurred in serum proteome of CRC patients, though unidentified proteins may also be involved.
In conclusion, MALDI-TOF MS combined with magnetic beads is one useful tool for integrating separation and analysis of complex mixtures of proteins. With the panel of four selected biomarkers, we achieved high sensitivity and specificity for the detection of CRC. It should be noted that in this study each M/Z value may represent many peptides of similar molecular weights. We expect to explore the structure and function of these protein biomarkers for CRC in future studies.
Acknowledgements
The work was funded by The National High Technology Research and Development Program of China 2006AA02090406B and Zhejiang Medicine, health and Science grants 2010KYB127. The author also thanks the department of Laboratory Medicine, Taizhou Municipal Hospital for supports.
Conflict of Interest
The authors have declared that no conflict of interest exists.
References
1. Global cancer rates could increase by 50%to 15 million by 2020. WHO. http://www.who.int/mediacentre/news/releases/2003/pr27/en/
2. Ferlay J, Autier P, Boniol M. et al. Estimates of the cancer incidence and mortality in Europe in 2006. Ann Oncol. 2007;18:581-92
3. Davila RE, Rajan E, Baron TH. et al. ASGE guideline: colorectal cancer screening and surveillance. Gastrointest Endosc. 2006;63:546-57
4. Karakosta A, Golias Ch, Charalabopoulos A. et al. Genetic models of human cancer as a multistep process. Paradigm models of colorectal cancer, breast cancer, and chronic myelogenous and acute lymphoblastic leukaemia. J Exp Clin Cancer Res. 2005;24(4):505-14
5. O'Connell JB, Maggard MA, Ko CY. Colon cancer survival rates with the new American Joint Committee on Cancer sixth edition staging. J Natl Cancer Inst. 2004;96(19):1420-5
6. Australian Institute of Health, Welfare (AIHW), Australasian Association of Cancer Registries (AACR). Cancer in Australia. Cancer in Australia 2001; Cancer series number 28. Canberra: Australian Institute of Health and Welfare. 2004:6-25
7. Huh JW, Park YA, Lee KY. et al. Recurrences after local excision for early rectal adenocarcinoma. Yonsei Med J. 2009;50:704-8
8. Faerden AE, Naimy N, Wiik P. et al. Total mesorectal excision for rectal cancer: difference in outcome for low and high rectal cancer. Dis Colon Rectum. 2005;48:2224-2231
9. Fletcher RH. Carcinoembryonic antigen. Ann Intern Med. 1986;104:66-73
10. Hardcastle JD, Thomas WM, Chamberlain J. et al. Randomised, controlled trial of faecal occult blood screening for colorectal cancer. Results for first 107,349 subjects. Lancet. 1989;1:1160-4
11. Kronborg O, Fenger C, Olsen J. et al. Randomised study of screening for colorectal cancer with faecal-occult-blood test. Lancet. 1996;348:1467-71
12. Ahlquist DA, Skoletsky JE, Boynton KA. et al. Colorectal cancer screening by detection of altered human DNA in stool: feasibility of a multitarget assay panel. Gastroenterology. 2000;119:1219-1227
13. Dong SM, Traverso G, Johnson C. et al. Detecting colorectal cancer in stool with the use of multiple genetic targets. J Natl Cancer Inst. 2001;93:858-865
14. Leslie A, Pratt NR, Gillespie K. et al. Mutations of APC, K-ras, and p53 are associated with specific chromosomal aberrations in colorectal adenocarcinomas. Cancer Res. 2003;63:4656-4661
15. Slack GW, Wizniak J, Dabbagh L. et al. Flow cytometric detection of ZAP-70 in chronic lymphocytic leukemia: correlation with immunocytochemistry and Western blot analysis. Arch Pathol Lab Med. 2007;131:50-56
16. von Eggeling F, Davies H, Lomas L. et al. Tissue-specific microdissection coupled with ProteinChip array technologies: applications in cancer research. Biotechniques. 2000;29:1066-1070
17. Zhukov TA, Johanson RA, Cantor AB. et al. Discovery of distinct protein profiles specific for lung tumors and pre-malignant lung lesions by SELDI mass spectrometry. Lung Cancer. 2003;40:267-279
18. Vlahou A, Schellhammer PF, Mendrinos S. et al. Development of a novel proteomic approach for the detection of transitional cell carcinoma of the bladder in urine. Am J Pathol. 2001;158:1491-15021
19. Barillari P, Ramacciato G, de Angelis R. et al. The role of CEA, TPA and CA 19-9 in the early detection of recurrent colorectal cancer. Int J Colorectal Dis. 1989;4:230-233
20. Rodland KD. Proteomics and cancer diagnosis: the potential of mass spectrometry. Clin Biochem. 2004;37:579-583
21. Conrads TP, Hood BL, Issaq HJ, Veenstra TD. Proteomic patterns as a diagnostic tool for early-stage cancer: a review of its progress to a clinically relevant tool. Mol Diagn. 2004;8:77-85
22. Petricoin EF, Liotta LA. SELDI-TOF-based serum proteomic pattern diagnostics for early detection of cancer. Curr Opin Biotechnol. 2004;15:24-30
23. Walsh PC. Serum proteomic patterns for detection of prostate cancer. J Urol. 2003;169:1592
24. Malik G, Ward MD, Gupta SK, Trosset MW, Grizzle WE. Serum levels of an isoform of apolipoprotein A-II as a potential marker for prostate cancer. Clin.Cancer.Res. 2005;11:1073-1085
25. Zeidan BA, Townsend PA. SELDI-TOF proteomic profiling of breast carcinomas identifies clinicopathologically relevant groups of patients similar to previously defined clusters from cDNA expression. Breast Cancer Res. 2008;10:107
26. Langbein S, Lehmann J, Harder A, Steidler A, Michel MS. Protein profiling of bladder cancer using the 2D-PAGE and SELDI-TOF-MS technique. Technol.Cancer Res.Treat. 2006;5:67-72
27. Paradis V, Degos F, Dargère D, Pham N, Belghiti J. Identification of a new marker of hepatocellu1ar carcinom a by serum protein profiling of patients with chronic liver diseases. Hepatology. 2005;41:40-47
28. Cho WC, Yip TT, Ngan RK, Yip TT, Podust VN. ProteinChip array profiling for identification of disease- and chemotherapy-associated biomarkers of nasopharyngeal carcinoma. Clin Chem. 2007;53:241-250
29. Kozak KR, Amneus MW, Pusey SM, Su F, Luong MN. Identification of biomarkers for ovarian cancer using strong anion-exchange ProteinChips: potential use in diagnosis and prognosi. Proc.Natl.Acad.Sci.USA. 2003;100:12343-12348
30. Roessler M, Rollinger W, Palme S, Hagmann ML, Berndt P, Engel AM, Schneidinger B, Pfeffer M, Andres H, Karl J, Bodenmüller H, Rüschoff J, Henkel T, Rohr G, Rossol S, R?sch W, Langen H, Zolg W, Tacke M. Identification of nicotinamide N-methyltransferase as a novel serum tumor marker for colorectal cancer. Clin. Cancer Res. 2005;11(18):6550-7
31. Ma Y, Peng J, Huang L, Liu W, Zhang P, Qin H. Searching for serum tumor markers for colorectal cancer using a 2-D DIGE approach. Electrophoresis. 2009;30(15):2591-9
32. Roessler M, Rollinger W, Mantovani-Endl L, Hagmann ML, Palme S, Berndt P, Engel AM, Pfeffer M, Karl J, Bodenmüller H, Rüschoff J, Henkel T, Rohr G, Rossol S, R?sch W, Langen H, Zolg W, Tacke M. Identification of PSME3 as a novel serum tumor marker for colorectal cancer by combining two-dimensional polyacrylamide gel electrophoresis with a strictly mass spectrometry-based approach for data analysis. Mol Cell Proteomics. 2006;5(11):2092-2101
33. Ma Y, Peng J, Liu W, Zhang P, Huang L, Gao B, Shen T, Zhou Y, Chen H, Chu Z, Zhang M, Qin H. Proteomics identification of desmin as a potential oncofetal diagnostic and prognostic biomarker in colorectal cancer. Mol Cell Proteomics. 2009;8(8):1878-90
34. Alessandro R, Belluco C, Kohn EC. Proteomic approaches in colon cancer: promising tools for new cancer markers and drug target discovery. Clin Colorectal Cancer. 2005;4(6):396-402
35. Cho WC. Research progress in SELDI-TOF MS and its clinical applications. Chin J Biotech. 2006;22(6):871-876
36. Cho WC. Proteomics technologies and challenges. Genomics Proteomics Bioinformatics. 2007;5:77-85
37. Liao CC, Mehta A, Ward NJ, Marsh S, Arulampalam T, Norton JD. Analysis of post-operative changes in serum protein expression profiles from colorectal cancer patients by MALDI-TOF mass spectrometry: a pilot methodological study. World J Surg Oncol. 2010;8:33
38. Cho WC, Cheng CH. Oncoproteomics: current trends and future perspectives. Expert Rev Proteomics. 2007;4:401-410
39. Ma Y, Zhao M, Zhong J, Shi L, Luo Q, Liu J, Wang J, Yuan X, Huang C. Proteomic profiling of proteins associated with lymph node metastasis in colorectal cancer. J Cell Biochem. 2010;110(6):1512-9
40. Cho WC. Contribution of oncoproteomics to cancer biomarker discovery. Mol Cancer. 2007;6:25
41. Liao CC, Ward N, Marsh S, Arulampalam T, Norton JD. Mass spectrometry protein expression profiles in colorectal cancer tissue associated with clinico-pathological features of disease. BMC Cancer. 2010;10:410
42. Cho WC, Yip TT, Yip C. et al. Identification of serum amyloid A protein as a potentially useful biomarker to monitor relapse of nasopharyngeal cancer by serum proteomic profiling. Clin Cancer Res. 2004;10:43-52
Author contact
![]() Corresponding author: Chibo Liu, Department of Clinical Laboratory, Taizhou Municipal Hospital, Taizhou, Zhejiang, 318000, China, Tel.: 86-576-8885-8213, Fax: 86-576-8885-8024, E-mail address: liuchibocom. Haibao Wang, Hospital Office, Taizhou Municipal Hospital, Taizhou, Zhejiang, 318000, China, Tel.: 86-576-8885-8001, Fax: 86-576-8885-8024, E-mail address: wanghb1962com.
Corresponding author: Chibo Liu, Department of Clinical Laboratory, Taizhou Municipal Hospital, Taizhou, Zhejiang, 318000, China, Tel.: 86-576-8885-8213, Fax: 86-576-8885-8024, E-mail address: liuchibocom. Haibao Wang, Hospital Office, Taizhou Municipal Hospital, Taizhou, Zhejiang, 318000, China, Tel.: 86-576-8885-8001, Fax: 86-576-8885-8024, E-mail address: wanghb1962com.