Impact Factor ISSN: 1449-1907

 Global reach, higher impact
Int J Med Sci 2009; 6(1):43-50. doi:10.7150/ijms.6.43 This issue Cite
Research Paper
Multivariate explanatory model for sporadic carcinoma of the colon in Dukes' stages I and IIa
J.M. Villadiego-Sánchez1, M. Ortega-Calvo2 ![]() , R. Pino-Mejías3, A. Cayuela4, P. Iglesias-Bonilla2, F. García-de la Corte2, J.M. Santos-Lozano2, José Lapetra-Peralta2
, R. Pino-Mejías3, A. Cayuela4, P. Iglesias-Bonilla2, F. García-de la Corte2, J.M. Santos-Lozano2, José Lapetra-Peralta2
1. 061 Accident and Emergency Service. Huelva. Spain.
2. Department of Family Medicine, Primary Care Division of Seville and CIBER Fisiopatologia Obesidad y Nutrición (CB06/03). Instituto de Salud Carlos III. Spain.
3. Department of Statistics and Operations Research. University of Seville. Spain.
4. Research Support Unit. Virgen del Rocio University Hospital. Seville. Spain.
Received 2008-9-10; Accepted 2009-1-29; Published 2009-1-30
Abstract
Objective: We obtained before an explanatory model with six dependant variables: age of the patient, total cholesterol (TC), HDL cholesterol (HDL-C), VLDL cholesterol (VLDL-C), alkaline phosphatase (AP) and the CA 19.9 tumour marker. Our objective in this study was to validate the model by means of the acquisition of new records for an additional analysis.
Design: Non-paired case control study.
Setting: Urban and rural hospitals and primary health facilities in Western Andalusia and Extremadura (Spain).
Patients: At both the primary care facilities and hospital level, controls were gathered in a prospective manner (n= 275). Cases were prospective and retrospective manner collected on (n=126).
Main outcome measures: Descriptive statistics, logistic regression and bootstrap analysis.
Results: The AGE (odds ratio 1.02; 95% CI 1.003-1.037) (p= 0.01), the TC (odds ratio 0.986; 95% C.I. 0.980-0.992) (p< 0.001) and the CA 19.9 (odds ratio 1.023; 95% C.I. 1.012- 1.034) (p<0.001) were the variables that showed significant values at logistic regression analysis and bootstrap. Berkson's bias was statistically assessed.
Conclusions: The model, validated by means of logistic regression and bootstrap analysis, contains the variables AGE, TC, and CA 19.9 (three of the original six) and has a level 4 over 5 according to the criteria of Justice et al. (multiple independent validations) [Ann. Intern. Med.1999; 130: 515].
Keywords: Multivariate explanatory model, non-paired case control study, sporadic carcinoma
Introduction
Since publication of the work of Rose et al. [1] on the relationship between plasma cholesterol and malignant neoplasia of the colon, there have been multiple bibliographical references for and against this association [2-12]. Presently, it is not possible to confirm a clear relationship between the appearance of sporadic colorectal carcinoma (SCRC) and the diminution of the plasma cholesterol or some of its fractions, nor have different groups of patients (genetically or clinically) been discriminated with SCRC and the existence of the said lipid marker. An abundance of bibliographic sources in favour of the prognostic value of tumour markers, both in pre-clinical and therapeutic phases, exists [13-17]. Carcinoembryonic antigen (CEA) is a glycoprotein normally present in plasma in very small amounts (on the order of nanograms) that increases in the presence of occult adenocarcinomas. Its usefulness in colorectal carcinoma [13-14] is well described both in the diagnostic phase and in clinical follow up [15]. CA 19.9 is a tumour-associated antigen that is present in tissues that contain mucin or in the circulation, and that is located in the sialylated Lewis A blood group antigen [16-18]. The individuals with the Lewis a-b genotype cannot synthesize this antigen (an approximated 5% of the general population).It was first used for the diagnosis and follow up of carcinoma of the pancreas, but its usefulness has also been demonstrated in SCRC [17-18]. Elevated values have also been observed in cases of stomach carcinoma, carcinoma of the gall bladder and/or biliary tract, and hepatomas. Up until now it has not been considered as a valid instrument of SCRC screening because of its low sensitivity. It should be useful, indeed, an instrument that mix these three plasmatic markers (cholesterol or its fractions, CEA and CA 19.9) at early SCRC stages. We published a work previously on the relationships that could exist between both types of substances at the time of the clinical appearance of SCRC [18]. We obtained an explanatory model with six dependent variables: age of the patient, total cholesterol (TC), HDL cholesterol (HDL-C), VLDL cholesterol (VLDL-C), alkaline phosphatase (AP) and the CA 19.9 tumour marker. Our objective in this article has been to validate the model by means of the acquisition of new records for an additional analysis.
PATIENTS AND METHODS
The study was designed as a non-paired case control study. The new cases and controls has been collected over a period of approximately three years from both urban and rural hospitals and health centers in Western Andalusia and Extremadura (Spain). The investigators who collected information in the health centers (primary care controls) were family doctors with more than three years work in their respective facilities.
The investigators who collected at the hospital level (cases and controls) were specialists and training residents in internal medicine, neurology, allergy, and clinical pharmacology, and also family doctors in training o recycling periods. The objectives of the investigation were explained to all participating physicians and they were provided with record sheets that contained the exclusion and inclusion criteria.
At both the primary care and hospital level, controls were gathered in a prospective manner. Only one hospital control (Virgen del Rocío University Hospital) was retrospective. The primary care controls were collected in the following health centers: Pilas (Seville-Rural), Camas (Seville-Rural), Huerta del Rey (Seville-Urban) and Mérida (Badajoz-Rural). The cases pertaining to this new sampling were gathered in a retrospective manner from the archives of the Virgin Macarena and Virgin del Rocío Hospitals of Seville, the General Hospital of Mérida and also from the Juan Ramon Jiménez Hospital in Huelva by consulting clinical histories, chosen in a random manner, over a period of five years (2000-2004).
The inclusion and exclusion criteria used in this part of the study were the same as for the first part of the investigation [18]. The diagnostic criteria for inclusion of the cases were positive endoscopy and biopsy; those of exclusion were the existence of remote metastasis, a severe dislipaemia, coexistence with another neoplasia, hereditary polyposis syndrome, hereditary non polyposis colorectal cancer, intestinal inflammatory disease, non-epithelial neoplasias and the immunodeficiency disorders. Consequently Dukes' stage IIA was the maximum SCRC stage seen [18].
For the controls, the inclusion criterion was the absence of SCRC. The exclusion criteria were any type of malignant neoplastic disease, existence of pre-malignant colorectal lesions, a severe disorder of lipid metabolism and the immunodeficiency disorders. Neither colonoscopies nor opaque enemas were performed in the controls. Two years after the selection of the controls in primary care, a complete telephone follow-up was conducted to determine if any controls had developed SCRC in the clinical phase.
The total cholesterol was measured using the TECHNICON RA system. The HDL cholesterol was measured by the precipitant method. In the original sample [18], LDL cholesterol was calculated using the Friedewald formula [LDL = TC - HDL - TG/5] (where TG = Triglycerides). The VLDL was also calculated using the Friedewald formula [VLDL = TG/5]. The TG levels were determined by means of colorimetric enzymatic test consisting of enzymatic hydrolysis of the TG and the later measurement of glycerol by means of colorimetry [18]. CA 19.9 (sialylated Lewis blood group carbohydrate antigen) was determined means of a “sandwich” technique similar to that used in the measurement CEA [13, 17-18].
The information gathered in this article dates from 1992 until 2004. The definitive sample size (n = 401) was obtained by uniting the original sample [18] with the multicenter sample gathered in this validation work. Quality control was carried out by two different investigators with special interest in the records gathered by the different collaborators. The fruit of that qualitative examination was the rejection of a total of 9 controls and 3 cases at the defining moment of the construction of the data package. The fundamental cause was the lack of fulfilment of the inclusion criteria. The assembly of the previous data package with a total of 93 records (53 cases and 40 controls) in DBase IV format was combined with the new data package in an EXCEL format and with a total of 308 records was made. The package in EXCEL format was exported to SPSS format for its later statistical analysis, and the quality controls were also made at this stage.
Statistical analysis
An initial study was made on the set of records to obtain centralization and dispersion measures. Excessive values were considered as outliers; they were included in the final quality control because they could not be excluded based on the eligibility criteria. A normality study of the quantitative variables in the combined sample was carried out, including both the controls and the cases, by means of the Kolmogorov-Smirnov test [19]. A bivariate analysis was made by means of the Mann-Whitney U- test [19]. A logistic regression (LR) analysis was carried out and did not determine a departure from the model obtained in our previous study [18], with the fact of being case or control as dependent variable and the variables age in years (AGE), total cholesterol (TC), HDL fraction (HDL), VLDL fraction (VLDL), alkaline phosphatase (AP), and the CA 19.9 marker as predictors [20]. Sample size was taken into account [21]. A first analysis was made on the “raw” data package. The selection of variables was always backward. In the variables in which lost information surpassed 20%, we decided to impute values by means of the SPSS Program (linear interpolation).
Validity
We tried “to repeat” the observational analysis of our previous study [18] with the application of non-conditional LR to the new data package to validate it in accordance with the criteria of Justice et al [22]. In order to appreciate if Berkson's bias [23] (internal validity) [24] influenced our observations and results, we designed a double study with LR, first constructing a statistical model with the controls gathered in primary care and the cases, and later, by constructing another model with the controls gathered in the hospitals and with the same cases. Finally, both models would be compared. If Berkson's bias existed and following the ideas of Feinstein et al, the controls gathered in primary care would tend to elevate the odds ratio (OR) in a structural manner in the designs of cases and controls [23]. As a final step in the validity study, a “bootstrap” analysis was applied to the complete sample of cases and controls [25-26]. By means of program R the following computer algorithm was applied: 1) Generation of 2000 “bootstrap” samples. 2) For each sample, a model of LR was adjusted by means of backwards selection, calculating the area under the receiver operating characteristic curve (ROC). 3) Summary of each one of the set of 2000 “bootstrap” coefficients [25-26].
RESULTS
The final sample was composed of a total of 401 elements (126 cases and 275 controls; control/case ratio = 2.18; prospective / retrospective ratio = 4.41). Men accounted for 188 (46.9%) and women 213 (53.1%) of the patients (Pearson's Chi-square test; p > 0.05). The centers of origin are shown in Table 1. There were no significant differences when contrasting sex and center of origin (Pearson's Chi-square test; p>0.05). The descriptive statistic is gathered in Table 2.
Reference Centers. Data Reference Centers: 1. Pilas Health Center (Seville), 2. Mérida Health Center, General Hospital of Mérida (Badajoz). 3. Camas Health Center (Seville). 4. Virgen Macarena University Hospital (VMUH) (Seville) 5. Juan Ramon Jiménez Hospital (Huelva). 6. Huerta del Rey Health Center (Seville). 7. Virgen del Rocío University Hospital (VRUH) (Seville).
| Center | Total | ||||||||
|---|---|---|---|---|---|---|---|---|---|
| 1 | 2 | 3 | 4 | 5 | 6 | 7 | |||
| Var. case | control | 60 | 36 | 14 | 114 | 32 | 18 | 1 | 275 |
| Case | 0 | 12 | 0 | 64 | 5 | 0 | 45 | 126 | |
| Total | 60 | 48 | 14 | 178 | 37 | 18 | 46 | 401 | |
NOTE: The Pilas Health Center had the VRUH as a hospital reference center and the Huerta del Rey Health Center had VRUH and VMUH.
Estimators of Centralization and Dispersion of Continuous Variables.
| N | Minimum | Maximum | Average | Mean Standard Error | Standard deviation | |
|---|---|---|---|---|---|---|
| AGE | 401 | 24 | 94 | 63.42 | .744 | 14.890 |
| TC | 399 | 81 | 313 | 197.70 | 2.140 | 42.737 |
| HDL | 346 | 17 | 176 | 45.65 | .925 | 17.202 |
| LDL | 191 | 38 | 235 | 131.68 | 2.508 | 34.656 |
| VLDL | 228 | 10 | 216 | 54.90 | 3.617 | 54.623 |
| TG | 264 | 25 | 566 | 121.21 | 4.276 | 69.482 |
| AP | 357 | 29 | 500 | 154.67 | 4.292 | 81.104 |
| CA19_9 | 380 | .1 | 162.0 | 19.938 | 1.2423 | 24.2168 |
AGE-age in years; TC- total cholesterol; HDL-high density lipoprotein; LDL-low density lipoprotein; VLDL-very low density lipoprotein; TG-triglycerides; AP-alkaline phosphatase.
The values obtained for the Kolmogorov-Smirnov test (study of normality of continuous variables) are shown in Table 3.
Normality Analysis of the Continuous Variables. Kolmogorov-Smirnov test for a sample.
| N | Normal Parameters (a,b) | Z of Kolmogoro & Smirnov | Sig. asintotic. (bilateral) | ||
|---|---|---|---|---|---|
| Media | Standard deviation | ||||
| AGE | 401 | 63.42 | 14.890 | 1.496 | * .023 |
| TC | 399 | 197.70 | 42.737 | .649 | .794 |
| HDL | 346 | 45.65 | 17.202 | 2.227 | * .000 |
| LDL | 191 | 131.68 | 34.656 | 1.075 | .198 |
| VLDL | 228 | 54.90 | 54.623 | 4.664 | * .000 |
| TG | 264 | 121.21 | 69.482 | 2.543 | * .000 |
| AP | 357 | 154.67 | 81.104 | 1.146 | .145 |
| CA19_9 | 380 | 19.938 | 24.2168 | 4.035 | * .000 |
a. The distribution of contrast is Normal.
b. Calculated from the data.
AGE-age in years; TC- total cholesterol; HDL-high density lipoprotein; LDL-low density lipoprotein; VLDL-very low density lipoprotein; TG-triglycerides; AP-alkaline phosphatase. (* significant values - non normal variables - see discussion).
Table 4 shows the application of the Mann-Whitney U-test to the continuous variables to study differences between the distributions between the cases and controls. The adjustment of the non-conditional logistic regression model, on the total data set, is shown in Table 5. The same type of analysis, but with the primary care and hospital controls are shown in Tables 6 and 7, respectively. The interaction [CA 19.9 x AGE] is in Table 8. The “bootstrap” analysis is shown in Figures 1 and 2. The HDL, LDL, and VLDL variables were dealt with by imputed values (HDL-1, VLDL-1 and LDL-1) because the loss of information was superior to 20% (linear interpolation - SPSS).
Statistics of contrast (a) for comparison of continuous variables, according to whether cases or controls.
| Mann-Whitney U-test | Sig. asintotic. (bilateral) | |
|---|---|---|
| AGE | 14285.500 | * .005 |
| TC | 10815.500 | .* 000 |
| HDL | 7097.000 | * .000 |
| LDL | 1835.000 | .* 000 |
| VLDL | 2881.500 | .* 000 |
| TG | 7779.500 | .154 |
| AP | 14037.000 | .702 |
| CA19_9 | 10417.500 | * .000 |
AGE-age in years; TC- total cholesterol; HDL-high density lipoprotein; LDL-low density lipoprotein; VLDL-very low density lipoprotein; TG-triglycerides; AP-alkaline phosphatase. (* significant values).
Final Model Adjusted with Raw Values.
| B | Wald | Degree of freedom (df) | Sig. | Exp(B) | 95.0% C.I. for EXP(B) | |||
|---|---|---|---|---|---|---|---|---|
| Lower | Upper | |||||||
| Step 1(a) | AGE | .020 | 5.563 | 1 | .018 | * 1.020 | 1.003 | 1.037 |
| TC | -.014 | 19.695 | 1 | .000 | * .986 | .980 | .992 | |
| CA19_9 | .023 | 17.946 | 1 | .000 | * 1.023 | 1.012 | 1.034 | |
| Constant | .073 | .009 | 1 | .926 | 1.076 | |||
AGE-age in years; TC- total cholesterol. (* odds ratios).
Logistic regression made with hospital cases and controls of primary care.
| B | S.E. | Wald | df | Sig. | Exp(B) | 95.0% C.I. for EXP(B) | |||
|---|---|---|---|---|---|---|---|---|---|
| Lower | Upper | ||||||||
| Step 1(a) | AGE | .035 | .010 | 11.420 | 1 | .001 | * 1.036 | 1.015 | 1.057 |
| TC | -.017 | .004 | 17.891 | 1 | .000 | * .983 | .975 | .991 | |
| CA19_9 | .045 | .010 | 19.738 | 1 | .000 | * 1.046 | 1.026 | 1.067 | |
| Constant | .267 | .973 | .075 | 1 | .784 | 1.306 | |||
AGE-age in years; TC- total cholesterol. (* odds ratios).
Logistic regression made with hospital cases and controls.
| B | S.E. | Wald | df | Sig. | Exp (B) | 95.0% C.I. for EXP (B) | |||
|---|---|---|---|---|---|---|---|---|---|
| Lower | Upper | ||||||||
| Step 1(a) | AGE | .013 | .009 | 1.888 | 1 | ** .169 | * 1.013 | .994 | 1.032 |
| TC | -.012 | .003 | 12.475 | 1 | .000 | * .988 | .982 | .995 | |
| CA19.9 | .015 | .005 | 7.393 | 1 | .007 | * 1.015 | 1.004 | 1.026 | |
| Constant | .892 | .887 | 1.011 | 1 | .315 | 2.440 | |||
AGE-age in years; TC- total cholesterol. (* odds ratios). (** non significant values - Berkson´s biass assessment - Feinstein et al. 1986. [23]).
Logistic regression with the variable interaction (CA19.9 x AGE). Cases and controls of primary care and hospital.
| B | S.E. | Wald | df | Sig. | Exp (B) | 95.0% C.I. for EXP (B) | |||
|---|---|---|---|---|---|---|---|---|---|
| Lower | Upper | ||||||||
| Step 1(a) | AGE | .049 | .013 | 14.486 | 1 | .000 | * 1.051 | 1.024 | 1.078 |
| CA19.9 | .129 | .036 | 12.687 | 1 | .000 | * 1.138 | 1.060 | 1.222 | |
| TC | -.013 | .003 | 18.409 | 1 | .000 | * .987 | .981 | .993 | |
| CA19.9xAGE | .002 | .001 | 9.391 | 1 | .002 | * .998 | .997 | .999 | |
| Constant | - 2.035 | 1.064 | 3.656 | 1 | .056 | * .131 | |||
AGE-age in years; TC- total cholesterol. (* odds ratios).
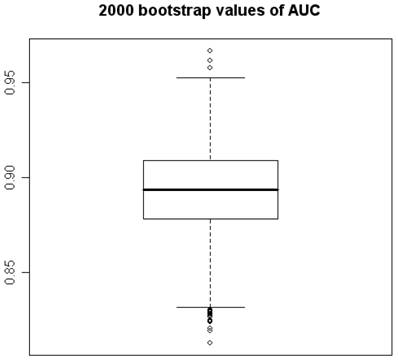
2000 bootstrap values of Area under the ROC Curve.
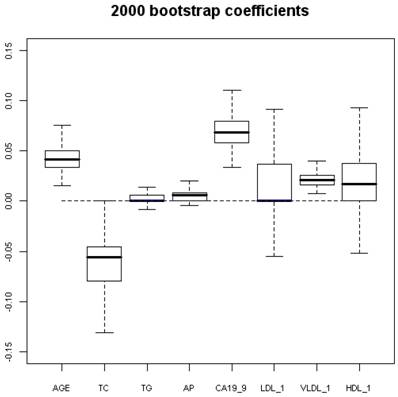
2000 bootstrap coefficients. AGE-age in years; TC- total cholesterol; TG-triglycerides; AP-alkaline phosphatase; LDL-low density lipoprotein; VLDL-very low density lipoprotein; HDL-high density lipoprotein.
DISCUSSION
We have made an investigation to try to validate a multivariate explanatory model of the diagnosis of SCRC in Dukes' stages I and IIa using non-conditional logistic regression and “bootstrap” analyses. The original model with six variables was published [18] and was the departure point for the accomplishment of this work. The new sample size was included 401 elements and was composed of 126 cases and 275 controls. The design was non-paired. A total of 308 new records pertain to the validation phase of the work. The original sample was gathered entirely in the Virgen Macarena University Hospital of Seville (VMUH) from 1992 to 1995 in a prospective manner. From the validation phase, 11 cases and 74 controls of the sample also pertain to this center. The new cases were compiled in a retrospective manner from the general archives of clinical histories, always respecting the inclusion criteria (period 2000-2004), and the new controls were gathered in a prospective manner in the Internal Medicine Service during 2003. From 2001 to 2003, the rest of the cases and controls in this investigation were collected in the centers of origin (Table 1). Therefore, the time limits of our data collection were from 1992 to 2004. Throughout this time, the inclusion and exclusion criteria were scrupulously respected. The general ratio of prospective / retrospective elements was 4.41/1, which we found acceptable. Each health center and each hospital were connected to each other in such a way that the users of the primary care centers were admitted in the tertiary care centers, thereby fulfilling a precept of case-control studies. The ratio between these was 2.18 controls for each case, which has a level of acceptable internal efficiency with regard to design.
The descriptive results of the complete data package are shown in Table 2. Among them, it is possible to highlight the arithmetic means of the cases that are lower than those of the controls with regard to the lipid variables referred to, except for the triglycerides. After the application of the Kolmogorov-Smirnov test, it was possible to consider the variables: TC (n = 399), LDL (n = 191), and AP (n = 357) as normal (Table 3). For the rest of the variables, the null hypothesis of normal distribution was rejected [19].
There was no significant difference in the distribution by sex between the cases and the controls (Pearson's Chi-Square test, p = 0.20). Neither was there a significant difference found in the distribution by sex and reference centers (Pearson's Chi-Square test, p = 0.26). We believe that these results show the sample to be representative and do not demonstrate origin imbalances. We applied non-conditional LR to try to obtain a model adjusted with the new sample size by means of the backward selection of variables. As mentioned previously, the program used was SPSS. We could obtain a new model that contained the AGE variable, the CA19.9 variable, and the TC (total cholesterol) variable. Thus, three of the six original variables (Table 5) [18] could enter in the new model. That was a quite acceptable result for us because it conserved half of the predictors and because it was “coherent” with the clinical and biological reality. The age and CA 19.9 were “predisposing” for the condition with OR's of 1.020 and 1.023 respectively and the rate of total cholesterol adopted an opposite direction with an OR of 0.986, all of them reaching statistical significance (p<0.05). It is possible to affirm that this adjusted and definitive model has displayed a level of validity of 4 over 5 according to the criteria of Justice et al. [22] because it contains multiple independent validations.
The clinical and biological value of CA 19.9 is a fact stated previously in the bibliography [17, 18]. Its elevation is much more frequent in malignant processes than in benign ones, above all in pancreatic, colorectal, pulmonary, liver, and ovarian neoplasias. A very interesting piece of evidence for the control of the classification bias of this article (with regard to the selection of the controls) has been shown in the work Varol et al [27], where the normality of CA 19.9 in patients with chronic cardiac insufficiency was demonstrated. In other publications, CA 19.9 has not shown as much diagnostic capacity for SCRC when attempting to include it in multivariate models [28]. In this investigation, CEA was not included as an explanatory variable because it did not form part of the original model [18].
Another very interesting work on the importance of plasma lipid levels in SCRC is that of Notarnicola et al [29], in which an association was found between the capacity to develop to metastasis and elevated levels of TC and LDL in patients with SCRC. Those findings are consistent with our results because a selection criterion of the cases was that no remote metastasis had developed (Dukes' stage IIA at the most). Our cases tend to present with low lipids. We preferred the Dukes classification [18] to the Astler-Coller [30] classification because of the long period of data collection of our investigation and because it was the one that we used from the beginning. Notarmicola et al. have also published very suggestive findings on the enzymatic changes in the mevalonate pathway in patients with SCRC depending on the location of the tumour in the large intestine [31].
The use of LR for the observational studies continues to being authenticated by the bibliography, showing similar results if it is compared with the propensity scores [32] or with the artificial neural networks [33]. The use of a method of manual selection of variables is a fact also more and more stated in the bibliography, mainly if the multivariate model is complemented later with “bootstrapping” as it was in our study [34].
When two different models were generated, the first made with controls gathered in primary care along with all the cases, and the second made with the controls gathered in the hospitals and the same cases, the first showed significant values in the three predictors studied whereas the second only showed them in two of these. First was more efficient and it had higher OR's than the second, as Feinstein et al [23] predicted when studying the epidemiological nature of Berkson's bias (Tables 6 and 7).
The exploration of interactions showed a significant result in the AGE x CA 19.9 (p<0.005) variable (Table 8). The predisposing effect for the condition was potentiated for both variables at the individual level (OR of 1.051 for AGE and OR of 1.138 for CA 19.9) with respect to the model obtained with raw values, but the OR of the variable interaction (AGE x CA 19.9) had an opposite direction. Greenland [35] provides an explanation on the fact that, as in our model of interaction, the coefficient of the product variable is different from those of the individually contemplated variables. The coefficient of the interaction variable reflects only the net balance between the different types of answer implied in the interaction. A coefficient > 0 only implies that the synergistic answers are more frequent than the antagonistic and the competitive answers, but not that these latter ones are absent. A coefficient < 0 only implies that the antagonistic and competitive answers are more frequent than the synergistic, but not that these latest ones do not exist. A coefficient = 0 implies that the synergistic answers are balanced with the antagonistic and competitive answers, but not that the interactions are absent.
Using program R, 2000 “bootstrap” samples were generated from the real data with using the six variables of the original model, considering the variables HDL, VLDL, and LDL in their versions with imputed values HDL-1, VLDL-1 and LDL-1. The coefficients obtained by means of non-conditional LR with the method of backward selection of variables were studied. The AGE, the TC, and CA 19.9 were also the variables that showed significant values (Figures 1 and 2). Although upper limit of the TC confidence interval reaches to null (Figure 2) we accept it like a significant value. VLDL_1 is a quite linearly built variable at this research and so we do not give any importance to its bootstrap analysis (Figure 2). The results obtained for the area under the ROC curve (AUC) were also very interesting, the box figure shows that more than half of the values are superior to 0.9 (Figure 1) (in fact they are extraordinary ; we have checked them several times). . These findings grant in the first place a high degree of internal validity to our work and give strength to our observations. Although “bootstrapping” is not a technique of measurement of external validity, it is one of internal validity, which in epidemiological terms is prior to the external [22, 24, 36].
In short, we have obtained an explanatory model of malignant sporadic neoplasia of the colon in Dukes' stages I and IIA by means of validation of a previous original model [18]. The model, validated by means of logistic regression and “bootstrap” analysis, contains the variables AGE [18], TC [1,3-6] and CA 19.9 [17, 37-39] (three of the original six) and has a level 4 over 5 according to the criteria of Justice et al. [22] (it means multiple independent validations). The existence of Berkson's bias has been statistically assessed [23].
Acknowledgements
The Research in this study was financed partly by the Ministry of Education and Science (Spain), Project (MEC) MTM2004-01433.
We are grateful to the following family physicians: Isabel Fernández, Angeles Tarilonte, Beatriz Gómez, Victoriano Macías, Manuel Muriel and Angel González.
Conflict of Interest
The authors have declared that no conflict of interest exists.
References
1. Rose G, Blackburn H, Keys A. et al. Colon cancer and blood cholesterol. Lancet. 1974;1:181-3
2. Law M.R, Thompson S.G. Low serum cholesterol and the risk of cancer: an analysis of the published prospective studies. Cancer Causes Control. 1991;2:253-261
3. Kritchevsky S.B, Kritchevsky D. Serum cholesterol and cancer risk: An epidemiologic perspective. Annu. Rev. Nutr. 1992;12:391-416
4. Kono S, Ikeda H, Yanai F, Yamamoto M, Shigematsu T. Serum lipids and colorectal adenoma among male self-defence officials in northern Kyushu, Japan. International Journal of Epidemiology. 1990;19:274-278
5. Winawer SJ, Flehinger BJ, Buchalter J, Herbert E, Shike M. Declining serum cholesterol levels prior to diagnosis of colon cancer. A time - trend, case - control study. JAMA. 1990;263:2083- 2085
6. Fernandez Bañares F, Esteve M, Navarro E, Cabre E, Boix J, Abad Lacruz A. et al. Changes of the mucosal n3 and n6 fatty acid status occur early in the colorectal adenoma-carcinoma sequence. Gut. 1996;38:254-259
7. Törnberg S.A, Holm L.E, Carstensen J.M, Eklund G.A. Risk of cancer of the colon and rectum in relation to serum cholesterol and beta-lipoprotein. N.Engl.J.Med. 1986;315:1629-1633
8. Yamada K, Araki S, Tamura M, Sakai I, Takahashi Y, Kashihara H, Kono S. Relation of serum total cholesterol, serum triglycerides and fasting plasma glucose to colorectal carcinoma in situ. International Journal of Epidemiology. 1998;27:794-798
9. Jacobs D, Blackburn H, Higgins M, Redd D, Iso H, MacMillan G. et al. Report of the Conference on Low Blood Cholesterol:Mortality associations. Circulation. 1992;86:1046-1060
10. Park SK, Joo JS, Kim DH, Kim YE, Kang D, Yoo KY. Association of serum lipids and glucose with the risk of colorectal adenomatous polyp in men: a case-control study in Korea. J Korean Med Sci. 2000;15:690-695
11. Eichholzer M, Stahelin HB, Gutzwiller F, Ludin E, Bernasconi F. Association of low plasma cholesterol with mortality for cancer at various sites in men: 17-years follow-up of the prospective Basel study. Am J Clin Nutr. 2000;71:569- 574
12. Shor R, Wainstein J, Oz D, Boaz M, Matas Z, Fux A, Halabe A. Low HDL levels and the risk of death, sepsis and malignancy. Clin Res Cardiol. 2008;97:227- 233
13. Sugarbaker P.H. Carcinoembryonic antigen (CEA) assays in obstructive colorectal cancer. Ann. Surg. 1976;184:752-757
14. Yuste A.L, Aparicio J, Segura A, López-Tendero P, Girones R, Pérez Fidalgo J.A, Díaz R, Calderero V. Analysis of clinical prognostic factors for survival and time to progression in patient with metastatic colorectal cancer treated with 5-fluoroucil-based chemotherapy. Clin Colorrectal Cancer. 2003;4:231-234
15. Sanz Rubiales A, García Alvarez G. Significance of carcinoembryonic antigen in the follow up of colorectal cancer. Medicina Clínica (Barcelona). 1998;110:277- 278
16. Bannura G, Cumsille MA, Contreras J, Barrera A, Melo C, Soto D. Carcinoembryonic antigen (CEA) as an independent prognostic factor in colorectal carcinoma. Rev Méd Chile. 2004;132:691-700
17. Filella X, Molina R, Piqué J.M, García-Valdecasas J.C, Grau J.J, Novell F. et al. Use of Ca 19.9 in the early detection of recurrences in colorectal cancer: comparison with CEA. Tumor Biology. 1994;15:1- 6
18. Mendez Mora J.L, Ortega Calvo M, Cayuela Dominguez A, Villadiego Sanchez J.M, Barros Pérez M.M, Cantillana Martinez J. CA 19.9 and HDL-cholesterol behaviour in a sporadic colorectal carcinoma sample. An Med Interna (Madrid). 2004;21:227- 230
19. Moran J.L, Solomon P. Worrying about normality. Critical Care and Resuscitation. 2002;4:316-319
20. Sánchez-Cantalejo Ramírez E. Regresión Logística en Salud Pública (Serie Monografías nº 26). Granada: Escuela Andaluza de Salud Pública. 2000
21. Ortega-Calvo M, Cayuela-Dominguez A. Unconditioned logistic regression and sample size: a bibliographic review. Rev.Esp.Salud Publica. 2002;76:85- 93
22. Justice A.C, Covinsky K.E., Berlin J.A. Assessing the generalizability of prognostic information. Ann. Intern. Med. 1999;130:515- 524
23. Feinstein AR, Walter SD, Horwitz RI. An analysis of Berkson's bias in case-control studies. J Chronic Dis. 1986;39:495- 504
24. Delgado-Rodriguez M, Llorca J. Bias. J Epidemiol Community Health. 2004;58:635- 641
25. Efron B. Nonparametric estimates of standard error: The jackknife, the bootstrap and other methods. Biometrika. 1981;68:589-599
26. Efron B, Tibshirani RJ. An introduction to the bootstrap. New York: Chapman & Hall. 1993
27. Varol E, Ozaydin M, Dogan A, Kosar F. Tumour marker levels in patients with chronic heart failure. Eur J Heart Fail. 2005;7:840-843
28. Carpelan-Holmstrom M, Louhimo J, Stenman UH, Alfthan H, Jarvinen H, Haglund C. Estimating the probability of cancer with several tumor markers in patients with colorectal disease. Oncology. 2004;66:296-302
29. Notarnicola M, Altomare DF, Correale M, Ruggieri E, D'Attoma B, Mastrosimini A, Guerra V, Caruso MG. Serum lipid profile in colorectal cancer patients with and without synchronous distant metastases. Oncology. 2005;68:371-374
30. Astler V.B, Coller F.A. The prognostic significance of direct extension of carcinoma of the colon and rectum. Ann Surg. 1954;139:846-852
31. Caruso MG, Notarnicola M. Biochemical changes of mevalonate pathway in human colorectal cancer. Anticancer Res. 2005;25:3393-3397
32. Shah BR, Laupacis A, Hux JE, Austin PC. Propensity score methods gave similar results to traditional regression modeling in observational studies: a systematic review. J Clin Epidemiol. 2005;58:550- 559
33. Song JH, Venkatesh SS, Conant EA, Arger PH, Sehgal CM. Comparative analysis of logistic regression and artificial neural network for computer-aided diagnosis of breast masses. Acad Radiol. 2005;12:487-495
34. Austin PC, Tu JV. Automated variable selection methods for logistic regression produced unstable models for predicting acute myocardial infarction mortality. J Clin Epidemiol. 2004;57:1138-1146
35. Greenland S. Introduction to Regression Models. In: (ed.) Rothman KJ, Greenland S. Modern Epidemiology, 2nd edition. Philadelphia: Lippincot Williams & Wilkins. 1998:385-386
36. Altman DG, Andersen PK. Bootstrap investigation of the stability of a Cox regression model. Statistics in Medicine. 1989;8:771-783
37. Macchia V, Gargiulo M, Terracciano D, Di Carlo A, Mariano A. Cyclic AMP - dependent secretion of Ca 19-9 by LS174T human colon carcinoma cells. Oncol Rep. 2002;9:387- 391
38. Terracciano D, Mariano A, Macchia V, Di Carlo A. Analysis of glycoproteins in human colon cancers, normal tissues and in human colon carcinoma cells reactive with monoclonal antibody NCL-19-9. Oncol Rep. 2005;14:719- 722
39. Nozoe T, Rikimaru T, Mori E, Okuyama T, Takahashi I. Increase in both CEA and CA19-9 in sera is an independent prognostic indicator in colorectal carcinoma. J Surg Oncol. 2006;94:132- 137
Author contact
![]() Correspondence to: Manuel Ortega-Calvo. Avda. de la Cruz del Campo Nº 36.Bl.1 2ºA. 41005 - Sevilla (Spain). Email: ortegacalvoes
Correspondence to: Manuel Ortega-Calvo. Avda. de la Cruz del Campo Nº 36.Bl.1 2ºA. 41005 - Sevilla (Spain). Email: ortegacalvoes