Impact Factor ISSN: 1449-1907
- Issue 8; 2026
- Issue 7; 2026
- Issue 6; 2026
- Issue 5; 2026
- Issue 4; 2026
- Volume 23; 2026
- Past Issues
- Editorial Board
- Cover Images
- Index & Coverage
- Cover Suggestion
- Special Issues
Introduction
Material and Methods
Results and Discussion
Conclusion and Remarks
Acknowledgements
References

 Global reach, higher impact
Int J Med Sci 2009; 6(1):18-27. doi:10.7150/ijms.6.18 This issue Cite
Research Paper
Transporter Molecules influence the Gene Expression in HeLa Cells
Waldemar Waldeck1, Ruediger Pipkorn2, Bernhard Korn3, Gabriele Mueller1, Matthias Schick3, Katalin Tóth1, Manfred Wiessler4, Bernd Didinger5, Klaus Braun4 ![]()
1. German Cancer Research Center, Division of Biophysics of Macromolecules, INF 580, D-69120 Heidelberg, Germany
2. German Cancer Research Center, Central Peptide Synthesis Unit, INF 580, D-69120 Heidelberg, Germany
3. German Cancer Research Center, Genomics and Proteomics Core Facilities, INF 580, D-69120 Heidelberg, Germany
4. German Cancer Research Center, Dept. of Medical Physics in Radiology, INF 280, D-69120 Heidelberg, Germany
5. University of Heidelberg, Dept. of Radiation Oncology, INF 400; D-69120 Heidelberg, Germany
Received 2008-10-12; Accepted 2008-12-16; Published 2008-12-18
Abstract
Progresses in biology and pharmacology led to highly specific bioactive substances, but their poor bioavailability at the site of action is a result of their physico-chemical properties. Various design approaches for transport carrier molecules facilitating the cellular entry of bioactive substances could help to reach their molecular target in cells and tissues. The transfer efficacy and the subsequent pharmacological effects of the cargo molecules are well investigated, but the investigations of effects of the carrier molecules themselves on the target cells or tissues remain necessary. A special attention should be paid to the differential gene expression, particularly in the interpretation of the data achieved by highly specific active pharmaceutical products. After application of transmembrane transport peptides, particularly the pAnt and also the HIV-1 Tat, cells respond with a conspicuous altered gene expression of at least three genes. The PKN1 gene was induced and two genes (ZCD1 and BSG) were slightly repressed. The genes and the chromosomes are described, the moderate differential gene expression graphed, and the ontology is listed.
Keywords: Drug Delivery, facilitated Transport, Transport Peptides, Carrier Molecules
Introduction
The transport of negatively charged or high molecular weight agents across the cellular membrane is generally highly ineffective; their concentrations at the (intracellular) target site tend to be far from optimal. The resulting pharmacological effect is often barely detectable, and covered from influences of additional surrounding factors.
To assist nucleic acid-based (= negatively charged) or macromolecular therapeutics in traversing the cellular membrane, a number of drug delivery systems (viral and non-viral) have been evaluated over the years. In principle, virus-based systems harbour a great potential due to their high transfer efficiency, and some of them already entered clinical evaluation for the treatment of severe genetic disorders, like Cystic Fibrosis (CF) and X-linked severe combined immunodeficiency (SCID) [1-6]. The biomedical safety hazard associated with viral vectors, however, as well as several antigenic and immunological problems, substantially limited the progression of such “natural” transporters in clinical trials [2, 7-11].
To provide an alternative for such effective viral transfection agents, significant effort has been put in establishing non-viral transporter systems [12], as well as in understanding their membrane translocation mechanisms [13-16] and in evaluating the biological effect of the transported cargo [17-19]. Currently, the following protein fragments harbour a protein transduction domain (PTD) and, are used as transport peptides: HIV-1 Tat [17, 20, 21], VP22 [22, 23], and pAnt, known under the name Penetratin™ [24, 25]. An arginine nonamer, the cationic R9 peptide, has also capable to facilitate the cellular uptake [26, 27]. Their physicochemical properties are well-documented and their ability to cross cellular membranes is beyond controversy [15, 16, 28-31, 31]. The pharmacological effects resulting from the application of the transport peptides (TPs) themselves, however, have not been primarily considered thus far. Little is known about their intrinsic pharmacological and physiological properties.
In our lab, gene expression experiments with different transport peptides (TP) in HeLa cells stably expressing EGFP indicated an increase of EGFP fluorescence upon the application of the transporters alone particularly after pAnt application (table 1), revealing an unwanted and unexpected gene expression. Comparative analyses with different concentrations of TPs showed an influence on the behaviour of the cells, which may alter the biochemical effect of the transported cargo and which could consequently influence the interpretation of the results.
List of the examined transport peptides. The table displays the amino acid sequences of the investigated transport peptides (TP) and transporter molecules used in the study. The synthesis and application are described in methods.
| PTD | Amino Acid sequence | Acc. No.: |
|---|---|---|
| HIV-Tat | YGRKKRRQRRRC*) | P04610 |
| pAnt | RQIKIWFQNRRMKWKKC*) | X03790 |
| TP6287 | MTRQTFWHRIKHKC*) | Q8ZHK1 |
| TP6288 | KMTRQTWWHRIKHKC*)**) | - |
| Polymer | ||
| HPMA | N-(2-Hydroxypropyl)-Methacrylamide | - |
*) Single letter code
**) variant with an additional W
For understanding the intrinsic pharmacological effects of TPs, we investigated to what extent the HIV-derived Tat fragment (residues 48-60) and the Drosophila-derived antennapedia homeodomain protein fragment pAnt (residue 43-58) affected gene expression in HeLa cells. In addition, two novel transmembrane transporters termed TP6287 and TP6288 (table 1), have been included in these analyses. TP6287 and TP6288 are peptide fragments derived from the DNA sequence of the non-pathogenic Yersina pestis strain 91001 [32]. As additional controls, the effects of the HiPerfect Transfection Reagent (Qiagen, Cat No. 301704) and of the prototypic polymeric hydrophilic N-(2-hydroxypropyl)methacrylamide drug carrier (pHPMA) [33-35] were evaluated. With microarray technology and quantitative RT-PCR, we assessed the transcriptional responses resulting from the incubation of HeLa cells with the transporter molecules [36].
Material and Methods
Peptide Synthesis and Purification
For solid phase synthesis of the peptides RQIKIWFQNRRMKWKK [pAnt43-58] and YGRKKRRQRRR [HIV-1 Tat48-60] and KKMTRQTWWHRIKHKC [TP6288] and KMTRQTFWHRIKHKC [TP6287] we employed the Fmoc (9-fluorenyl-methyloxycarbonyl) methodology [37, 38] in a fully automated multiple synthesizer (Syro II from Multi Syntech Germany). As coupling agent 2-(1H-Benzotriazole-1-yl)-1,1,3,3-tetramethyluroniumhexafluoro-phosphate (HBTU) was used. The following side chain protecting groups were employed: Boc(tert-butyloxycarbonyl) for Lys and Trp, Trityl(triphenylmethane) for Gln and Asn and Pbf (2,2,4,6,7-Pentamethyldihydrobenzofurane-5-sulfonyl) for Arg. Fmoc-Lys(Dabcyl) was purchased from Merck Biosciences GmbH, Germany. The synthesized peptides were cleaved and deprotected from the solid support by treatment with 90% trifluoroacetic acid, 8% tri-isopropyl silane and 2% water (v/v/v/) for 2.5 h at room temperature. The products were precipitated in ether. The crude material was purified by preparative HPLC on a Kromasil 100-10C 18 µm reverse phase column (30 × 250mm) using an eluent of 0.1% trifluoro acetic acid in water (A) and 80% acetonitrile in water (B). The peptide was eluted with a successive linear gradient of 10% B to 80% B in 30 min at a flow rate of 23 ml/min. The fractions corresponding to the purified protein were lyophilized. The purified material was characterized with analytical HPLC and matrix assisted laser desorption mass spectrometry (MALDI-MS).
Synthesis and characterization of pHPMA
The HPMA copolymer used in this study was described by Lammers [39]. The weight- and number-average molecular weights (Mw and Mn) and the polydispersity (Mw/ Mn) of the copolymer after their fractionation (on Superose 4B/6B columns) were determined by size exclusion chromatography on an Äkta Explorer (Amersham Biosciences), equipped with UV, a differential refractometer (Shodex R-72) and a multiangle light scattering detector (DAWN DSP-F). The average molecular weights of the copolymer, which will be further referred to as pHPMA, was 31 kD and its polydispersity was 1.3.
Cell Culture
Adherent HeLa cells were grown in a 5% CO2 humidified atmosphere at 37°C and passaged in RPMI1640 medium without phenol red, supplemented with 10% fetal calf serum (FCS) (Biochrom, Germany). For expression profiling studies the cells were treated with the different cell penetrating peptides: fragments from Drosophila pAnt43-58 or viral HIV-1 Tat48-60, the polymer HPMA or the avirulent bacterial fragments ([TP6287 and TP6288] respectively) for 1 hour. The TPs were applied to 1 × 10⁶ cells per probe. We added 0.1 µl TP (1 mg/ ml) diluted to 100 µl medium (without FCS) to the HeLa cells in 2 ml medium. As a control, cells were transfected using HiPerfect Transfection Reagent (Qiagen, Hilden, Germany) as proposed by the manufacturer.
Fluorimeter Measurements
HeLa cells were stably transfected with a GFP mutant (D2-GFP [BD, Clontech]) with 2 hours half life. The D2-GFP cells were used to determine the relative amount GFP-expression in cells by spectroscopic fluorescence measurements. These HeLa D2-GFP cells were trypsinized after treatment and adjusted to a cell number of 1 million cells per ml with Hank´s solution. In each single experiment identical cell numbers were used.
Fluorescence emission spectra measurements were accomplished with an SLM-AMINCO 8100 fluorescence spectrometer (SLM, Urbana, IL) using a 150 W Xenon lamp. The excitation in the fluorimeter was fixed at 475 nm; the emission spectra were scanned from 500 to 620 nm with 4 nm monochromator slit width for excitation and emission. Integration time was 0.2 sec; scan mode was performed at fixed High Voltage for photomultiplier (PMT) 1HV = 1000, for PMT 2HV= 350. The measurements show a change of the EGFP gene expression after treatment with identical amounts of transporter molecules. The estimated relative fluorescence showed a dependence on the applied carrier molecules.
RNA Isolation
The transporter molecules were applied to the culture medium thus was removed after 2h and after 24 h, cells were washed with Hank´s. The RNA was extracted with the Qiagen RNeasy Plus Kit (Qiagen Hilden, Germany) briefly as follows: The cells were washed twice with Hank´s solution and extracted with 1ml of extraction solution. The cells were scraped and transferred into micro-centrifuge-tubes, and then the cells were homogenized by squeezing though a needle 0.9 × 12 mm followed by centrifugation through a gDNA-Eliminator column for 30 sec at 10.000 rpm in the micro centrifuge. An equal volume of 70% ethanol was added to the eluate mixed with a pipet and applied to the RNeasy spin column. This was eluted with 700 µl RW1-buffer by centrifugation for 15 sec at 10000 rpm followed by addition of RPE-buffer 2 × 500 µl and centrifugation at 10000 rpm for 15 sec. Then the column was centrifuged to dryness and eluted by centrifugation with water (2 × 30 µl) for 30 sec and 2 min respectively.
BeadArray gene expression analysis
We used an integrated genomics profiling and computational biology based strategy to identify the key genes and gene clusters whose expression are altered after exposure to different transmembrane TPs. Samples were amplified reversly transcribed using 100 ng of total RNA as input material by the method of Van Gelder [40]. Amplified RNA synthesis was performed using the Illumina®TotalPrep™RNA AmplificationKit (Inc., San Diego, CA) following the manufacturer's instructions. Labeling was achieved by incorporation of biotin-16-UTP at a ratio of 1:1 with unlabeled UTP. Labeled, amplified material (1.25 µg per array) was hybridized to the Illumina HumanRef-8 v2 BeadChip, (Illumina, Inc., San Diego, CA) arrays were scanned with an Illumina BeadArray Reader (confocal scanner) and array data were processed and analyzed with Illumina's BeadStudio Data Analysis Software according the definitions of the Illumina's (ILL) data as well as the ILL annotations.
Real Time PCR
Total RNA preparations, as used for chip analysis, were also taken for cDNA synthesis with Roche's Transcriptor High Fidelity cDNA Synthesis Kit. Following the manufacturers instructions 3µg RNA per sample were reversely transcribed using anchored-oligo(dT)18 primer in 20µl total volume for 30 minutes at 50°C. The final concentration of the unpurified cDNA was adjusted to 25ng/µl assuming 100% efficiency. “No RT” controls (same setup without reverse transcriptase) have been prepared for each total RNA as well.
The real-time RT-PCR was carried out in triplicates using a Roche LightCycler 480 system with a 384-well block and the software version 1.2. The 10µl reaction consisted of 25ng of transcribed RNA (1µl), 1pmol Universal Probe (0.1µl), 50pmol each of forward + reverse primer (0.5µl), water (3.4µl) and 2× LightCycler 480 Probes Master mix. The PCR-program also was used according to the manufacturer's instructions. “No template controls” and “No RT-controls” (for each cDNA-sample) showed no contamination probably affecting the results. The normalized ratio was calculated using the Relative Quantification module with the 24 hours untreated control as “Calibrator”, and the HPRT1 as reference gene resulting in individual efficiency of every single gene.
Results and Discussion
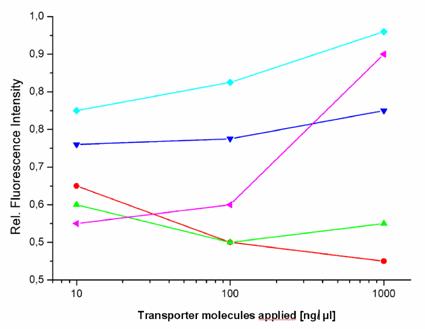
Transfection reagents facilitate the introduction of active agents e.g. negatively charged molecules, like polyanionic nucleic acids, into target cells, in order to express a therapeutic or a reporter gene. The aim is to transfer cargos across cellular membranes in a safe and proper way while circumventing and avoiding undesired reactions. However, as already described in the introduction section, the choice of the transfection technology has a slight impact on the gene expression of the EGFP reporter in HeLa cells (figure 1).
Fluorometric measurements of EGFP expression. The graph shows the influence of the investigated transport carriers on the expression of EGFP in stably transfected HeLa cells (relative fluorescence intensity) after the incubation time of 72 hours. The peptides [TP6287 ( ); TP6288 (
 ); pAnt (
 ); HIV-Tat (
 )] and the polymer [pHPMA (
 )] were applied in the range of 10 - 1000 ng/µl final concentration as described in methods.
This lead us to compare the influence of the various transport methods on gene expression. We investigated how 5 different molecules and one prototypic polymeric carrier influence a gene expression response. At first, we selected a series of induced and repressed genes more than twofold, selected by microarray analysis, which resulted after control with RT-PCR in a moderate influence on gene expression. The bacterially-originated peptides (TP6287 and TP6288) and the virus-derived peptide showed hardly detectable effects on gene expression.
We found that the pAnt molecule had a little effect on gene expression and affected the expression of 19 genes, the HIV-1 Tat peptide the expression of 18 genes and the two Yersina-derived delivery systems TP6287 8 genes and TP6288 7 genes respectively. In addition, also the copolymer pHPMA, which is known to be inert, non-immunogenic and non-toxic, appeared to affect the transcription of 18 genes in HeLa cells marginally, but below the subthreshold of 5%. These findings suggest that one should realize that the implementation of transfection agents and transporter molecules have some impact on the gene expression patterns, when analyzing the efficacy and the genetic consequences of targeted gene therapy in vitro (and in vivo).
Microarray Study
Differential Gene Expression
Differential gene expression profiling is routinely used to detect genes expressed under conditions such as cancer or cellular stress response but cannot determine the global players involved in such complex phenotypes. Integration of the gene expression profiling with specific modulation of gene expression in relevant signalling pathway models can identify complex pharmacological functions controlled by the characterized genes. The different quality controls (QC1-QC5) of the expression analysis using human Sentrix-8 V2 (1740115221 - 1740115260) show a positive gradient hybridization signal response, low signals in the stringency controls, a successful staining of the test samples, clear negative controls and noise, and an expected expression of housekeeping genes. The samples were very homogeneous (figure 2). The expression study was performed threefold.
Correlation data of microarray data after 2 h and 24 h application of the transport peptides. The figure shows the graph of the sample correlations of the raw microarray data. The time groups are highly similar. Samples split primarily according to time points. Pearson correlation (1-r); r = Pearson correlation coefficient.
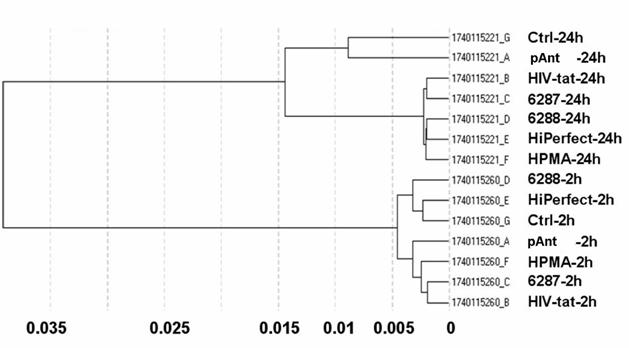
The obtained data proved reliable. The primary separation into the defined times points: 2 and 24 hours exhibit a samples's clustering for the time being. The probe IDs show no visible change in the gene expression 2 hours after treatment with the transporter molecules. The 24 hours probes show a moderately changed gene expression indicated by the Pearson correlation as illustrated in figure 2.
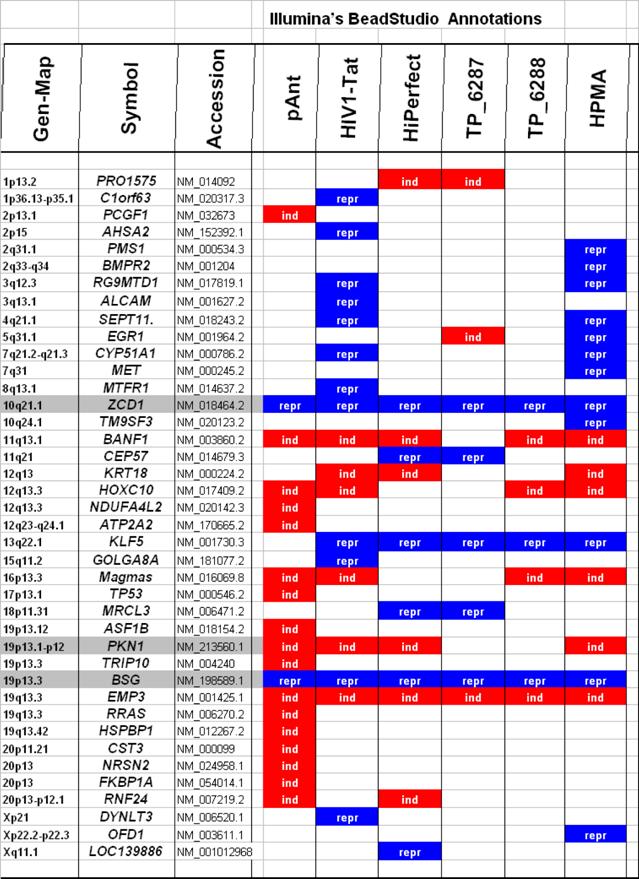
Characteristically up or down regulated genes were detected after processing and analyzing with Illumina's BeadStudio Data Analysis Software and are described in the following part according the definitions of the Illumina's (ILL) data as well as of the Illumina's annotations (table 2).
Microarray detected genes after treatment with transport peptides. The table lists the up (induced) or down regulated (repressed) genes detected by microarray investigations. The left column describes the chromosomal locations, the second column the gene symbols, the third the RefSeq accession number. The following six columns describe the induction or repression by the different transporter molecules applied. In addition the genes whose gene expression shows the most noticeable changes are gray highlighted. The annotations and the corresponding gene maps (left column) are listed and show genes differentially expressed (induced = highlighted in red; repressed = highlighted in blue).
Differentially expressed genes analyzed by real-time RT-PCR. The right part of the table lists the description of the used primers of the detected regulated genes. The primers for an optimal real-time PCR assay were designed by the Universal ProbeLibrary (Roche Diagnostics), Version 2.40 for Human. The lower half of the table shows the primers of the used reference genes.
| RefSeq | Primer | Position | Length | GC [%] | Primer-Sequence | ||
|---|---|---|---|---|---|---|---|
| BSG | NM_198589.1 | Left | 83-102 | 20 | 50 | gcgaggaataggaatcatgg | |
| Right | 169-192 | 24 | 50 | cttctacggtagtgaagactgtgc | |||
| PKN1 | NM_213560.1 | Left | 2642-2661 | 20 | 50 | gaaacagcccttcttcagga | |
| Right | 2736-2754 | 19 | 58 | cctcgtcgaagttgctgac | |||
| ZCD1 | NM_018464.2 | Left | 134-153 | 20 | 55 | cagttccagcgtacgagttg | |
| Right | 190-215 | 26 | 35 | tttgtaagctagataaccaattgcag | |||
| Reference Genes | |||||||
| G6PD | NM_000402.3 | Left | 480-499 | 20 | 55 | gcaaacagagtgagcccttc | |
| Right | 551-569 | 19 | 58 | ggccagccacataggagtt | |||
| ALAS | NM_000688.4 | Left | 1867-1889 | 23 | 43 | catgagacagatgctaatggatg | |
| Right | 1936-1955 | 20 | 45 | ttttagcagcatctgcaacc | |||
| Hprt1 | NM_000194.1 | Left | 136-159 | 24 | 33 | tgaccttgatttattttgcatacc | |
| Right | 218-237 | 20 | 55 | cgagcaagacgttcagtcct | |||
| HMBS | NM_001024382.1 | Left | 580-597 | 18 | 61 | tgtggtgggaaccagctc | |
| Right | 653-671 | 19 | 47 | tgttgaggtttccccgaat | |||
Real-Time RT-PCR Study
Validation of the Array study
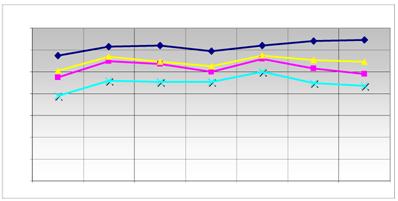
In the real-time RT-PCR, the different detection principle, SYBR-Green-based assays have a much higher sensitivity against unspecific products compared to assays based on the Universal Probe Library. Up to 3 different primer-probe combinations have been calculated for the reference genes using the Roche ProbeFinder software version 2.40 (figure 3). The performance of each combination has been tested by real-time PCR with a dilution series of the control RNA covering three orders of magnitude. The combination showing the best linearity and reproducibility was chosen for further analysis. The also calculated true PCR efficiency has been later on used to increase accuracy of the analysis. The real-time RT-PCR was carried out 3-fold to monitor the data received from microarrays.
Comparison of the expression level of the reference genes. The main modified genes (grey in table 2) and the reference genes used are listed. The graph displays the relative expression level of the used reference genes ( HPRT;
HPRT;  ALAS;
ALAS;  G6PD;
G6PD;  HMBS) in quantitative RT-PCR. The ordinate represents the corresponding concentration ratio relative to reference genes; the abscissa represents the investigated transporter molecules and the corresponding control. The maximized synchronous curve linearity or the conformity of the bundles of the columns is ideal. The HMBS (NM_001024382.1) was used as a further internal control.
Bioinformatics Study
The gene ontology database (GO) describes gene products in terms of their associated biological processes, cellular components and species-independent molecular functions, and allows a detailed description of the affected genes. GO terms (GO: http://www.geneontology.org/) of the differentially expressed genes are shown in table 4.
Description of the location and known function of the three mainly affected genes. The table lists the up- (induced, red) or down-regulated (repressed, blue) genes detected. The left column describes the chromosomal locations, the second column the gene symbols, the third the accession number. The following six columns describe the induction or repression by the different transporter molecules applied and indicated on top. The two columns on the right side depict the gene ontology category.
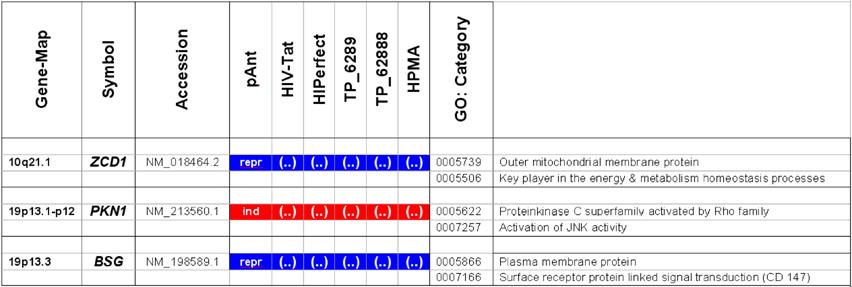
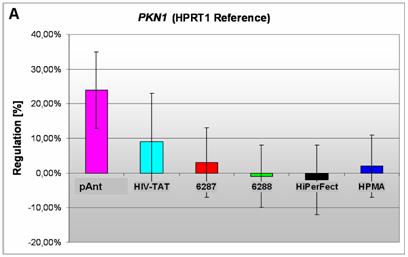
In these analyses, we identified two chromosomes (10 and 19) with altered gene expression (table 2 [gray highlighted]). The pAnt treated probe shows mainly three genes which are differentially expressed (the induced expression of PKN1; and the repressed genes ZCD1 and BSG compared to the expression of three house-keeping genes, listed in table 4), whereas all the other transporter molecules reveal hardly observable differences of gene expression. The significance-determinations are listed in figure 4.
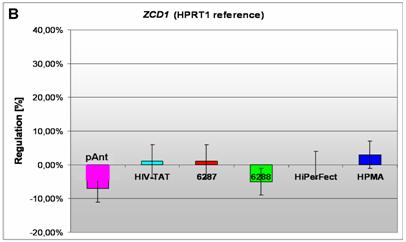
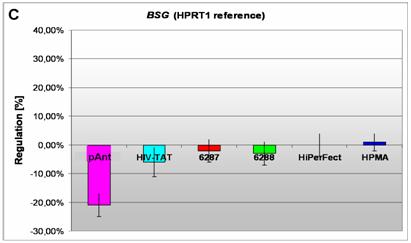
Induction and repression of the three validated genes (A, B, C). The graphs display the results of the quantitative PCR of the differential gene expression related to the HPRT1 gene in HeLa cells 24h after treatment; the abscissae show the investigated transporter peptides ( pAnt,
pAnt,  HIV-TAT,
  TP6287,
  TP6288,
  HiPerfect transfection tool, and the
  pHPMA polymer); the ordinates represent the linear ratio of differential gene expression.
Genes detected and in following investigated for validation
A) an induced expression of the PKN1 gene
B) a repressed expression of the ZCD1 gene
C) a repressed expression of BSG gene
Gene locus 10q21.1 on the long arm of the chromosome
In HeLa cells, we found a moderate repression of the ZCD1 after pAnt treatment (figure 4B). The official full name of ZCD1 (CISD1) gene is registered as CDGSH iron sulfur domain 1 and it is a member of the CDGSH domain-containing family (http://amigo.geneontology.org/cgi-bin/amigo/search.cgi?action=query&view=query&query=ZCD1&search_constraint=gp). The role of this outer mitochondrial membrane protein (GO:0005739) seems to be crucial in the regulation of mitochondrial oxidative capacity [41]. Iron ion proteins (GO:0005506) are considered as key players in vital processes involving energy homeostasis and metabolism in many organisms [42]. The fact that the search in the NCBI database PubMed still shows only a few hits accentuates the need of further investigations. Particularly a better understanding of the influence of the molecular function is necessary, as well as of biochemical processes and of the biophysical properties provoked amongst others by a moderate repression of the gene expression.
Gene locus 19p13 on the short arm of the chromosome
It is coincidence that the detected genes, the PKN1 and BSG gene cluster on the adjacent chromosomal location:
The gene expression data show that the short arm of the chromosome 19p13.1-p12 represents the gene locus of the PKN1 (Figure 4A), induced after treatment with pAnt and HIV-Tat carrier molecules, in which the pAnt treated probe shows increased gene expression compared to the HIV-1 Tat probe.
The PKN1 protein kinase N1 is a transcript variant 1 encoded by PKN. Its cytoplasmic gene product is a serine/threonine-protein kinase N1 which is a member of the protein kinase C superfamily (http://amigo.geneontology.org/cgi-bin/amigo/gp-details.cgi?gp=UniProtKB:Q16512). The proteolytic activation of this kinase is reported und suggests its role mediating insulin signals to the actin cytoskeleton [43]. Gene ontology biological process data exhibit a non tissue-specific expression (GO:0005737) of PKN1 and an activation of JNK activity (GO:0007257).
On the short arm of the chromosome 19q13.3 we also detected a gene locus harbouring the BSG gene, which is repressed solely after treatment with pAnt whereas the other probes of tested transporter molecules do not show a perceivable effect (Figure 4C). The ontology of the BSG gene product is a cell membrane localized single-pass type I membrane protein (GO:0005886). This basigin protein (BSG) is a cell surface receptor protein linked to signal transduction (CD147) (GO:0007166). The basigin protein was shown to be present in vascular endothelium in both in the non-neoplastic region of the brain and in tumor cells. (http://amigo.geneontology.org/cgi-bin/amigo/gp-details.cgi?gp=UniProtKB:P35613). Data suggest its possible involvement in tumor progression [44] and in the progression of acute lymphoblastic leukemia [45]. The BSG is also involved in the modulation of the angiogenic capability of endothelial cells [46] (UniProtKB/Swiss-Prot P35613). The correlation of the BSG expression with malignant potential of the tumor led to its use as a prognostic factor in radiotherapy of cervical cancer [47].
Conclusion and Remarks
Being involved in a variety of physiological and pathological activities, our results demonstrate candidates for continuative investigations. It could be clarified, to which extent a slight modulation of a sensible gene regulation would generate an alteration of the cellular phenotype as demonstrated using the expression of the GFP reporter gene.
We show here that not only the experimental design of active cargos but also the choice of the TPs could influence differentially regulated genes, and as a consequence create unexpected and undesired reactions. The question to what extent a moderate aberrant gene expression could contribute to a change of a cellular phenotype still remains to be answered. The preparation of these differential gene expression profiles, performed by sensitive procedures at the gene transcription level like microarray studies and simultaneously validated by Real Time RT-PCR, holds great promise for rapid host genome functional analysis. It is plausible that in host cells expression profiling after treatment with active agents or as a consequence of infections may generate a new phenotype in affected cells. Here, we described the effect of different carrier molecules used for the facilitated transport into target cells:
Our data suggest that the gene expression can depend on the choice of the used reagent facilitating the transport of substances across the cell membrane, and we realized an impact on the experimental outcomes like undesired target-effects which can lead to misinterpretation of pharmacological effects. In order to minimize off-target effects and interpretation of results, perhaps these findings could contribute to a better interpretation of gene expression data, a better choice of suitable individual strategies for the introduction of nucleic acids and its derivatives, as well as functional peptides as drugs or markers into target cells and tissues.
Acknowledgements
This research is partially supported by Deutsche Krebshilfe, D-53004 Bonn; Grant Number: 106335.
We thank Prof. J. Debus, Prof. J. Langowski, and Dr. J. Jenne for supporting our work.
This article is dedicated to the winner of the Nobel Price Award 2008 in Medical Sciences Harald zur Hausen, the retired Head of the German Cancer Research Center.
Conflict of Interest
The authors have declared that no conflict of interest exists.
References
1. Boucher R. Current status of CF gene therapy. Trends Genet. 1999;12:81-4
2. Anson DS. The use of retroviral vectors for gene therapy-what are the risks? A review of retroviral pathogenesis and its relevance to retroviral vector-mediated gene delivery. Genet Vaccines Ther. 2004;2:9
3. Lu Y, Choi YK, Campbell-Thompson M. et al. Therapeutic level of functional human alpha 1 antitrypsin (hAAT) secreted from murine muscle transduced by adeno-associated virus (rAAV1) vector. J Gene Med. 2006;8:730-5
4. Edelstein ML, Abedi MR, Wixon J. et al. Gene therapy clinical trials worldwide 1989-2004-an overview. J Gene Med. 2004;6:597-602
5. Chuah MK, Collen D, VandenDriessche T. Gene therapy for hemophilia. J Gene Med. 2001;3:3-20
6. Cavazzana-Calvo M, Fischer A. Gene therapy for severe combined immunodeficiency: are we there yet? J Clin Invest. 2007;117:1456-65
7. Amalfitano A. Next-generation adenoviral vectors: new and improved. Gene Therapy. 1999;6:1643-5
8. Armeanu S, Ungerechts G, Bernloehr C. et al. Cell cycle independent infection and gene transfer by recombinant Sendai viruses. J Virol Methods. 2003;108:229-33
9. Hale SJ, Green NK. Viral approaches to cancer gene therapy. Expert Opin Ther Patents. 2002;12(3):369-378
10. Dobbelstein M. Viruses in therapy-royal road or dead end? Virus Res. 2003;92:219-21
11. Robbins PD, Ghivizzani SC. Viral vectors for gene therapy. Pharmacol Ther. 1998;80:35-47
12. Lechardeur D, Lukacs GL. Intracellular barriers to non-viral gene transfer. Curr Gene Ther. 2002;2:183-94
13. Christiaens B, Grooten J, Reusens M. et al. Membrane interaction and cellular internalization of penetratin peptides. European Journal of Biochemistry. 2004;271:1187-97
14. Silhol M, Tyagi M, Giacca M. et al. Different mechanisms for cellular internalization of the HIV-1 Tat-derived cell penetrating peptide and recombinant proteins fused to Tat. Eur J Biochem. 2002;269:494-501
15. Vives E, Brodin P, Lebleu B. A truncated HIV-1 Tat protein basic domain rapidly translocates through the plasma membrane and accumulates in the cell nucleus. J Biol Chem. 1997;272:16010-7
16. Console S, Marty C, Garcia-Echeverria C. et al. Antennapedia and HIV transactivator of transcription (TAT) "protein transduction domains" promote endocytosis of high molecular weight cargo upon binding to cell surface glycosaminoglycans. J Biol Chem. 2003;278:35109-14
17. Koppelhus U, Awasthi SK, Zachar V. et al. Cell-dependent differential cellular uptake of PNA, peptides, and PNA- peptide conjugates. Antisense Nucleic Acid Drug D. 2002;12:51-63
18. Giovannangeli C, Diviacco S, Labrousse V. et al. Accessibility of nuclear DNA to triplex-forming oligonucleotides: the integrated HIV-1 provirus as a target. Proc Natl Acad Sci U S A. 1997;94:79-84
19. Jarver P, Langel U. The use of cell-penetrating peptides as a tool for gene regulation. Drug Discov Today. 2004;9:395-402
20. Schwarze SR, Hruska KA, Dowdy SF. Protein transduction: unrestricted delivery into all cells? Tr Cell Biol. 2000;10:290-5
21. Fawell S, Seery J, Daikh Y. et al. Tat-mediated delivery of heterologous proteins into cells. Proc Natl Acad Sci U S A. 1994;91:664-8
22. Elliott G, O'Hare P. Intercellular trafficking of VP22-GFP fusion proteins. Gene Ther. 1999;6:149-51
23. Phelan A, Elliott G, O'Hare P. Intercellular delivery of functional p53 by the herpesvirus protein VP22 [see comments]. Nat Biotechnol. 1998;16:440-3
24. Derossi D, Chassaing G, Prochiantz A. Trojan peptides: the penetratin system for intracellular delivery. Tr Cell Biol. 1998;8:84-7
25. Lundberg P, Langel U. A brief introduction to cell-penetrating peptides. Journal of Molecular Recognition. 2003;16:227-33
26. Duchardt F, Fotin-Mleczek M, Schwarz H. et al. A comprehensive model for the cellular uptake of cationic cell-penetrating peptides. Traffic. 2007;8:848-66
27. Wender PA, Galliher WC, Goun EA. et al. The design of guanidinium-rich transporters and their internalization mechanisms. Adv Drug Deliv Rev. 2008;60:452-72
28. Joliot A, Le Roux I, Volovitch M. et al. Neurotrophic activity of an homeobox peptide. Ann Genet. 1993;36:70-2
29. Dom G, Shaw-Jackson C, Matis C. et al. Cellular uptake of Antennapedia Penetratin peptides is a two-step process in which phase transfer precedes a tryptophan-dependent translocation. Nucleic Acids Res. 2003;31:556-61
30. Schwartz JJ, Zhang S. Peptide-mediated cellular delivery. Curr Opin Mol Ther. 2000;2:162-7
31. Vives E, Richard JP, Rispal C. et al. TAT peptide internalization: Seeking the mechanism of entry. Current Protein & Peptide Science. 2003;4:125-32
32. Song Y, Tong Z, Wang J. et al. Complete genome sequence of Yersinia pestis strain 91001, an isolate avirulent to humans. DNA Res. 2004;11:179-97
33. Ulbrich K, Pechar M, Strohalm J. et al. Synthesis of biodegradable polymers for controlled drug release. Ann N Y Acad Sci. 1997;831:47-56
34. Kopecek J, Kopeckova P, Minko T. et al. HPMA copolymer-anticancer drug conjugates: design, activity, and mechanism of action. Eur J Pharm Biopharm. 2000;50:61-81
35. Kopecek J, Kopeckova P, Minko T. et al. Water soluble polymers in tumor targeted delivery. Journal of Controlled Release. 2001;74:147-58
36. Gray JW, Collins C. Genome changes and gene expression in human solid tumors. Carcinogenesis. 2000;21:443-52
37. Merriefield RB. Solid Phase Peptide Synthesis. I The Synthesis of a Tetrapeptide. J Americ Chem Soc. 1963;85:2149-54
38. Carpino LA, Ionescu D, El Faham A. et al. Complex polyfluoride additives in Fmoc-amino acid fluoride coupling processes. Enhanced reactivity and avoidance of stereomutation. Org Lett. 2003;5:975-7
39. Lammers T, Peschke P, Kuhnlein R. et al. Effect of intratumoral injection on the biodistribution and the therapeutic potential of HPMA copolymer-based drug delivery systems. Neoplasia. 2006;8:788-95
40. Van Gelder RN, von Zastrow ME, Yool A. et al. Amplified RNA synthesized from limited quantities of heterogeneous cDNA. Proc Natl Acad Sci U S A. 1990;87:1663-7
41. Wiley SE, Murphy AN, Ross SA. et al. MitoNEET is an iron-containing outer mitochondrial membrane protein that regulates oxidative capacity. Proc Natl Acad Sci U S A. 2007;104:5318-23
42. Paddock ML, Wiley SE, Axelrod HL. et al. MitoNEET is a uniquely folded 2Fe 2S outer mitochondrial membrane protein stabilized by pioglitazone. Proc Natl Acad Sci U S A. 2007;104:14342-7
43. Lartey J, Smith M, Pawade J. et al. Up-regulation of myometrial RHO effector proteins (PKN1 and DIAPH1) and CPI-17 (PPP1R14A) phosphorylation in human pregnancy is associated with increased GTP-RHOA in spontaneous preterm labor. Biol Reprod. 2007;76:971-82
44. Madigan MC, Kingsley EA, Cozzi PJ. et al. The role of extracellular matrix metalloproteinase inducer protein in prostate cancer progression. Cancer Immunol Immunother. 2008;57:1367-79
45. Beesley AH, Weller RE, Kees UR. The role of BSG (CD147) in acute lymphoblastic leukaemia and relapse. Br J Haematol. 2008;142(6):1000-2
46. Millimaggi D, Mari M, D'Ascenzo S. et al. Tumor vesicle-associated CD147 modulates the angiogenic capability of endothelial cells. Neoplasia. 2007;9:349-57
47. Ju XZ, Yang JM, Zhou XY. et al. EMMPRIN expression as a prognostic factor in radiotherapy of cervical cancer. Clin Cancer Res. 2008;14:494-501
Author contact
![]() Correspondence to: Klaus Braun Ph.D., German Cancer Research Center (DKFZ), Dept. Medical Physics in Radiology, Im Neuenheimer Feld 280, D-69120 Heidelberg, Germany. Phone: +49 6221-42 2495; Fax: +49 6221-42 3375; e-mail: k.braunde
Correspondence to: Klaus Braun Ph.D., German Cancer Research Center (DKFZ), Dept. Medical Physics in Radiology, Im Neuenheimer Feld 280, D-69120 Heidelberg, Germany. Phone: +49 6221-42 2495; Fax: +49 6221-42 3375; e-mail: k.braunde