Impact Factor ISSN: 1449-1907

 Global reach, higher impact
Int J Med Sci 2008; 5(3):133-142. doi:10.7150/ijms.5.133 This issue Cite
Research Paper
Differential display identifies overexpression of the USP36 gene, encoding a deubiquitinating enzyme, in ovarian cancer
Jianduan Li1, Lisa M. Olson1,2, Zhengyan Zhang1, Lina Li1,3, Miri Bidder1, Loan Nguyen1, John Pfeifer4, Janet S. Rader1 ![]()
1. Department of Obstetrics and Gynecology, Division of Gynecologic Oncology, Washington University School of Medicine, St. Louis, MO 63110, USA
2. Abbott Bioresearch Center, Worcester, MA, USA
3. Laboratory of Biochemical Genetics, National Heart, Lung, and Blood Institute, NIH, Bethesda, USA
4. Department of Pathology, Washington University School of Medicine, St. Louis, MO 63110, USA
Received 2007-8-27; Accepted 2008-6-5; Published 2008-6-6
Abstract
Objectives. To find potential diagnostic markers or therapeutic targets, we used differential display technique to identify genes that are over or under expressed in human ovarian cancer.
Methods. Genes were initially identified by differential display between two human ovarian surface epithelium cultures and two ovarian cancer cell lines, A2780 and Caov-3. Genes were validated by relative quantitative RT-PCR and RNA in situ hybridization.
Results. Twenty-eight non-redundant sequences were expressed differentially in the normal ovarian epithelium and ovarian cancer cell lines. Seven of the 28 sequences showed differential expression between normal ovary and ovarian cancer tissue by RT-PCR. USP36 was over-expressed in ovarian cancer cell lines and tissues by RT-PCR and RNA in situ hybridization. Northern blot analysis and RT-PCR revealed two transcripts for USP36 in ovarian tissue. The major transcript was more specific for ovarian cancer and was detected by RT-PCR in 9/9 ovarian cancer tissues, 3/3 cancerous ascites, 5/14 (36%) sera from patients with ovarian cancer, and 0/7 sera from women without ovarian cancer.
Conclusion. USP36 is overexpressed in ovarian cancer compared to normal ovary and its transcripts were identified in ascites and serum of ovarian cancer patients.
Keywords: ovarian cancer, biological markers, ubiquitin specific peptidase 36 (USP36), deubiquitinating enzyme
Introduction
Ovarian cancer, the most fatal gynecological cancer, is ranked fourth in overall cancer mortality among women in the United States, causing ~16,000 deaths per year [1]. A woman's estimated risk of developing ovarian cancer in her lifetime is 1 in 70 or 1.4%. Unfortunately, no fully effective mass screening method for early ovarian cancer has yet been developed. The currently available methods, such as abdominal and transvaginal ultrasonography, color flow Doppler, and CA-125, are not specific enough for detecting early, treatable ovarian cancer through population screening [2]. Therefore, the disease is detected at an advanced stage in most patients, being confined to the ovaries at diagnosis in fewer than 30% of cases.
Epithelial ovarian cancer develops from a clone of cells [3], which suggests that early stages of the disease could be detected if specific tumor markers expressed at early stages could be identified. To find potential diagnostic markers for early ovarian cancer, we used differential display previously described [4] for identifying key genes that were uniquely overexpressed or silenced in ovarian cancer compared with normal cells. As more than 85% of human ovarian cancers are thought to be derived from ovarian surface epithelium (OSE) [5], we performed differential display to compare gene expression patterns in two cultured OSE cells and two human ovarian cancer cell lines, A2780 and Caov-3. We used relative quantitative RT-PCR and RNA in situ hybridization techniques to further evaluate the differentially expressed genes. USP36 was confirmed over-expressed in ovarian cancer cell lines and tissues. The USP36 predominant transcript was further characterized in multiple human tissues, cancerous ascites, and sera from women with and without ovarian cancer.
In eukaryotic cells, ubiquitination and deubiquitination regulate a number of biological processes by balancing cellular protein degradation. This post-translational modification is a dynamic and reversible process controlled by the coordinate action of multiple ubiquitin-conjugating and deubiquitylating enzymes. USP36 is one of the deubiquitinating (DUB) enzymes and belongs to ubiquitin-specific processing proteases (USP). USP removes ubiquitin from specific protein substrates and allow protein salvage from proteasome degradation, regulation of protein localization or activation [6]. Previous studies demonstrated that USP36 has DUB activity both in vivo and in vitro [7, 8].
Materials and methods
Cell cultures and tissue samples
Tissue samples from normal ovaries and ovarian cancers were obtained from women undergoing oophorectomies. RNA from other human tissues was obtained from the Tissue Procurement Core at the Siteman Cancer Center. The study was approved by the Human Studies Committee of Washington University in St. Louis.
Human OSE cells were collected according to the method described by Kruk et al [9] and cultures were maintained in a mixture of Medium 199 with Earle's balanced salt solution (Sigma, St. Louis, MO) and MCDB105 (Sigma, St. Louis, MO) (1:1, pH 7.3) supplemented with 15% FBS (medium 199/105/15% FBS) and 2 mM L-glutamine. The medium contained 103 IU/ml of penicillin and 103 μg/ml of streptomycin and fungizone (250 ng/ml) for the first week. Cells were plated onto a T25 polystyrene flask with 5 ml of medium and incubated undisturbed at 37ºC in 5% CO2/air for 48 hours. The old medium, which contained blood and debris, was replaced with fresh prewarmed (37ºC) medium. Subsequently, the culture medium was changed every 3-4 days as needed. When the culture was confluent, the cells were subcultured with trypsin/EDTA (Life Technologies, Gaithersburg, MD).
To characterize the cultured cells, we added 3-4 drops (50-100 μl) of prewarmed medium into each well of a microscope slide well chamber (16 wells/slide). Two drops of trypsin/EDTA/cell mixture were seeded into each well. The medium was changed every 3-4 days until the cells were confluent. Then cells were fixed in methanol/acetone and stained for cytokeratin and vimentin using anti-cytokeratin AE1/AE3 (Boehringer Mannheim, Indianapolis, IN) and anti-vimentin (Boehringer Mannheim, Indianapolis, IN) following the manufacturer's instructions.
To propagate the cells and extract their RNA, we placed the remaining trypsin/EDTA/cell mixture in a T75 polystyrene flask and added 10 ml of prewarmed (37ºC) medium. The medium was changed on the next day to remove debris and then changed every 3-4 days. When the cells in the flask were confluent, they were trypsinized and RNA was extracted.
The A2780 cell line was cultured in RPMI 1640 medium. The Caov-3 cell line was cultured in Dulbecco's modified Eagle's medium (DMEM). Both media were supplemented with 10% FBS, 2 mM L-glutamine, 103 IU/ml of penicillin and 103 μg/ml of streptomycin. The cell lines were cultured in 5% CO2 at 37ºC.
Differential display
Total cellular RNA was isolated from the cell lines by the guanidinium isothiocyanate method [10]. Contaminating DNA was removed with the MessageCleanTM Kit (GenHunter Co., Nashville, TN). Differential display technique was first described by Liang and Pardee in 1992[4]. Since then the technique has been applied in numerous studies. We performanced the differential display using the RNAimageTM kit (GenHunter Co. Nashville, TN), following the manufacturer's instructions.
Total RNA was reverse transcribed using the primer H-T11A (5'-AAGCTTTTTTTTTTTA-3'), H-T11G (5'-AAGCTTTTTTTTTTTG-3'), or H-T11C (5'-AAGCTTTTTTTTTTTC-3'). The product was amplified by PCR using one of the primer pairs labeled with alpha-[35S]-dATP. Overall, 24 primer pairs were used for PCR, including combinations of each of the above three primers with H-AP49 (5'-AAGCTTTAGTCCA-3'), H-AP50 (5'-AAGCTTTGAGACT-3'), H-AP51 (5'-AAGCTTCGAAATG-3'), H-AP52 (5'-AAGCTTGACCTTT-3'), H-AP53 (5'-AAGCTTCCTCTAT-3'), H-AP54 (5'-AAGCTTTTGAGGT-3'), H-AP55 (5'-AAGCTTACGTTAG-3'), or H-AP56 (5'-AAGCTTATGAAGG-3'). All PCR products were electrophoresed in parallel on extended-format denaturing 6% polyacrylamide gel and displayed by autoradiography.
cDNA cloning and sequencing
PCR products of the RNAs that were found to be differentially expressed between OSE cell lines and ovarian cancer cell lines were cut out from a polyacrylamide gel, re-amplified with the same primer pair, purified on agarose gels using the QIAquick Gel Extraction Kit (QIAGEN, Valencia, CA), and then cloned into the pCR-TRAP Cloning SystemTM (GenHunter Co., Nashville, TN). The inserts of clones were sequenced using either the Lgh and or Rgh primer flanking the cloning site. All sequencing reactions were performed ustilizing ABI PRISMTM BigDyeTM Terminator Cycle Sequencing Ready Reaction Kit (Perkin Elmer, Foster City, CA).
RT-PCR
Relative quantitative RT-PCR was performed according to the method of Nicoletti and Sassy-Prigent [11], with some modification. RNA samples were diluted to 1 μg/4 μl (assessed by OD260). One μg of each mixed RNA (normal and cancer) sample was used for reverse transcription in a reaction mixture whose final volume was 20 μl. The mixture contained 1 μg of oligo(dT)15, 200 U of MMLV reverse transcriptase, 50 mM Tris-HCl (pH 8.3), 75 mM KCl, 3 mM MgCl2, 10 mM dithiothreitol (DTT), 20 U RNase inhibitor (Promega, Madison, WI), and 0.5 mM each of dNTP and 0.1% DEPC (Sigma, St. Louis, MO). It was incubated at 37ºC for 60 min.
The primers were designed using the Primer 3 program (http://www.genome.wi.mit.edu/cgi-bin/primer/primer3_www.cgi). Multiplex PCR was performed in a total volume of 20 μl that contained 0.5 μM of each primer, 500 μM each of dNTP, 10 mM Tris-HCl (pH 8.3), 50 mM KCl, 6 mM MgCl2 and 2.5 U of AmpliTaq DNA Polymerase (Perkin-Elmer, Norwalk, CT). An endogenous housekeeper gene, glyceraldehyde-3-phosphate dehydrogenase (GAPDH) was used as an internal standard to correct for tube-to-tube variations in amplification efficiency. The PCR thermocycles were: 4 min at 94ºC, (1.5 min at 94ºC, 2 min at 55ºC, and 3 min at 72ºC)20, and 10 min at 72ºC. A minus RT-PCR reaction was included for every RNA sample to confirm the absence of contaminating DNA.
Quantitative data on the PCR products were acquired by digitizing photographs of ethidium bromide-stained agarose gel into gray-scale images using the public NIH Image 1.71 program and by the Wave DNA Fragment Analysis System (Transgenomic, Omaha, NE).
RNA in situ hybridization
RNA in situ hybridization was performed using a digoxigenin (DIG) labeled riboprobe. Sense and antisense riboprobes were synthesized separately and labeled in total volume of 20 µl. The reaction mixture contained 1 x transcription buffer, 1 x DIG RNA labeling mixture from the DIG Genius 4 RNA Labeling Kit (Boehringer Mannheim, Indianapolis, IN), 5 mM DTT, 20 U of RNase inhibitor (Promega, Madison, WI), 40 U of T7 or SP6 RNA polymerase (Promega, Madison, WI), and 60 ng of linearized DNA templates. The templates were generated from the PCR products amplified using T7 and SP6 primer (GenHunter Co., Nashville, TN) from IMAGE clone 2400019. The generated antisense probe for USP36 is 267bp (5'- ggatccatttaggtgacactatagaagtacctgaaaggaagcttttttttttcgaggatttcctgtatttattaagttacaagttggcaggcacagcttgagcaacatagaaaagtaatcttcttgagttatacaatcatttaaattccaaagcactcacaaaattgagcaaacaaagccactatttgcatatttgggaaaggaaacatattgctaacgtaagcttcctgaatccttcatggcctatagtgagtcgtattagaattc-3'). The synthesized riboprobe was precipitated by ethanol and verified by RNA electrophoresis. Formalin-fixed paraffin-embedded tissue slides were deparaffinized in Hemo-De (Fisher Scientific, Pittsburgh, PA), rehydrated in serially diluted ethanol (100%, 95%, 70%, 50%, and 30%), digested in 2 µg/ml proteinase K at 37ºC for 30 min, and then rinsed 3 times in PBT (PBS containing 0.1% Tween 20 and 0.1% DEPC). The pretreated slides were hybridized at 55ºC overnight in a buffer containing 50% formamide, 5 x SSC, 100 µg/ml Salmon Sperm DNA, 100 µg/ml heparin, 0.1% Tween 20, 1 x Denhardt's medium, 0.1% CHAPS, 5 mM EDTA, and ~16 µg/ml DIG-labeled riboprobe. After the slides were rinsed with 0.1 x SSC and blocked with blocking buffer (5% sheep serum, 2 mg/ml BSA, and 1% DMSO in PBT), DIG-labeled riboprobe was detected with anti-digoxigenin-AP, Fab fragments (Boehringer Mannheim, Indianapolis, IN), according to manufacture's instructions.
Northern blot
mRNA was extracted by the Messenger RNA standard isolation kit (Sigma, St. Louis, MO), and total RNA was extracted by the ToTALLY RNA kit (Ambion, Austin, TX). The products were electrophoresed on 1.5% formaldehyde/1% agarose gel with RNA MilenniumTM Size Marker (Ambion, Austin, TX). The RNA was transferred from the gel to BrightStar-PlusTM Membranes (Ambion, Austin, TX) and cross-linked onto the membrane with UV. Single-strand DNA probes labeled with 32P dCTP were made by asymmetric PCR, using antisense primer and same template as in RNA in situ hybridization. The synthesized probe was purified on a centrifuge column, and its specific activity was measured by liquid scintillation analysis. The probe for USP36 is 130bp (5'- ttacaagttggcaggcacagcttgagcaacatagaaaagtaatcttcttgagttatacaatcatttaaattccaaagcactcacaaaattgagcaaacaaagccactatttgcatatttgggaaaggaaa-3'). The membrane was hybridized in buffer containing 1.6 x 10⁷ cpm/ml probe and 6.0 x 10⁴ cpm RNA MilenniumTM Size Marker (Ambion, Austin TX) at 50ºC for 16 h. The membrane was rinsed with low stringency solution 2 x SSC and 0.1% SDS at 50ºC for 15 min and then autoradiographed at -70ºC with intensifier screen.
Isolation of RNA from ascites and serum
Serum was isolated and stored at -70ºC until processed. Ascites was collected at surgery and centrifuged at 4ºC for 5 minutes at 150g. The supernatant was removed and stored at -70ºC until processed. Isolation of RNA was preformed using TRIzol® LS Reagent (Invitrogen Corporation, Carlsbad, CA) or magnetic bead method - Ambion's MagMaxTM technology (Ambion, Inc., Austin, TX) following manufactures' protocol. DNA and RNA input levels ranging from 20 copies to 25x106 copies can be quantitatively recovered from plasma, serum, and milk (MagMaxTM manual). The concentration and purity of RNA were determined by using the Nanodrop® ND-1000A UV-Vis Spectrophotometer (NanoDrop Technologies, Wilmington, DE) and Agilent 2100 Bioanalyzer (Agilent Technologies, Inc. Santa Clara, CA). The concentration of RNA extracted from the sera range from 0.2 ~ 26ng/ul, which is similar with the results from a recent study [12]. RNA was processed for cDNA using Ambion RETROscript® Kit (Ambion, Inc.Austin,TX). An internal standard, RPS14, was used to confirm the RNA quality suitable for RT-PCR.
Results
Human OSE cell lines
Cultures of OSE cells were characterized by immunostaining with monoclonal antibodies, anti-keratin AE1/AE3 and anti-vimentin. The anti-keratin AE1/AE3 monoclonal antibody specifically recognizes human epithelial cytokeratin, an intermediate filament in epithelial cells that is absent from mesenchymal cells such as fibroblasts and smooth muscle cells. The anti-vimentin monoclonal antibody was used to stain cells of mesenchymal origin, including endothelial cells, vascular smooth muscle cells, connective tissue cells, and all types of blood cells. Immunostaining with both antibodies confirmed the epithelial origin of 6 human OSE cell cultures and 2 cell lines (N 1/4 and N 1/29) were used for the differential display.
Genes expressed differentially between human OSE cells and ovarian cancer cell lines
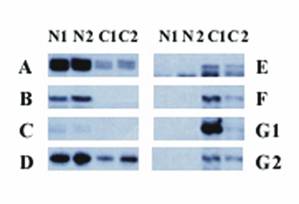
Thirty-one bands were differentially expressed between the 2 human OSE cell lines and 2 ovarian cancer cell lines (A2780 and Caov-3). Among those 31 bands, 15 were significantly overexpressed in the two ovarian cancer cell lines compared with the two normal OSE cell lines and 16 were expressed at lower levels in the two ovarian cancer cell lines than in the two OSE cell lines. Figure 1 provides an example of differential expression.
Differential display of human OSE cells and ovarian cancer cell lines. Each vertical panel represents one primer pair, and every primer pair includes 4 different cell lines: N1 (N1/4), N2 (N1/29), C1 (A2780), and C2 (Coav-3). The left panel shows bands that are expressed at a higher level in the normal human OSE cell lines N1/4 and N1/29 (bands A, B, C, and D) than in the cancer cell lines. The right panel shows the bands that are overexpressed in the human ovarian cancer cell lines A2780 and Coav-3 (bands E, F, and G). G1 and G2 are different bands with identical sequences.
We cloned all 31 differentially expressed bands into pCR-TRAP vectors. The clones were screened according to the size of the inserts, using PCR and the primer pair that flanked the cloning site of the pCR-TRAP vector and then sequenced. For two bands, two different sequences with similar sizes were identified. Therefore, a total of 33 different cloned sequences were obtained.
To identify these sequences, we used the blastn algorithm to query three nucleotide sequence databases on the NCBI website (http://www.ncbi.nlm.nih.gov): nr (non-redundant), dbEST, and dbSTS. The 33 clones represented 28 nonredundant sequences. Fourteen were underexpressed in both cancer cells lines and 14 were overexpressed in both cancer cell lines. Among the 28 nonredundant sequences, 22 matched known genes or EST, rest of them either matched to genomic DNA that contained no known EST or intron of known gene (Table 1).
Genes (EST) identified in this study.
| Clone | Band * | Tissue over expressed | UniGene ID | Gene | Chromosome Location |
|---|---|---|---|---|---|
| a & b-1 | Normal | N/A | OK/SW-cl.16 | 1p36.33 | |
| b-2 | Normal | Hs.471234 | CCNYL1 | 2q33.3 | |
| 2 | Normal | Hs.592304 | ERO1L | 14q22.1 | |
| 3 | Normal | Hs.348319 | Transcribed locus | Chr. 10 | |
| 11 | A | Normal | Hs. 40098 | GREM1 | 15q13-q15 |
| 12 | Normal | Hs.369920 | RAP1B | 12q14 | |
| 13 | Normal | N/A** | Genomic sequence | ||
| 14 | Normal | Hs.655420 | AMDHD2 | 16p13.3 | |
| 15 | Normal | Hs.459790 | VPS13A | 9q21 | |
| 16 | Normal | Hs.210469 | ELMO2 | 20q13 | |
| 17 & 20 & 34 | Normal | Hs.380953 | RPL38 | 17q23-q25 | |
| 17 & 20 & 34 | B | Normal | Hs.713533 | LTBP1 | 2p22-p21 |
| 18 | Normal | Hs.370140 | HELZ | 17q24.2 | |
| 21 | C | Normal | Hs.75813 | PKD1 | 16p13.3 |
| 23 | D | Normal | Hs.190028 | GSTO1 | 10q25.1 |
| 4 | Cancer | N/A | Genomic sequence | ||
| 10 | Cancer | N/A | Genomic sequence | ||
| 19 | E | Cancer | Hs.75277 | RMND5A | 2p11.2 |
| 22 | Cancer | Hs.75527 | ADSL | 22q13.2 | |
| 24 | Cancer | Hs.107474 | Transcribed locus | Chr. 2 | |
| 25 | Cancer | Hs.486095 | PDSS2 | 6q21 | |
| 26-1 | Cancer | N/A | Genomic sequence | ||
| 26-2 | F | Cancer | Hs.464243 | USP36 | 17q25.3 |
| 27 & 28 | G | Cancer | Hs.460298 | POLR3E | 16p12.1 |
| 29 & 32 | Cancer | Hs.22857 | CHORDC1 | 11q14.3 | |
| 30 | Cancer | N/A | Genomic sequence | ||
| 31 | Cancer | N/A | Genomic sequence | ||
| 35 | Cancer | Hs.184233 | HSPA9 | 5q31.1 | |
| 36-1 | Cancer | Hs.656195 | C21orf51 | 21q22.12 |
Validation of differential expression in human ovarian tissues
To confirm that the 28 non-redundant sequences were expressed differentially in the normal human ovary and ovarian cancer tissues, we performed relative quantitative RT-PCR, using four normal human ovary tissue samples (NO1, NO2, NO3, and NO4) and four human ovarian cancer tissue samples (OC1, OC2, OC3 and OC4). To obtain a relative quantitative measurement of the gene expression, an alternative quantitative PCR method was used [11]. First, a series of 5 progressive dilutions achieved by mixing RNAs of tumor (T) and matched normal (N) samples (T4/N0, T3/N1, T2/N2, T1/N3 and T0/N4) were assembly. Then an aliquot of each dilution mix was submitted to a standard RT-PCR. After PCR, the photographs of ethidium of bromide-stained gels were digitized into gray-scale images. The amount of nucleic acids was determined by densitometry. The amount of nucleic acid was proportional to the log of the optic density. The sum of the logarithms of the pixel values was used to estimate the amount of nucleic acid in a band. The fold increase was compared based on the expression of normal sample (T0/N4). The internal control of GAPDH was used to correct for tube-to-tube variations in initial sample inputting. In addition, we did the semi-quantitative RT-PCR using minimal cycling to avoid the artificial effect of saturation of PCR products. Seven of the 28 sequences showed differential expression between the normal and cancer tissues by relative quantitative RT-PCR (Table 2 and 3).
Genes identified by differential display (increased in normal ovary or ovarian cancer) and validated by RT-PCR.
| Band | Tissue over expressed | Chromosome Location | Gene Symbol | GeneID | Gene name |
|---|---|---|---|---|---|
| A | Normal | 15q13-q15 | GREM1 | 26585 | gremlin 1, cysteine knot superfamily, homolog (Xenopus laevis) |
| B | Normal | 2p22-p21 | LTBP1 | 4052 | latent transforming growth factor beta binding protein 1 |
| C | Normal | 16p13.3 | PKD1 | 5310 | polycystic kidney disease 1 (autosomal dominant) |
| D | Normal | 10q25.1 | GSTO1 | 9446 | glutathione S-transferase omega 1 |
| E | Cancer | 2p11.2 | RMND5A | 64795 | required for meiotic nuclear division 5 homolog A (S. cerevisiae) |
| F | Cancer | 17q25.3 | USP36 | 57602 | ubiquitin specific peptidase 36 |
| G | Cancer | 16p12.1 | POLR3E | 55718 | polymerase (RNA) III (DNA directed) polypeptide E (80kD) |
Relative expression levels of the seven genes in four normal human ovary tissues and four human ovarian cancer tissues.
| Band | Gene | NO1 | NO2 | NO3 | NO4 | OC1 | OC2 | OC3 | OC4 |
|---|---|---|---|---|---|---|---|---|---|
| A | GREM1 | ND | + | ++++ | + | ND | - | - | - |
| B | LTBP 1 | + | - | + | ++ | - | - | - | - |
| C | PKD1 | - | ++ | - | ++ | - | - | - | - |
| D | GSTO1 | + | + | - | + | - | - | - | - |
| E | RMND5A | - | - | - | - | + | + | + | + |
| F | USP36 | - | - | - | - | ++++ | - | ++++ | ++ |
| G | POLR3E | - | - | ND | - | - | +++ | ND | +++ |
ND: No data;
-: no increase or increase < 2 times;
+: Increased 2~10 times; ++: Increased 10~100 times; +++: Increased 100~1000 times; ++++: Increased more than 1000 times;
NO = normal ovary, OC = ovarian cancer
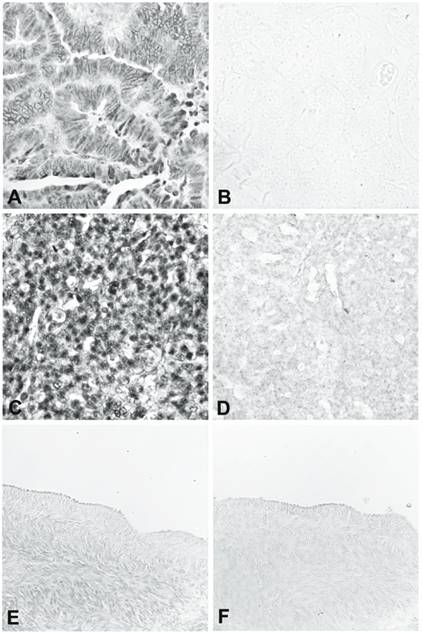
The three over-expressed sequences in ovarian cancer tissue confirmed by RT-PCR were USP36, RMND5A, and POLR3E. We further evaluated the expression of these 3 genes by RNA in situ hybridization, using nine ovarian cancer tissues (including endometroid adenocarcinoma, serous adenocarcinoma, borderline serous tumor, papillary serous adenocarcinoma, clear cell adenocarcinoma, and mixed epithelial type adenocarcinoma) and eight matched normal ovaries or fallopian tubes from the same patients. A sense probe was used as the negative control. For USP36, all nine ovarian cancer tissues gave a strong positive signal (Figure 2, panels A-D) and eight normal tissues gave very weak or negative results in the surface epithelium, stroma, and follicles (Figure 2, panels E and F). For RMND5A, six of the nine ovarian cancer tissues were positive and all the normal tissues were weak or negative. For POLR3E, four of the nine ovarian cancer tissues gave positive results and all the normal tissues showed weak or negative staining.
RNA in situ hybridization of USP36. A and B show a well-differentiated endometrioid adenocarcinoma hybridized with antisense (A) and sense (B) riboprobe. C and D show a poorly differentiated carcinoma of mixed epithelial origin, endometrioid, and papillary serous hybridized with antisense (C) and sense (D) riboprobe. E and F are from normal ovary hybridized with antisense (E) and sense (F) riboprobe.
The predominant transcripts of USP36 and RMND5A in ovarian cancer cell lines
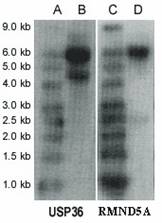
Northern blot analysis revealed two transcripts for USP36, ~6.0 kb (major transcript) and ~4.7 kb (minor transcript) (Figure 3). USP36 locates on chromosome 17q25.3 and covers 44571 bp genomic sequences. Seventeen mRNAs and 482 EST sequences represent human USP36 in NCBI UniGene database (http://www.ncbi.nlm.nih.gov/UniGene). The ESTs come from almost every tissue, including ovary and cervix. The sequence alignment between representative mRNA and the genomic sequence indicates that these mRNAs are spliced transcript variants of the USP36 gene (Figure 4). Among these mRNAs, AB040886 (NM_025090, 5879 bp) and AK022840 (4650 bp) most closely match the major and minor transcripts seen in the Northern blot (Figure 3). The sequence from the differential display band F (Table 2 and 3) perfectly matches both mRNAs, but only the AK022840 transcript contained the homologous 3' end identified by initial differential display (Figure 4).
Northern blot. Lanes A and C are RNA Size Marker; lanes B and D are mRNAs (10 µg polyA RNA in each lane) from the A2780 cell line. The first panel is USP36 and the second panel is RMND5A.
Transcripts for USP36 and primer location. A. Schematic representation of five USP36 transcripts from cDNA clones. Tel: telomere end; Cen: centromere end. B. The positions of five primers and band F are indicated schematically. Each RT-PCR primer is designed to cross introns (except primer USP36-2) and to detect a specific mRNA transcript.
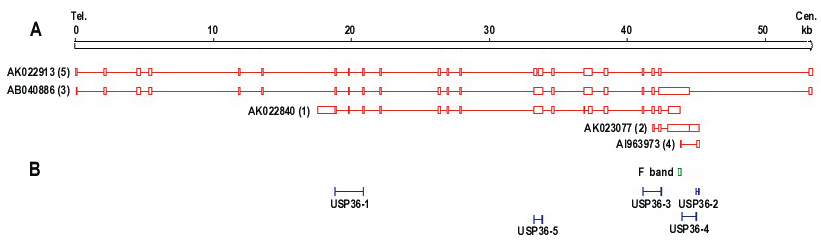
To confirm which transcripts are expressed in ovarian cancer, we designed 6 RT-PCR primers that detect specific mRNAs (Table 4, Figure 4). All primer pairs except USP36-2 were designed to cross an intron to eliminate interference by any contaminating genomic DNA. RT-PCR results demonstrated the expression of AB040886 (~ 6 kb) and AK022840 (~4 kb) in ovarian cancer cell lines (Figure 5) and were consistent with the Northern blot results. AB040886 has 21 exons, encodes a protein with 1121 amino acid (aa) and contains one ubiquitin carboxyl-terminal hydrolase (UCH) family 2 motif. AK022840 has 16 exons and encodes a protein with 726 aa and contains part of the ubiquitin carboxyl-terminal hydrolase (UCH) domain.
RT-PCR primer set and target mRNA.
| Primer Name | Forward Primer (5' – 3') | Reverse Primer (5' – 3') | Target mRNA | mRNA (bp) | PCR (bp) |
|---|---|---|---|---|---|
| USP36-1 | GTCATCTTGCTGAGCCCTTC | GGCATTCTCTCCACTCAGGA | AK022840 | 4650 | 255 |
| USP36-2 | AATTTTGTGCTTGGGAATGG | TTTTTTTCACAGAACCGGAG | AK023077 | 2479 | 223 |
| USP36-3 | ATGTGGTCCAGGAACTGCTC | CCCACCTCACCCTTACACC | AB040886 | 5879 | 359 |
| USP36-3A | ATGACTGGGACGAAGAGTTTGAC | CTACACACATACACGGCACACAC | AB040886 | 5879 | 247 |
| USP36-4 | GAAAGGAGGTGCAGAGGATG | CTGTGCCTGCCAACTTGTAA | AI963973 | 423 | 211 |
| USP36-5 | ACTCTCCCAGACACCCACAC | TGGAACAGTTCGTTTCCTGA | AK022913* | 3760 | 247* |
* USP36-5 primer set also detects AK022840 and AB040886 as a 389 bp PCR product.
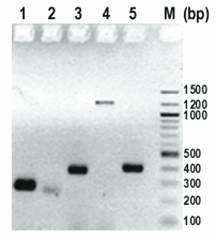
Determination of USP36 transcripts by RT-PCR. Column 1-5 represent primers USP36-1 to USP36-5, and column M represents a 100 bp DNA ladder. Primers USP36-1 (AK022840) and USP36-3 (AB040886, NM_025090) were positive. Primer pairs USP36-4 (AI963973) and USP36-2 (AK023077) represent genomic DNA. Primer USP36-5 (AK022913) detected a 389 bp band which matches AB040886 and AK022840 but was negative for the 247 bp band specific for AK022913 (Figure 4).
Northern blot analysis revealed two transcripts for RMND5A (~6.0 kb and ~2.5 kb) by using mRNA from ovarian cancer cell line A2780 (Figure 3). The sequence RMND5A resides on chromosome 2p11.2 and covers 57756 bp genomic sequences. Several mRNAs corresponding to this gene are documented on the NCBI website. Recent study showed that RMND5A (p44CTLH) was associated with several proteins and composed a large protein complexes. It contains LisH/CTLH motifs, which are present in proteins involved in microtubule dynamics, cell migration, nucleokinesis, and chromosome segregation [13].
Expression pattern of USP36 mRNA transcripts in multiple human tissues
We further evaluated the expression of USP36 major transcript AB040886 and minor transcript AK022840 in multiple human tissues by RT-PCR. USP36-3A was developed to identify AB040886 with a smaller PCR product in serum and ascites (Table 4). The results showed that the major transcript AB040886 is more specific for ovarian cancer tissue than the minor transcript AK022840. AB040886 was detected in 9/9 human ovarian cancer tissues, 3/3 ascites specimens from ovarian cancer patients, and 5/14 (36%) sera from ovarian cancer patients. Sequencing two of five PCR products from sera confirmed the result. None of seven sera from women without ovarian cancer detected AB040886.
As comparison to ovarian cancer, 4 normal ovaries tissues showed absent expression except one hemorrhagic torsed benign ovary had expression similar to ovarian cancer. In addition, AB040886 showed absent expression in normal tissues from pancreas, kidney, cervix, spleen, testis, endometrium, breast, colon, myometrium, and liver by RT-PCR. There was minimal to absent staining in cancers from prostate, cervix, colon, lung and breast. AK022840 was ubiquitously expressed in all tested tissues.
Discussion
To identify overexpressed or silenced genes in ovarian cancer, we used differential display to compare human ovarian cancer cell lines with human normal OSE cell lines. We detected 28 differentially expressed genes. When we used RT-PCR and RNA in situ hybridization to validate the differential expression of these sequences in human normal ovarian tissue and ovarian cancers and found that USP36 was consistently overexpressed in the ovarian cancers tissues evaluated. RNA in situ hybridization showed USP36 expression in various histologic types of epithelial ovarian cancer. Northern blot and RT-PCR identified two transcripts. The major transcript AB040886 appears more specific for ovarian cancer tissue than the minor transcript AK022840.
USP36 is a deubiquitinating enzyme, also known as ubiquitin specific protease (USP). The deubiquitinating enzymes are a component of the ubiquitin system, which is important for regulating numerous basic biological processes, including cell-cycle progression, apoptosis, signal transduction, transcriptional regulation, receptor downregulation, and endocytosis [14]. Like protein phosphorylation and dephosphorylation, protein ubiquitination is a dynamic process. It is controlled by the coordinated actions of ubiquitin conjugating enzymes and deubiquitinating enzymes that respectively add or remove the ubiquitin moiety from a target protein. The deubiquitinating enzymes are also involved in processing of poly-ubiquitin precursors into ubiquitin monomers, targeting or salvage of proteasomal substrates and regulating nonproteolytic functions of mono- and poly-ubiquitination [15, 16].
Ubiquitin-mediated proteolysis has been implicated in the degradation of several important oncogene products, such as N-myc, c-myc, c-fos, c-jun, β-catenin, and adenovirus E1A [14]. Aberrations in their removal may derail the cell cycle and result in malignant transformation. UCH-L1, a deubiquitinating enzyme, is highly expressed in primary lung cancers and lung cancer cell lines and strongly correlates with advanced stage [17, 18]. Yeast two-hybrid analysis showed UCH-L1 interacts with JAB1, a Jun activation domain binding protein that can bind to p27Kip1 [19]. Another deubiquitinating enzyme, Unp (USP4) is tumorigenic when overexpressed in mice, acting like a proto-oncogene [20].
USP36 cloning and enzymatic analysis was published by Quesada et al. along with 21 other novel human ubiquitin-specific proteases. Northern blot analysis showed USP36 to be present in leukocytes, ovary, testis, and prostate at about ~ 7.5 kb (probe information not provided, there is no size marker to indicate the band size) [8]. According to the provided protein IDs in the paper, NP_079366 matches USP36. The protein is 1123aa and the encoding mRNA is NM_025090 (5234bp) (http://www.ncbi.nlm.nih.gov). It is exactly the same protein we described in this study (AB040886, encoding USP36, 1123aa). Enzymatic assays demonstrated that USP36 had USP activity. Kim et al. identified USP36, called HeLa DUB-1, in extracts from HeLa by RT-PCR with a pair of primers designed for AK022913 [7, 21]. Although these publications stated USP36 was isolated from ovarian cancer, HeLa is a cervical cancer cell line [22]. According to the published sequence, the HeLa DUB-1 cDNA is a different transcript from the major transcript (AB040886) of ovarian cancer cell lines described in this paper and corresponds to AK022913 (but with different 3' and 5' terminals). Our RT-PCR results indicated that AK022913 is not expressed in human ovarian cancer cell lines (Figure 5, lane 5). In Kim's paper, they mentioned that USP36 contains 18 exons. According to the same website http://genome.ucsc.edu/ (version March 2006), USP36 contain 21 exons, in which 18 of them are coding exons.
Circulating nucleic acids (CNA) was first reported in 1940s. In 1977, Leon et al. first reported high levels of CNA in patients with pancreatic cancer. In 2007 the use of CNA was proposed as a non-invasive tool for the early detection of cancer [23]. Recent studies have shown circulating RNA may be used as a valuable diagnostic tool for discriminating cancer patients from non-cancer individuals. Li et al. demonstrated that the mRNA profile was more complex in sera from oral squamous cell carcinoma patients than that in healthy controls using microarray and RT-PCR techniques [24]. Feng et al. found that the mean level of RNA in serum of patients with renal cell cancer was significantly higher than that in healthy individuals.[12] Here we demonstrated that USP36 mRNA could be detected in 5/14 (36%) sera by RT-PCR from ovarian cancer patients. Additional studies are needed to validate these findings.
In summary, using differential display, RT-PCR, and RNA in situ hybridization we confirmed the overexpression of USP36 in human ovarian cancer compared to normal ovaries. USP36 was detectable by RT-PCR in ovarian cancer tissue, ascites and serum specimens from ovarian cancer patients. Further work is necessary to identify the specific target of USP36 and to determine the role of this deubiquitinating enzyme in ovarian carcinogenesis or its prospect as a cancer biomarker.
Abbreviations
OSE: the ovarian surface epithelium; GAPDH: glyceraldehyde-3-phosphate dehydrogenase.
Acknowledgements
The work was supported by grants from the Siteman Cancer Center (supported in part by P30 CA91842), Barnes-Jewish Hospital Foundation and NIH grants CA094141 and CA95713. We would like to thank John Donaldson for his assistance in cell culture and Dr. Mark Watson for critical review of this manuscript.
Conflict of Interests
The authors have declared that no conflict of interest exists.
References
1. Jemal A, Siegel R, Ward E. et al. Cancer statistics, 2006. CA Cancer J Clin. 2006;56:106-130
2. Menon U, Jacobs IJ. Recent developments in ovarian cancer screening. Curr Opin Obstet Gynecol. 2000;12:39-42
3. Tsao SW, Mok CH, Knapp RC. et al. Molecular genetic evidence of a unifocal origin for human serous ovarian carcinomas. Gynecol Oncol. 1993;48:5-10
4. Liang P, Pardee AB. Differential display of eukaryotic messenger RNA by means of the polymerase chain reaction. Science. 1992;257:967-971
5. Scully RE. Ovarian tumors. A review. Am J Pathol. 1977;87:686-720
6. Daviet L, Colland F. Targeting ubiquitin specific proteases for drug discovery. Biochimie. 2008;90:270-283
7. Kim MS, Kim YK, Kim YS. et al. Deubiquitinating enzyme USP36 contains the PEST motif and is polyubiquitinated. Biochem Biophys Res Commun. 2005;330:797-804
8. Quesada V, Diaz-Perales A, Gutierrez-Fernandez A. et al. Cloning and enzymatic analysis of 22 novel human ubiquitin-specific proteases. Biochem Biophys Res Commun. 2004;314:54-62
9. Kruk PA, Maines-Bandiera SL, Auersperg N. A simplified method to culture human ovarian surface epithelium. Lab Invest. 1990;63:132-136
10. Chirgwin JM, Przybyla AE, MacDonald RJ. et al. Isolation of biologically active ribonucleic acid from sources enriched in ribonuclease. Biochemistry. 1979;18:5294-5299
11. Nicoletti A, Sassy-Prigent C. An alternative quantitative polymerase chain reaction method. Anal Biochem. 1996;236:229-241
12. Feng G, Li G, Gentil-Perret A. et al. Elevated serum-circulating RNA in patients with conventional renal cell cancer. Anticancer Res. 2008;28:321-326
13. Kobayashi N, Yang J, Ueda A. et al. RanBPM, Muskelin, p48EMLP, p44CTLH, and the armadillo-repeat proteins ARMC8alpha and ARMC8beta are components of the CTLH complex. Gene. 2007;396:236-247
14. Ciechanover A. The ubiquitin proteolytic system and pathogenesis of human diseases: a novel platform for mechanism-based drug targeting. Biochem Soc Trans. 2003;31:474-481
15. Wing SS. Deubiquitinating enzymes--the importance of driving in reverse along the ubiquitin-proteasome pathway. Int J Biochem Cell Biol. 2003;35:590-605
16. Ovaa H, Kessler BM, Rolen U. et al. Activity-based ubiquitin-specific protease (USP) profiling of virus-infected and malignant human cells. Proc Natl Acad Sci U S A. 2004;101:2253-2258
17. Hibi K, Liu Q, Beaudry GA. et al. Serial analysis of gene expression in non-small cell lung cancer. Cancer Res. 1998;58:5690-5694
18. Hibi K, Westra WH, Borges M. et al. PGP9.5 as a candidate tumor marker for non-small-cell lung cancer. Am J Pathol. 1999;155:711-715
19. Caballero OL, Resto V, Patturajan M. et al. Interaction and colocalization of PGP9.5 with JAB1 and p27(Kip1). Oncogene. 2002;21:3003-3010
20. Gilchrist CA, Baker RT. Characterization of the ubiquitin-specific protease activity of the mouse/human Unp/Unph oncoprotein. Biochim Biophys Acta. 2000;1481:297-309
21. Kim MS, Yoo KJ, Kang I. et al. A novel cysteine protease HeLa DUB-1 responsible for cleaving the ubiquitin in human ovarian cancer cells. Int J Oncol. 2004;25:373-379
22. Masters JR. HeLa cells 50 years on: the good, the bad and the ugly. Nat Rev Cancer. 2002;2:315-319
23. Swarup V, Rajeswari MR. Circulating (cell-free) nucleic acids--a promising, non-invasive tool for early detection of several human diseases. FEBS Lett. 2007;581:795-799
24. Li Y, Elashoff D, Oh M. et al. Serum circulating human mRNA profiling and its utility for oral cancer detection. J Clin Oncol. 2006;24:1754-1760
Author contact
![]() Correspondence to: Janet S. Rader, MD, Professor, Department of Obstetrics and Gynecology, Division of Gynecologic Oncology, Department of Genetics, Washington University School of Medicine, Box #8064, 4911 Barnes-Jewish Hospital Plaza, St. Louis, MO 63110. Phone: 314-362-3181; fax 314-362-2893; email: raderjedu
Correspondence to: Janet S. Rader, MD, Professor, Department of Obstetrics and Gynecology, Division of Gynecologic Oncology, Department of Genetics, Washington University School of Medicine, Box #8064, 4911 Barnes-Jewish Hospital Plaza, St. Louis, MO 63110. Phone: 314-362-3181; fax 314-362-2893; email: raderjedu