Impact Factor ISSN: 1449-1907
- Issue 8; 2026
- Issue 7; 2026
- Issue 6; 2026
- Issue 5; 2026
- Issue 4; 2026
- Volume 23; 2026
- Past Issues
- Editorial Board
- Cover Images
- Index & Coverage
- Cover Suggestion
- Special Issues
1. Introduction
2. Materials and Methods
3. Results
4. Discussion
Acknowledgements
References
Appendix I – Premier Heart...
Appendix II – Grading of...
Footnotes

 Global reach, higher impact
Int J Med Sci 2007; 4(5):249-263. doi:10.7150/ijms.4.249 This issue Cite
Research Paper
Computerized two-lead resting ECG analysis for the detection of coronary artery stenosis
Eberhard Grube 1, Andreas Bootsveld 2, Seyrani Yuecel 1, Joseph T. Shen 3, Michael Imhoff 4 ![]()
1. Department of Cardiology and Angiology, Heart Center Siegburg, Klinikum Siegburg, Ringstrasse 49, D-53721 Siegburg, Germany
2. Department of Cardiology, Evangelisches Stift St. Martin, Johannes-Mueller-Strasse 7, D-56068 Koblenz, Germany
3. Premier Heart, LLC, 14 Vanderventer Street, Port Washington, NY 11050, USA
4. Department for Medical Informatics, Biometrics and Epidemiology, Ruhr-University Bochum, Postbox, D-44780 Bochum, Germany
Received 2007-6-29; Accepted 2007-10-15; Published 2007-10-16
Abstract
Background: Resting electrocardiogram (ECG) shows limited sensitivity and specificity for the detection of coronary artery disease (CAD). Several methods exist to enhance sensitivity and specificity of resting ECG for diagnosis of CAD, but such methods are not better than a specialist's judgement. We compared a new computer-enhanced, resting ECG analysis device, 3DMP, to coronary angiography to evaluate the device's accuracy in detecting hemodynamically relevant CAD.
Methods: A convenience sample of 423 patients without prior coronary revascularization was evaluated with 3DMP before coronary angiography. 3DMP's sensitivity and specificity in detecting hemodynamically relevant coronary stenosis as diagnosed with coronary angiography were calculated as well as odds ratios for the 3DMP severity score and coronary artery disease risk factors.
Results: 3DMP identified 179 of 201 patients with hemodynamically relevant stenosis (sensitivity 89.1%, specificity 81.1%). The positive and negative predictive values for identification of coronary stenosis as diagnosed in coronary angiograms were 79% and 90% respectively. CAD risk factors in a logistic regression model had markedly lower predictive power for the presence of coronary stenosis in patients than did 3DMP severity score (odds ratio 3.35 [2.24-5.01] vs. 34.87 [20.00-60.79]). Logistic regression combining severity score with risk factors did not add significantly to the prediction quality (odds ratio 36.73 [20.92-64.51]).
Conclusions: 3DMP's computer-based, mathematically derived analysis of resting two-lead ECG data provides detection of hemodynamically relevant CAD with high sensitivity and specificity that appears to be at least as good as those reported for other resting and/or stress ECG methods currently used in clinical practice.
Keywords: coronary artery disease, electrocardiography, computer-enhanced, coronary imaging: angiography, sensitivity, specificity.
1. Introduction
Coronary artery disease (CAD) is the leading single cause of death in the developed world. Between 15% and 20% of all hospitalizations are the direct results of CAD [1]. Electrocardiography-based methods are routinely used as the first tools for initial screening and diagnosis. Still, in clinical studies they show sensitivities for prediction of CAD of only 20% to 70% [2,3]. Even sensitivity and specificity of stress test methods are limited, especially in single-vessel CAD [4-6].
Coronary angiography remains the gold standard for the morphologic diagnosis of CAD and also allows revascularization during the same procedure [7,8]. However, it is resource-intensive, expensive, invasive, and bears a relevant procedure-related complication rate (< 2%), morbidity (0.03-0.25%), and mortality (0.01-0.05%) [9,10].
Risk factors for CAD such as smoking, arterial hypertension, diabetes mellitus, obesity, or hypercholesterolemia (of which at least one is present in the vast majority of symptomatic CAD patients) can also be used to screen for hemodynamically relevant coronary stenosis [11-14].
Several methods have been proposed and developed to enhance sensitivity and specificity of the resting electrocardiogram (ECG) for diagnosis of symptomatic and asymptomatic CAD. However, diagnostic ECG computer programs have not yet been shown to be equal or superior to the specialist physician's judgment [15]. Moreover, studies comparing computerized with manual ECG measurements in patients with an acute coronary syndrome have shown that computerized measurements have diagnostic cut-offs that differ from manual measurements and therefore may not be used interchangeably [16]. This is one of the likely reasons underlying the limited acceptance of such techniques in clinical practice.
The present study compared a new computer-enhanced, resting ECG analysis device, 3DMP, to coronary angiography to evaluate the device's accuracy in detecting hemodynamically relevant CAD.
2. Materials and Methods
Patients
The study comprised 562 patients scheduled for coronary angiography between July 1, 2001, and June 30, 2003, at the Heart Center Siegburg, Siegburg, Germany. They represented a convenience sample of patients in that each was already scheduled for coronary angiography for any indication and had no history of a coronary revascularization procedure prior to the scheduled angiography. Forty-four patients had a history of myocardial infarction (MI) more than six weeks prior to angiography. No patients presented with acute coronary syndrome at the time of study. Seventeen patients were excluded from the final analysis due to poor ECG tracing quality, and risk factor information for 122 patients could not be retrieved.
The study protocol conformed with the Helsinki Declaration and was approved by the local institutional committee on human research. Written informed consent was waived by each participant as a result of the disclosed non-risk designation of the study device. All patients received a full explanation and gave verbal informed consent to the study and the use of their de-identified data.
The patient population had no overlap with any previous study or with the actual 3DMP database. The 3DMP reference database was not modified or updated during the study period. Medical history and risk factors for each patient were retrieved from the standard medical documentation. The following risk factors were grouped into “present” or “not present” [11-14]:
- Arterial hypertension (systolic blood pressure >140 mm Hg and/or diastolic blood pressure >90 mm Hg),
- Diabetes mellitus of any type,
- Hypercholesterolemia (total cholesterol >200 mg/dl or LDL-cholesterol >160 mg/dl) and/or hypertriglyceridemia (triglycerides >200 mg/dl),
- Active or former smoking (cessation less than 5 years prior to inclusion in the study),
- Obesity (BMI >30 kg/m2),
- Family history (symptomatic CAD of one parent), and
- Other risk factors, including established diagnosis of peripheral artery disease.
Study device
The study device, 3DMP (Premier Heart, LLC, Port Washington, NY, USA), records a 2-lead resting ECG from leads II and V5 for 82 seconds each using proprietary hardware and software. The analog ECG signal is amplified, digitized, and down-sampled to a sampling rate of 100 Hz to reduce data transmission size; subsequent data transformations performed on the data do not require higher than 100 Hz/sec resolution. The digitized ECG data is encrypted and securely transmitted over the Internet to a central server.
At the server, a series of Discrete Fourier Transformations are performed on the data from the two ECG leads followed by signal averaging. The final averaged digital data segment is then subjected to six mathematical transformations (power spectrum, coherence, phase angle shift, impulse response, cross-correlation, and transfer function) in addition to an amplitude histogram, all of which is used to generate indexes of abnormality. The resulting patterns of the indexes are then compared for abnormality to the patterns in the reference database to reach a final diagnostic output. In addition to the automatic differential diagnosis and based on the database comparison, a severity score from 0 to 20 is calculated that indicates the level of myocardial ischemia (if present) resulting from coronary disease.
The database against which the incoming ECG results are compared originated from data gathering trials conducted from 1978 to 2000 in more than 30 institutions in Europe, Asia, and North America on individuals of varying ages and degrees of disease state including normal populations [17,18]. All ECG analyses in this database have been validated against the final medical diagnosis of at least two independent expert diagnosticians in the field, including results of angiography and enzyme tests. The current diagnostic capability for identification of local or global ischemia and the disease severity score used in this clinical study are based on 3DMP's large proprietary database of validated ECG analyses accumulated since 1998.
One important difference between 3DMP and other ECG methods is that the ECG is locally recorded but remotely analyzed at a central data facility due to the size and complexity of the reference database. A detailed description of the 3DMP technology is given in Appendix I.
ECG acquisition and processing
3DMP tests were conducted as follows by a trained trial site technician as part of a routine electrophysiological workup received by each patient prior to angiography.
- Patients were tested while quietly lying supine following 20 minutes of bed rest.
- Five ECG wires with electrodes were attached from the 3DMP machine to the patient at the four standard limb lead and precordial lead V5 positions.
- An automatic 82-second simultaneous two-lead (leads V5 and II) ECG sample was acquired with amplification and digitization.
- During the sampling, the ECG tracings displayed on the 3DMP screen were closely monitored for tracing quality.
The digital data was then de-identified, encrypted, and sent via a secure Internet connection to www.premierheart.com. A second identical copy of the data was saved on the remote 3DMP machine for post-study verification purposes before the data analysis was carried out. The quality of the tracing was visually rechecked and graded as “good,” “marginal,” or “poor.” A poor tracing was defined by one of the following:
- five or more 5.12-second segments of ECG data contain idiopathic extrema that deviate from the baseline by ≥ 2 mm and appear ≥ 10 times,
- two or more 5.12-second segments of ECG data contain idiopathic extrema that deviate from the baseline by ≥ 5 mm,
- in a 25-mm section of waveform in any 5.12-second segment of the ECG data, the waveform strays from the baseline by ≥ 3 mm,
- a radical deviation away from the baseline 80° of ≥ 2 mm from the baseline, occurring two or more times,
- a single radical deviation away from the baseline 80° episode of ≥ 5 mm from the baseline.
A marginal tracing was defined by significant baseline fluctuations that did not meet the above criteria. Tracings consistently graded as poor after repeated sampling were excluded from the present study. All other tracings were included in the study. Examples of different tracings are shown in Appendix II.
3DMP provided automatic diagnosis of regional or global ischemia, including silent ischemia, due to coronary artery disease, and calculated a severity score. This severity score has a maximum range from 0 to 20 where a higher score indicates a higher likelihood of myocardial ischemia due to coronary stenosis. Following the 3DMP manufacturer's recommendation, a cut-off of 4.0 for the severity score was used in this study, with a score of 4.0 or higher being considered indicative of a hemodynamically relevant coronary artery stenosis of >70% in at least one large-sized vessel.
Angiographers and staff at the study site were blinded to all 3DMP findings. The 3DMP technicians and all Premier Heart staff were blinded to all clinical data including pre-test probabilities for CAD or angiography findings from the study patients.
Retest reliability of 3DMP was assessed in 45 patients on whom a second 3DMP test was done within 4 hours after the first test. The ECG electrodes were left in place for these repeat measurements. For comparison with angiography, the first test was always used in these patients.
Angiography
After the 3DMP test, coronary angiography was performed following the standards of the institution. Angiograms were classified immediately by the respective angiographer and independently by a second interventional cardiologist within 4 weeks after the angiogram. If the two investigators did not agree on the results, they discussed the angiograms until agreement was reached. Angiograms were classified as follows:
- Non-obstructive CAD: angiographic evidence of coronary arterial stenosis of ≤70% in a single or multiple vessels. Evidence included demonstrable vasospasm, delayed clearance of contrast medium indicating potential macro- or micro-vascular disease, documented endothelial abnormality (as indicated by abnormal contrast staining), or CAD with at least 40% luminal encroachment observable on angiograms. These patients were classified as negative for hemodynamically relevant CAD (= “stenosis: no”).
- Obstructive CAD: angiographic evidence of coronary arterial sclerosis of > 70% in a single or multiple vessels, with the exception of the left main coronary artery, where ≥50% was considered obstructive. These patients were classified as positive for hemodynamically relevant CAD (= “stenosis: yes”).
The angiographic results represent the diagnostic endpoint against which 3DMP was tested.
Statistical methods
An independent study monitor verified the double-blindness of the study and the data integrity and monitored the data acquisition process, all angiography reports, and all 3DMP test results. Descriptive statistics were calculated for all variables (mean +/- standard deviation). Differences between two variables were tested with the t-test. Differences in 2x2 tables were assessed for significance with Fisher's exact test. Logistic regression was used to analyze effects of multiple categorical variables. Odds ratios including 95% confidence intervals were calculated. Sensitivity and specificity were calculated as were receiver operating characteristic (ROC) curves including an estimate of the area under the curve (AUC). Positive and negative predictive values (PPV, NPV) for the assessment of coronary stenosis were calculated with adjustment to prevalence of stenosis [19]. Moreover, in order to assess the performance of the prediction of stenosis independent of the prevalence of stenosis the positive and negative likelihood ratios (LR) were calculated [20]. A value of P < 0.05 was considered statistically significant. All analyses were done with SPSS for Windows Version 14 (SPSS Inc., Chicago, IL, USA).
3. Results
A final analysis was performed on 423 of the original 562 patients: 139 patients were excluded, 17 due to poor ECG tracings and 122 because of unavailability of full risk factor information. The excluded patients were not significantly different from the included patients with respect to age (62.6 +/- 11.3 vs. 61.4 +/- 11.1 years; P = 0.774), gender (39% female vs. 36.7% male; P = 0.688), or diagnosis of coronary stenosis (stenosis: yes, 47.5% vs. stenosis: no, 43.9%; P = 0.493). Available patients comprised 258 men and 165 women, average age 61.4 +/- 11.1 years (24-89). Women were significantly older than men (64.0 +/- 11 vs. 59.7 +/- 11 years; P < 0.01).
Only 23 (5.4%) patients had no known risk factors for CAD, whereas 216 (51%) had at least three risk factors (Table 1). All 44 patients with a history of MI had at least one risk factor. Patients with arterial hypertension and patients with diabetes were significantly older than those without; smokers were significantly younger than non-smokers (each, P < 0.01). Hypertension was significantly more frequent in women (P < 0.01), whereas smoking was more frequent in men (P < 0.01) as was a history of MI (p< 0.05).
Risk factors, MI history, gender, and age distribution.
| All Patients | Gender | |||||||||||||
|---|---|---|---|---|---|---|---|---|---|---|---|---|---|---|
| Age (years) | N | % | Female | Male | ||||||||||
| Age (years) | Age (years) | |||||||||||||
| Mean | SD | |||||||||||||
| Mean | SD | N | % | Mean | SD | N | % | |||||||
| Total | 61.4 | 11.1 | 423 | 100.0% | 64.0 | 11.3 | 165 | 100.0% | 59.7 | 10.7 | 258 | 100.0% | ||
| Arterial hypertension | no | 57.7 | 11.5 | 159 | 37.6% | 59.4 | 12.2 | 50 | 30.3% | 56.9 | 11.1 | 109 | 42.2% | |
| yes | 63.6 | 10.4 | 264 | 62.4% | 66.0 | 10.3 | 115 | 69.7% | 61.7 | 10.1 | 149 | 57.8% | ||
| Hyperlipidemia | no | 60.8 | 10.9 | 166 | 39.2% | 63.5 | 11.1 | 71 | 43.0% | 58.7 | 10.4 | 95 | 36.8% | |
| yes | 61.7 | 11.3 | 257 | 60.8% | 64.3 | 11.4 | 94 | 57.0% | 60.2 | 10.9 | 163 | 63.2% | ||
| Active or former smoking | no | 64.5 | 9.9 | 264 | 62.4% | 67.0 | 9.1 | 121 | 73.3% | 62.4 | 10.1 | 143 | 55.4% | |
| yes | 56.1 | 11.1 | 159 | 37.6% | 55.6 | 12.5 | 44 | 26.7% | 56.3 | 10.5 | 115 | 44.6% | ||
| Diabetes of any type | no | 60.5 | 11.3 | 350 | 82.7% | 62.8 | 11.8 | 133 | 80.6% | 59.1 | 10.7 | 217 | 84.1% | |
| yes | 65.4 | 9.7 | 73 | 17.3% | 68.9 | 7.3 | 32 | 19.4% | 62.6 | 10.4 | 41 | 15.9% | ||
| Family history | no | 61.9 | 11.5 | 300 | 70.9% | 64.5 | 11.8 | 112 | 67.9% | 60.3 | 11.1 | 188 | 72.9% | |
| yes | 60.1 | 10.1 | 123 | 29.1% | 62.9 | 10.0 | 53 | 32.1% | 58.0 | 9.8 | 70 | 27.1% | ||
| Obesity | no | 61.8 | 11.0 | 241 | 57.0% | 65.1 | 10.8 | 93 | 56.4% | 59.8 | 10.7 | 148 | 57.4% | |
| yes | 60.7 | 11.3 | 182 | 43.0% | 62.6 | 11.8 | 72 | 43.6% | 59.5 | 10.9 | 110 | 42.6% | ||
| Other risk factors | no | 61.2 | 11.2 | 407 | 96.2% | 63.9 | 11.3 | 163 | 98.8% | 59.4 | 10.8 | 244 | 94.6% | |
| yes | 65.3 | 9.9 | 16 | 3.8% | 75.0 | 2.8 | 2 | 1.2% | 63.9 | 9.8 | 14 | 5.4% | ||
| Number of risk factors | 0 | 59.5 | 12.4 | 23 | 5.4% | 63.6 | 10.9 | 8 | 4.8% | 57.3 | 12.9 | 15 | 5.8% | |
| 1 | 62.5 | 10.9 | 71 | 16.8% | 66.4 | 9.8 | 25 | 15.2% | 60.4 | 11.0 | 46 | 17.8% | ||
| 2 | 61.7 | 11.4 | 113 | 26.7% | 64.2 | 11.9 | 48 | 29.1% | 59.9 | 10.7 | 65 | 25.2% | ||
| 3 | 61.4 | 11.0 | 124 | 29.3% | 62.6 | 12.0 | 52 | 31.5% | 60.4 | 10.1 | 72 | 27.9% | ||
| 4 | 59.8 | 11.2 | 64 | 15.1% | 63.8 | 11.1 | 28 | 17.0% | 56.6 | 10.3 | 36 | 14.0% | ||
| 5 | 59.6 | 10.8 | 19 | 4.5% | 60.0 | 1 | 0.6% | 59.6 | 11.1 | 18 | 7.0% | |||
| 6 | 67.9 | 9.8 | 9 | 2.1% | 69.0 | 6.2 | 3 | 1.8% | 67.3 | 11.8 | 6 | 2.3% | ||
| Myocardial infarction in patient history | no | 61.3 | 11.3 | 379 | 89.6% | 63.9 | 11.4 | 154 | 93.3% | 59.5 | 10.9 | 225 | 87.2% | |
| yes | 61.8 | 10.1 | 44 | 10.4% | 65.0 | 10.4 | 11 | 6.7% | 60.8 | 10.0 | 33 | 12.8% | ||
Hemodynamically relevant coronary stenosis was diagnosed with angiography in 201 patients (47.5%). Female patients were diagnosed with coronary stenosis significantly less frequently than were male patients (32.1% vs. 57.4%; P < 0.01). Patients with coronary stenosis were significantly older than patients without (63.6 +/- 10.1 vs. 59.3 +/- 11.7 years). This age difference could also be observed within each gender group (all differences significant at P < 0.01; Table 2). Five patients with a history of MI did not have a hemodynamically relevant stenosis.
Frequency of coronary stenosis, distribution of gender, age, risk factors, and MI history.
| Coronary Stenosis | All Patients | |||||
|---|---|---|---|---|---|---|
| No | Yes | |||||
| All patients | Age (years): Mean | 59.3 | 63.6 | 61.4 | ||
| SD | 11.7 | 10.1 | 11.1 | |||
| N | 222 | 201 | 423 | |||
| Gender | Female | Age (years) | Mean | 62.1 | 68.0 | 64.0 |
| SD | 11.7 | 9.1 | 11.3 | |||
| N | 112 | 53 | 165 | |||
| Male | Age (years) | Mean | 56.5 | 62.1 | 59.7 | |
| SD | 10.9 | 10.0 | 10.7 | |||
| N | 110 | 148 | 258 | |||
| Arterial hypertension | no | N | 100 | 59 | 159 | |
| yes | N | 122 | 142 | 264 | ||
| Hyperlipidemia | no | N | 100 | 66 | 166 | |
| yes | N | 122 | 135 | 257 | ||
| Active or former smoking | no | N | 142 | 122 | 264 | |
| yes | N | 80 | 79 | 159 | ||
| Diabetes of any type | no | N | 196 | 154 | 350 | |
| yes | N | 26 | 47 | 73 | ||
| Family history | no | N | 157 | 143 | 300 | |
| yes | N | 65 | 58 | 123 | ||
| Obesity | no | N | 135 | 106 | 241 | |
| yes | N | 87 | 95 | 182 | ||
| Other risk factors | no | N | 217 | 190 | 407 | |
| yes | N | 5 | 11 | 16 | ||
| Number of risk factors | 0 | N | 16 | 7 | 23 | |
| 1 | N | 50 | 21 | 71 | ||
| 2 | N | 59 | 54 | 113 | ||
| 3 | N | 60 | 64 | 124 | ||
| 4 | N | 28 | 36 | 64 | ||
| 5 | N | 7 | 12 | 19 | ||
| 6 | N | 2 | 7 | 9 | ||
| Myocardial infarctionin patient history | no | N | 217 | 162 | 379 | |
| yes | N | 5 | 39 | 44 | ||
Risk factors were more frequently encountered in patients with coronary stenosis. Only 7 (3.5%) patients had no risk factors, whereas 173 (86.1%) had at least two risk factors. The majority of patients without coronary stenosis had at least one risk factor (Table 2). In a logistic regression model including all risk factors, age, and gender, the following factors were associated with an increased risk of coronary stenosis: age over 65 years (OR 1.96 [2.23-5.61]), male gender (OR 3.54 [2.23-5.61]), arterial hypertension (OR 1.97 [1.25-3.09]), and diabetes of any type (OR 2.11 [1.18-3.77]; all P < 0.01). A weak and not significant association could also be seen with hyperlipidemia of any type (OR 1.47 [0.95-2.25]; P = 0.08). On the basis of this model, 64.8% of all patients were correctly classified (OR 3.35 [2.24-5.01]; see the summary in Table 3).
Prediction of coronary stenosis by logistic regression with risk factors (“RF”), by logistic regression with risk factors and MI history (“RF + MI”), by logistic regression with risk factors and severity score (cut-off 4.0; “SC + RF”), by logistic regression with risk factors and MI history and severity score (cut-off 4.0; “SC + RF + MI”), and by severity score (cut-off 4.0; “SC”) alone for total population, gender, age groups, and MI history.
| n | TP | TN | FP | FN | a piori | Correct | Sens | Spec | PPV | NPV | LR+ | LR- | OddsRatio | OR 95% CI | ROC AUC | ROC AUC 95% CI | |||||
|---|---|---|---|---|---|---|---|---|---|---|---|---|---|---|---|---|---|---|---|---|---|
| Lower | Upper | ||||||||||||||||||||
| Lower | Upper | ||||||||||||||||||||
| Total | RF | 423 | 120 | 154 | 68 | 81 | 0.475 | 0.648 | 0.597 | 0.694 | 0.615 | 0.677 | 1.949 | 0.581 | 3.36 | 2.25 | 5.01 | 0.715 | 0.667 | 0.763 | |
| RF + MI | 423 | 124 | 168 | 54 | 77 | 0.475 | 0.690 | 0.617 | 0.757 | 0.675 | 0.707 | 2.536 | 0.506 | 5.01 | 3.30 | 7.61 | 0.757 | 0.712 | 0.802 | ||
| SC + RF | 423 | 180 | 180 | 42 | 21 | 0.475 | 0.851 | 0.896 | 0.811 | 0.795 | 0.904 | 4.733 | 0.129 | 36.73 | 20.92 | 64.51 | 0.890 | 0.857 | 0.922 | ||
| SC + RF + MI | 423 | 181 | 181 | 41 | 20 | 0.475 | 0.856 | 0.900 | 0.815 | 0.800 | 0.909 | 4.876 | 0.122 | 39.95 | 22.53 | 70.85 | 0.903 | 0.874 | 0.933 | ||
| SC | 423 | 179 | 180 | 42 | 22 | 0.475 | 0.849 | 0.891 | 0.811 | 0.794 | 0.900 | 4.707 | 0.135 | 34.87 | 20.00 | 60.79 | 0.843 | 0.802 | 0.884 | ||
| Female | RF | 165 | 15 | 100 | 12 | 38 | 0.321 | 0.697 | 0.283 | 0.893 | 0.371 | 0.848 | 2.642 | 0.803 | 3.29 | 1.41 | 7.67 | 0.691 | 0.607 | 0.776 | |
| RF + MI | 165 | 18 | 106 | 6 | 35 | 0.321 | 0.752 | 0.340 | 0.946 | 0.587 | 0.865 | 6.340 | 0.698 | 9.09 | 3.34 | 24.69 | 0.762 | 0.682 | 0.841 | ||
| SC + RF | 165 | 45 | 100 | 12 | 8 | 0.321 | 0.879 | 0.849 | 0.893 | 0.640 | 0.964 | 7.925 | 0.169 | 46.88 | 17.93 | 122.58 | 0.922 | 0.872 | 0.972 | ||
| SC + RF + MI | 165 | 45 | 103 | 9 | 8 | 0.321 | 0.897 | 0.849 | 0.920 | 0.703 | 0.965 | 10.566 | 0.164 | 64.38 | 23.34 | 177.59 | 0.932 | 0.883 | 0.981 | ||
| SC | 165 | 47 | 98 | 14 | 6 | 0.321 | 0.879 | 0.887 | 0.875 | 0.614 | 0.972 | 7.094 | 0.129 | 54.83 | 19.82 | 151.70 | 0.861 | 0.799 | 0.923 | ||
| Male | RF | 258 | 111 | 55 | 55 | 37 | 0.574 | 0.643 | 0.750 | 0.500 | 0.731 | 0.525 | 1.500 | 0.500 | 3.00 | 1.77 | 5.08 | 0.687 | 0.622 | 0.751 | |
| RF + MI | 258 | 104 | 65 | 45 | 44 | 0.574 | 0.655 | 0.703 | 0.591 | 0.757 | 0.523 | 1.718 | 0.503 | 3.41 | 2.03 | 5.73 | 0.728 | 0.668 | 0.789 | ||
| SC + RF | 258 | 136 | 82 | 28 | 12 | 0.574 | 0.845 | 0.919 | 0.745 | 0.867 | 0.835 | 3.610 | 0.109 | 33.19 | 16.00 | 68.85 | 0.864 | 0.817 | 0.912 | ||
| SC + RF + MI | 258 | 137 | 82 | 28 | 11 | 0.574 | 0.849 | 0.926 | 0.745 | 0.868 | 0.847 | 3.637 | 0.100 | 36.47 | 17.24 | 77.15 | 0.884 | 0.842 | 0.926 | ||
| SC | 258 | 132 | 82 | 28 | 16 | 0.574 | 0.829 | 0.892 | 0.745 | 0.864 | 0.792 | 3.504 | 0.145 | 24.16 | 12.32 | 47.37 | 0.825 | 0.768 | 0.882 | ||
| < 65 years | RF | 246 | 53 | 113 | 30 | 50 | 0.419 | 0.675 | 0.515 | 0.790 | 0.560 | 0.758 | 2.453 | 0.614 | 3.99 | 2.29 | 6.98 | 0.709 | 0.645 | 0.773 | |
| RF + MI | 246 | 56 | 119 | 24 | 47 | 0.419 | 0.711 | 0.544 | 0.832 | 0.627 | 0.779 | 3.239 | 0.548 | 5.91 | 3.29 | 10.61 | 0.757 | 0.697 | 0.818 | ||
| SC + RF | 246 | 90 | 121 | 22 | 13 | 0.419 | 0.858 | 0.874 | 0.846 | 0.747 | 0.928 | 5.680 | 0.149 | 38.08 | 18.21 | 79.64 | 0.892 | 0.849 | 0.934 | ||
| SC + RF + MI | 246 | 92 | 120 | 23 | 11 | 0.419 | 0.862 | 0.893 | 0.839 | 0.742 | 0.938 | 5.553 | 0.127 | 43.64 | 20.24 | 94.07 | 0.906 | 0.866 | 0.945 | ||
| SC | 246 | 89 | 121 | 22 | 14 | 0.419 | 0.854 | 0.864 | 0.846 | 0.744 | 0.923 | 5.617 | 0.161 | 34.96 | 16.95 | 72.11 | 0.873 | 0.826 | 0.919 | ||
| > 65 years | RF | 177 | 70 | 50 | 29 | 28 | 0.554 | 0.678 | 0.714 | 0.633 | 0.750 | 0.590 | 1.946 | 0.451 | 4.31 | 2.29 | 8.12 | 0.718 | 0.643 | 0.793 | |
| RF + MI | 177 | 70 | 54 | 25 | 28 | 0.554 | 0.701 | 0.714 | 0.684 | 0.776 | 0.609 | 2.257 | 0.418 | 5.40 | 2.83 | 10.30 | 0.746 | 0.675 | 0.818 | ||
| SC + RF | 177 | 91 | 60 | 19 | 7 | 0.554 | 0.853 | 0.929 | 0.759 | 0.856 | 0.874 | 3.861 | 0.094 | 41.05 | 16.27 | 103.62 | 0.897 | 0.846 | 0.949 | ||
| SC + RF + MI | 177 | 87 | 61 | 18 | 11 | 0.554 | 0.836 | 0.888 | 0.772 | 0.857 | 0.817 | 3.896 | 0.145 | 26.80 | 11.82 | 60.76 | 0.907 | 0.860 | 0.953 | ||
| SC | 177 | 90 | 59 | 20 | 8 | 0.554 | 0.842 | 0.918 | 0.747 | 0.848 | 0.856 | 3.628 | 0.109 | 33.19 | 13.72 | 80.27 | 0.789 | 0.712 | 0.865 | ||
| Female, < 65 years | RF | 79 | 0 | 60 | 1 | 18 | 0.228 | 0.759 | 0.000 | 0.984 | 0.000 | 0.919 | 0.000 | 1.017 | NaN | NaN | NaN | 0.712 | 0.590 | 0.835 | |
| RF + MI | 79 | 5 | 61 | 0 | 13 | 0.228 | 0.835 | 0.278 | 1.000 | 1.000 | 0.941 | NaN | 0.722 | NaN | NaN | NaN | 0.838 | 0.739 | 0.938 | ||
| SC + RF | 79 | 13 | 59 | 2 | 5 | 0.228 | 0.911 | 0.722 | 0.967 | 0.657 | 0.976 | 22.028 | 0.287 | 76.70 | 13.38 | 439.76 | 0.919 | 0.849 | 0.988 | ||
| SC + RF + MI | 79 | 13 | 59 | 2 | 5 | 0.228 | 0.911 | 0.722 | 0.967 | 0.657 | 0.976 | 22.028 | 0.287 | 76.70 | 13.38 | 439.76 | 0.934 | 0.876 | 0.993 | ||
| SC | 79 | 13 | 57 | 4 | 5 | 0.228 | 0.886 | 0.722 | 0.934 | 0.490 | 0.975 | 11.014 | 0.297 | 37.05 | 8.72 | 157.35 | 0.845 | 0.730 | 0.959 | ||
| Female, > 65 years | RF | 86 | 14 | 42 | 9 | 21 | 0.407 | 0.651 | 0.400 | 0.824 | 0.516 | 0.745 | 2.267 | 0.729 | 3.11 | 1.16 | 8.35 | 0.678 | 0.562 | 0.794 | |
| RF + MI | 86 | 15 | 46 | 5 | 20 | 0.407 | 0.709 | 0.429 | 0.902 | 0.673 | 0.770 | 4.371 | 0.634 | 6.90 | 2.21 | 21.58 | 0.718 | 0.607 | 0.830 | ||
| SC + RF | 86 | 34 | 42 | 9 | 1 | 0.407 | 0.884 | 0.971 | 0.824 | 0.722 | 0.984 | 5.505 | 0.035 | 158.67 | 19.14 | 1315.13 | 0.960 | 0.925 | 0.995 | ||
| SC + RF + MI | 86 | 33 | 46 | 5 | 2 | 0.407 | 0.919 | 0.943 | 0.902 | 0.819 | 0.971 | 9.617 | 0.063 | 151.80 | 27.74 | 830.69 | 0.973 | 0.944 | 1.001 | ||
| SC | 86 | 34 | 41 | 10 | 1 | 0.407 | 0.872 | 0.971 | 0.804 | 0.700 | 0.984 | 4.954 | 0.036 | 139.40 | 16.98 | 1144.41 | 0.834 | 0.741 | 0.927 | ||
| Male, < 65 years | RF | 167 | 52 | 55 | 27 | 33 | 0.509 | 0.641 | 0.612 | 0.671 | 0.666 | 0.617 | 1.858 | 0.579 | 3.21 | 1.70 | 6.05 | 0.656 | 0.573 | 0.739 | |
| RF + MI | 167 | 44 | 61 | 21 | 41 | 0.509 | 0.629 | 0.518 | 0.744 | 0.685 | 0.589 | 2.021 | 0.648 | 3.12 | 1.62 | 5.99 | 0.712 | 0.635 | 0.790 | ||
| SC + RF | 167 | 77 | 64 | 18 | 8 | 0.509 | 0.844 | 0.906 | 0.780 | 0.816 | 0.885 | 4.127 | 0.121 | 34.22 | 13.96 | 83.87 | 0.881 | 0.827 | 0.935 | ||
| SC + RF + MI | 167 | 78 | 64 | 18 | 7 | 0.509 | 0.850 | 0.918 | 0.780 | 0.818 | 0.898 | 4.180 | 0.106 | 39.62 | 15.58 | 100.77 | 0.898 | 0.850 | 0.946 | ||
| SC | 167 | 76 | 64 | 18 | 9 | 0.509 | 0.838 | 0.894 | 0.780 | 0.814 | 0.873 | 4.073 | 0.136 | 30.02 | 12.62 | 71.42 | 0.860 | 0.799 | 0.920 | ||
| Male, > 65 years | RF | 91 | 55 | 8 | 20 | 8 | 0.692 | 0.692 | 0.873 | 0.286 | 0.861 | 0.308 | 1.222 | 0.444 | 2.75 | 0.91 | 8.31 | 0.712 | 0.603 | 0.821 | |
| RF + MI | 91 | 54 | 7 | 21 | 9 | 0.692 | 0.670 | 0.857 | 0.250 | 0.853 | 0.257 | 1.143 | 0.571 | 2.00 | 0.66 | 6.06 | 0.735 | 0.633 | 0.837 | ||
| SC + RF | 91 | 60 | 17 | 11 | 3 | 0.692 | 0.846 | 0.952 | 0.607 | 0.925 | 0.716 | 2.424 | 0.078 | 30.91 | 7.73 | 123.54 | 0.834 | 0.739 | 0.929 | ||
| SC + RF + MI | 91 | 60 | 17 | 11 | 3 | 0.692 | 0.846 | 0.952 | 0.607 | 0.925 | 0.716 | 2.424 | 0.078 | 30.91 | 7.73 | 123.54 | 0.853 | 0.768 | 0.938 | ||
| SC | 91 | 56 | 18 | 10 | 7 | 0.692 | 0.813 | 0.889 | 0.643 | 0.926 | 0.533 | 2.489 | 0.173 | 14.40 | 4.78 | 43.36 | 0.745 | 0.620 | 0.869 | ||
| No MI in history | RF | 379 | 86 | 170 | 47 | 76 | 0.427 | 0.675 | 0.531 | 0.783 | 0.577 | 0.750 | 2.451 | 0.599 | 4.09 | 2.62 | 6.40 | 0.719 | 0.668 | 0.770 | |
| SC + RF | 379 | 142 | 177 | 40 | 20 | 0.427 | 0.842 | 0.877 | 0.816 | 0.726 | 0.922 | 4.755 | 0.151 | 31.42 | 17.58 | 56.14 | 0.881 | 0.845 | 0.918 | ||
| SC | 379 | 142 | 175 | 42 | 20 | 0.427 | 0.836 | 0.877 | 0.806 | 0.716 | 0.921 | 4.529 | 0.153 | 29.58 | 16.62 | 52.66 | 0.834 | 0.791 | 0.878 | ||
n = number of cases; TP = true positives; TN = true negatives; FP = false positives; FN = false negatives; a priori = a priori probability of stenosis; Correct = fraction of correctly predicted cases; Sens = sensitivity; Spec = specificity; PPV = positive predictive value; NPV = negative predictive value; LR+ = positive likelihood ratio; LR- = negative likelihood ratio; OR = odds ratio; ROC AUC = receiver operating curve area under the curve (for continuous severity score and probabilities from logistic regression models); 95% CI = 95% confidence interval; Lower = Lower boundary of 95% CI; Upper = Upper boundary of 95% CI; NaN = Not a number; MI = Myocardial infarction
When a history of MI was included in the model, history of MI showed the strongest effect (OR 10.59 [3.51-31.93]), while the effects age over 65 years (OR 2.16 [1.31-3.56]), male gender (OR 3.48 [2.12-5.73]), arterial hypertension (OR 2.11 [1.29-3.45]; all P < 0.01), and diabetes of any type (OR 2.17 [1.18-3.96]; P < 0.05) were similar. On the basis of this model, 69% of all patients were correctly classified (OR 5.01 [3.30-7.61], summary in Table 3).
The severity score ranged from 0 to 15, mean 3.8 +/- 2.6, with 47.8% of all patients having a severity score of less than 4. There was no patient whose severity score was greater than 15 in this cohort. For patients with hemodynamically relevant coronary stenosis as diagnosed at angiography, the severity score was significantly higher than that for patients without stenosis (5.3 +/- 1.9 vs. 2.5 +/- 2.5; P < 0.01; Figure 1). For the association between severity score and coronary stenosis, the area under the ROC curve was calculated to be 0.843 [0.802-0.884]. The coordinates of the curve indicated that the cut-off of 4.0 (as pre-defined by the manufacturer) provided the best combination of sensitivity and specificity for the prediction of hemodynamically relevant coronary stenosis from the 3DMP test.
Severity score versus coronary stenosis as diagnosed by angiography. Boxplots of severity score. Circles denote outliers, asterisk denotes extremes.
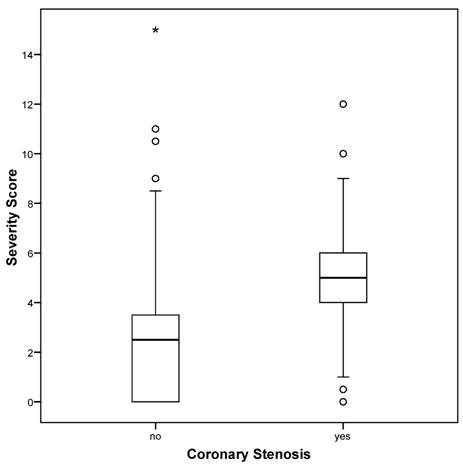
Patients without coronary stenosis had a severity score below 4.0 significantly more frequently than did those with stenosis (P < 0.01) with 84.9% of all patients correctly classified (OR 34.87 [20.00-60.79]). The results listed in Table 4 indicate a sensitivity of 89.1% and a specificity of 81.1% for the 3DMP test in the prediction of coronary stenosis (positive predictive value = 0.794, negative predictive value = 0.900). A positive likelihood ratio of nearly 5 and a negative likelihood ratio of less than 0.15 indicate a good to strong diagnostic value for this test (Table 3).
Prediction of coronary stenosis by severity score (cut-off 4.0).
| Prediction Cut-off 4.0 | Total | ||||
|---|---|---|---|---|---|
| No stenosis | Stenosis | ||||
| Coronary stenosis | no | 180 | 42 | 222 | |
| 42.6% | 9.9% | 52.5% | |||
| yes | 22 | 179 | 201 | ||
| 5.2% | 42.3% | 47.5% | |||
| Total | 202 | 221 | 423 | ||
| 47.8% | 52.2% | 100.0% | |||
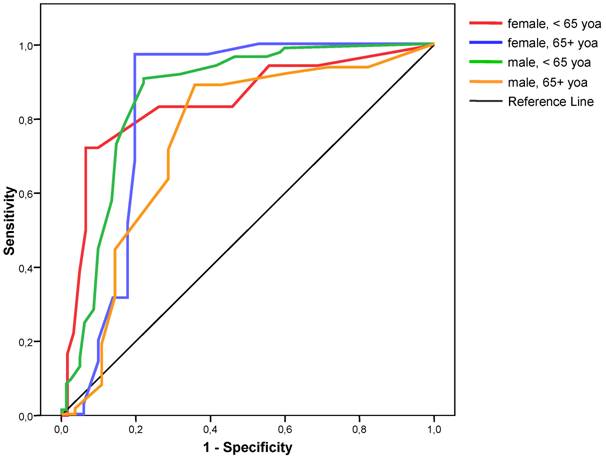
Sensitivity and specificity varied between gender and age groups. Logistic regression showed that both gender and age had a significant independent influence on the classification results. For females less than 65 years of age, the sensitivity was lowest and the specificity highest; for females over 65 years of age, sensitivity was highest, whereas specificity was lowest for males over 65 years of age (Table 3). Analysis of ROC also showed that the best cut-off for each subgroup remained at 4.0 (Figure 2).
ROC curves for severity score for the detection of coronary stenosis for different gender and age groups. yoa = years of age
Logistic regression also showed that the addition of all risk factors did not significantly improve the classification of coronary stenosis (85.1% correct; OR 36.73 [20.92-64.51]). When information about MI history was added to this model again the classification, performance did not change markedly (85.6% correct; OR 39.95 [20.53-70.85].
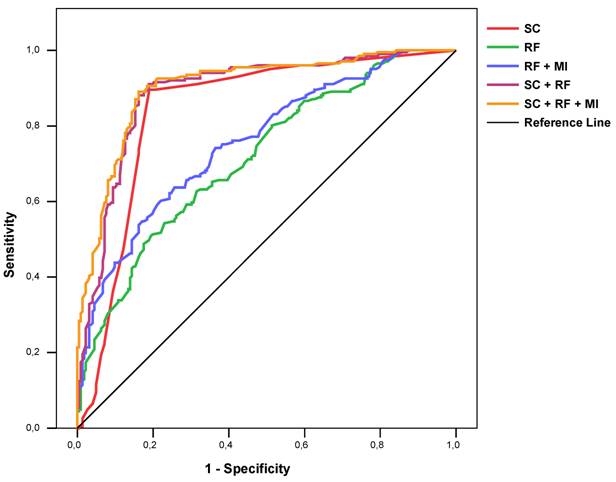
The ROC AUC for a regression model with all risk factors, all risk factors plus information about MI history, the severity score alone, a regression model with the severity score plus all risk factors, and a regression model with the severity score plus all risk factors and information about MI history were 0.715 [0.667-0.763], 0.757 [0.712-0.802], 0.843 [0.802-0.884], 0.890 [0.857-0.922], and 0.903 [0.874-0.933] respectively (Figure 3). Similar results could be found for each gender and age group (Table 3).
ROC curves of severity score alone (“SC”), risk factors (logistic regression model, “RF”), risk factors and MI history (logistic regression, “RF + MI”), risk factors plus severity score (logistic regression model, “SC + RF”), and risk factors plus severity score and MI history (logistic regression model, “SC + RF+ MI”), for detecting coronary stenosis.
If patients with history of MI were excluded the diagnostic performance of 3DMP did not change significantly with 83.6% of these patients correctly classified (details in Table 3). The calculation of a regression model in the group of patients with MI history was meaningless due to the high prevalence of stenosis in this group of patients. But of those 5 patients with a history of MI who did not show relevant coronary in angiography none tested positive with 3DMP.
To further evaluate performance of 3DMP, sensitivity and specificity were evaluated at different cut-offs for severity (Table 5). This comparison also showed that a cut-off of 4.0 provided the best compromise of sensitivity and specificity. At lower cut-offs such as 3.0, the negative predictive value is over 90%, which may be advantageous for screening applications.
Prediction of coronary stenosis by severity score at different cut-offs for total population (n = 423, a priori probability of stenosis = 0.475).
| TP | TN | FP | FN | Sens | Spec | PPV | NPV | Correct | OR | OR 95% CI | ||
|---|---|---|---|---|---|---|---|---|---|---|---|---|
| Lower | Upper | |||||||||||
| Cut-Off 2.0 | 193 | 91 | 131 | 8 | 0.960 | 0.410 | 0.572 | 0.926 | 0.671 | 16.76 | 7.87 | 35.69 |
| Cut-Off 2.5 | 191 | 109 | 113 | 10 | 0.950 | 0.491 | 0.605 | 0.923 | 0.709 | 18.42 | 9.26 | 36.66 |
| Cut-Off 3.0 | 187 | 128 | 94 | 14 | 0.930 | 0.577 | 0.643 | 0.910 | 0.745 | 18.19 | 9.93 | 33.30 |
| Cut-Off 3.5 | 183 | 152 | 70 | 18 | 0.910 | 0.685 | 0.703 | 0.903 | 0.792 | 22.08 | 12.60 | 38.68 |
| Cut-Off 4.0 | 179 | 180 | 42 | 22 | 0.891 | 0.811 | 0.794 | 0.900 | 0.849 | 34.87 | 20.00 | 60.79 |
| Cut-Off 4.5 | 146 | 186 | 36 | 55 | 0.726 | 0.838 | 0.786 | 0.789 | 0.785 | 13.72 | 8.55 | 22.01 |
| Cut-Off 5.0 | 129 | 189 | 33 | 72 | 0.642 | 0.851 | 0.780 | 0.744 | 0.752 | 10.26 | 6.42 | 16.40 |
TP = true positives; TN = true negatives; FP = false positives; FN = false negatives; correct = fraction of correctly predicted cases; Sens = sensitivity; Spec = specificity; PPV = positive predictive value; NPV = negative predictive value; OR = odds ratio; 95% CI = 95% confidence interval; Lower = Lower boundary of 95% CI; Upper = Upper boundary of 95% CI
A second 3DMP test was performed on 45 patients within 4 hours of the first test and before angiography. The test results were identical in 36 of the 45 patients. Only 3 patients had a difference in severity score of greater than 1. In only one patient would the difference have led to a change in classification (3.8 for the first test, 6.0 for the second test). Angiography showed hemodynamically relevant CAD in this patient.
Verification after the end of the data acquisition period confirmed that locally stored and transmitted ECG data were identical for all recordings.
4. Discussion
The age and gender distributions in the studied patient group matched those in the literature with a lower incidence and older age for women at the time of initial diagnosis of CAD [21]. The incidence of clinically identified risk factors for CAD among the studied patients was very high in both patients with and without coronary stenosis. The calculated relative risk for coronary stenosis resulting from the risk factors in the study group is in the range of that reported in the literature from larger epidemiologic studies [11-14].
The overall sensitivity of 89.1% and specificity of 81.1% provided by the 3DMP device in the detection of hemodynamically relevant CAD confirms the results of the smaller study from Weiss et al comparing 3DMP and 12-lead ECG with coronary angiography in 136 patients (sensitivity 93%, specificity of 83%), although their results were based on a qualitative assessment of ischemia by the 3DMP system [18]. The quantitative severity score used in the present study was not available at that time; this may allow for greater flexibility when it is used for screening or monitoring of CAD to determine the level of disease or quantifying the patient's myocardial ischemic burden at the time of the testing.
Resting ECG analysis, including that of the 12-lead ECG, typically has significantly less sensitivity in detecting ischemia. Clinical studies report a wide range of sensitivity from 20% to 70% for acute myocardial infarction and typically less for hemodynamically significant CAD [2,22].
Diagnostic yield from the ECG can be improved by exercise testing. Exercise ECG has a reported specificity of over 80% under ideal conditions. Clinically, however, the sensitivity is typically not better than 50-60% and shows significant gender bias [4,23-25]. Performance of exercise ECG testing can further be enhanced by multivariate analysis of ECG and clinical variables. First studies into computerized, multivariate exercise ECG analysis showed good to excellent sensitivity in men and women (83% and 70%, respectively) and specificity (93%, 89%) [26, 27]. These results were confirmed by a second group of researchers [28] and are similar to our findings with 3DMP. Other researchers used different statistical approaches and models of multivariate stress ECG analysis with different sets of variables included in the models [29, 30, 31, 32]. While these approaches provided significantly better diagnostic performance than standard exercise ECG testing, it appears that none of these methods has been implemented in broad clinical practice or a commercial product.
In a comprehensive systematic review of 16 prospective studies myocardial perfusion scintigraphy showed better positive and negative likelihood ratios than exercise ECG testing [33]. But wide variation between studies was reported with positive LR ranging from 0.95 to 8.77 and negative LR from 1.12 to 0.09. Another review of stress scintigraphy studies showed similar results with a diagnostic accuracy of 85% by wide variation between studies (sensitivity 44%-89%, specificity 89%-94%, for 2+vessel disease) [34]. In one study the combination of stress ECG testing with myocardial scintigraphy using multivariate analysis provided only limited improvement of diagnostic accuracy [35]
Stress echocardiography performed by experienced investigators may provide better sensitivity and specificity than does stress ECG. Numerous studies into exercise echocardiography as a diagnostic tool for CAD have been done. Reported sensitivities range from 31% to over 90% and specificities from 46% to nearly 100% [36, 37, 38]. With experienced investigators, sensitivities of over 70% and specificities better than 85% can be expected.
While the reported diagnostic performance of stress echocardiography, myocardial scintigraphy and stress scintigraphy are not unsimilar to that we found for 3DMP, imaging modalities can provide additional information such as spatial localization that a resting ECG method cannot.
All exercise testing methods requires significant personnel and time resources, have relevant contraindications, and bear a small but measurable morbidity and mortality [5,6,24,25].
Although 3DMP's sensitivity and specificity for the detection of coronary stenosis was good to excellent in all age and gender groups, there were obvious differences between groups. The lowest sensitivity of 72.2% was observed in female patients of 65 or less years of age. Although this observation might be a statistical epiphenomenon due to the small number of positives, it may also be explained by the less frequent occurrence of specific ECG changes in women with CAD reported in other studies [40]. Similar differences have been reported from exercise ECG and exercise echocardiography [36, 40]. Despite the differences in sensitivity and specificity between age and gender groups, the optimal cut-off for the severity score was not different between groups.
On the basis of the risk factors identified clinically in the studied patients, the odds ratio for CAD was 3.35 [2.24-5.01] in a logistic regression model. This is in concordance with large epidemiological studies [11-14]. Still, this model could predict coronary stenosis only with a sensitivity of 59.7% and a specificity of 69.4%, which is markedly less than for the severity score. Adding all risk factors with or without information about previous MI to the severity score in a logistic regression model improved prediction of CAD only marginally (details in Table 3). Moreover, performance of 3DMP was not significantly different whether or not patients with previous MI were excluded. This may have clinical relevance as silent myocardial infarction may not be known prior to performing the test in a relevant number of patients [41, 42]. Based on the findings of our study it can be assumed that diagnostic yield of 3DMP will not be affected by this.
The endpoint of this study was the morphological diagnosis of CAD made with coronary angiography, whereas the investigated electrophysiological method (3DMP) assesses functional changes of electrical myocardial function secondary to changes in coronary blood flow. Therefore, even under ideal conditions, 100% concordance between angiographic findings and 3DMP results cannot be expected. This is probably true for every electrophysiological diagnostic method.
Resting and stress ECG in CAD patients primarily focuses on ST-segment analysis and the detection of other conduction abnormalities such as arrhythmias. This is not comparable to the 3DMP approach in which a severity score for CAD is calculated from a complex mathematical analysis. A comparison between 3DMP, 12-lead resting ECG, and coronary angiography in the study by Weiss et al. showed a higher sensitivity and specificity for the detection of coronary stenosis by 3DMP than by 12-lead ECG [18].
One limitation of the present study was that the angiography results were not explicitly quantified using a scoring system [43]. Still, the assessment of coronary lesions in the present study was consistent between the two experienced angiographers who independently evaluated the angiograms. Because the target criterion was hemodynamically relevant coronary stenosis and a dichotomous classification (“stenosis” or “no stenosis”) was used, sub-clinical or sub-critical lesions may have been classified as non-relevant. This may have artificially reduced the calculated sensitivity and specificity of the 3DMP method and may explain some of the differences from the study by Weiss et al., which used a graded assessment of coronary lesions [18]. Another limitation may have been in patient recruitment. The patient population represented a convenience sample of patients drawn from a larger group of consecutive patients scheduled for coronary angiography in a single heart center. Whereas this may limit the generalizability of the patient sample employed herein, the demographic distribution of this sample matches well with the distributions reported in the literature for patients with CAD as well as with the incidence and distribution of risk factors. In addition, 52.5% of the participants did not have hemodynamically significant CAD so that the a priori probability of coronary stenosis in the study population should not affect the estimates for sensitivity and specificity. Finally, 3DMP was compared to angiography but not to any other non-invasive diagnostic technology in this study. Therefore, inference about the potential superiority or inferiority of 3DMP to other ECG-based methods can only be drawn indirectly from other studies.
In conclusion, the mathematical analysis of the ECG done by 3DMP appears to provide very high sensitivity and specificity for the prediction of hemodynamically relevant CAD as diagnosed with coronary angiography. In the present study and in the previous study by Weiss et al [18], 3DMP showed at least as good sensitivity and specificity for the prediction of CAD as do standard resting or stress ECG test methods reported in other clinical studies. However, these results will require further confirmation through studies directly comparing 3DMP with such methods.
Acknowledgements
The authors are extremely grateful to Prof. Hans Joachim Trampisch, Department for Medical Informatics, Biometrics and Epidemiology, Ruhr-University Bochum, Germany, for his critical review of statistical methodology and data analysis; to H. Robert Silverstein, MD, FACC, St. Vincent Hospital, Hartford, CT, USA, and Eric Fedel, Premier Heart, LLC, Port Washington, NY, USA, for their constructive comments and help with the manuscript; and to Joshua W. Klein, Premier Heart, LLC, Port Washington, NY, USA, and George Powell, Tokyo, Japan, for their thorough and thoughtful language and copy editing.
We would also like to thank the anonymous reviewers for their valuable comments and critique.
Funding
This study was supported in part by institutional funds and in part by an unrestricted research grant from Premier Heart, LLC. Premier Heart, LLC provided the 3DMP equipment for this study free of charge.
Competing Interests
Dr. Shen is founder and managing member of Premier Heart, LLC. He is also co-inventor of the web-based 3DMP method. The other authors have declared that no conflict of interest exists.
References
1. OECD. OECD Health Data 2005: Statistics and Indicators for 30 Countries. Paris: OECD Publishing. 2005
2. Ammar KA, Kors JA, Yawn BP, Rodeheffer RJ. Defining unrecognized myocardial infarction: a call for standardized electrocardiographic diagnostic criteria. Am Heart J. 2004;148:277-284
3. Salerno SM, Alguire PC, Waxman HS. Competency in interpretation of 12-lead electrocardiograms: a summary and appraisal of published evidence. Ann Intern Med. 2003;138:751-760
4. Tak T, Gutierrez R. Comparing stress testing methods. Available techniques and their use in CAD evaluation. Postgrad Med. 2004;115:61-70
5. Gibbons RJ, Balady GJ, Beasley JW. et al. ACC/AHA Guidelines for Exercise Testing. A report of the American College of Cardiology/American Heart Association Task Force on Practice Guidelines (Committee on Exercise Testing). J Am Coll Cardiol. 1997;30:260-311
6. Gibbons RJ, Balady GJ, Bricker JT. et al. ACC/AHA 2002 guideline update for exercise testing: summary article: a report of the American College of Cardiology/American Heart Association Task Force on Practice Guidelines (Committee to Update the 1997 Exercise Testing Guidelines). Circulation. 2002;106:1883-1892
7. Braunwald E, Antman EM, Beasley JW. et al. ACC/AHA guideline update for the management of patients with unstable angina and non-ST-segment elevation myocardial infarction--2002: summary article: a report of the American College of Cardiology/American Heart Association Task Force on Practice Guidelines (Committee on the Management of Patients with Unstable Angina). Circulation. 2002;106:1893-1900
8. Gibbons RJ, Abrams J, Chatterjee K. et al. ACC/AHA 2002 guideline update for the management of patients with chronic stable angina--summary article: a report of the American College of Cardiology/American Heart Association Task Force on practice guidelines (Committee on the Management of Patients with Chronic Stable Angina). J Am Coll Cardio. 2003;41:159-168
9. Mason JJ, Owens DK, Harris RA, Cooke JP, Hlatky MA. The role of coronary angiography and coronary revascularization before noncardiac vascular surgery. JAMA. 1995;273:1919-1925
10. Scanlon PJ, Faxon DP, Audet AM. et al. ACC/AHA guidelines for coronary angiography: executive summary and recommendations. A report of the American College of Cardiology/American Heart Association Task Force on Practice Guidelines (Committee on Coronary Angiography) developed in collaboration with the Society for Cardiac Angiography and Interventions. Circulation. 1999;99:2345-2357
11. Greenland P, Knoll MD, Stamler J. et al. Major risk factors as antecedents of fatal and nonfatal coronary heart disease events. JAMA. 2003;290:891-897
12. Khot UN, Khot MB, Bajzer CT. et al. Prevalence of conventional risk factors in patients with coronary heart disease. JAMA. 2003;290:898-904
13. Wilson PW, D'Agostino RB, Levy D, Belanger AM, Silbershatz H, Kannel WB. Prediction of coronary heart disease using risk factor categories. Circulation. 1998;97:1837-1847
14. Yusuf S, Hawken S, Ounpuu S. et al. Effect of potentially modifiable risk factors associated with myocardial infarction in 52 countries (the INTERHEART study): case-control study. Lancet. 2004;364:937-952
15. Hurst JW. Current status of clinical electrocardiography with suggestions for the improvement of the interpretive process. Am J Cardiol. 2003;92:1072-1079
16. Eskola MJ, Nikus KC, Voipio-Pulkki LM. et al. Comparative accuracy of manual versus computerized electrocardiographic measurement of J-, ST- and T-wave deviations in patients with acute coronary syndrome. Am J Cardiol. 2005;96:1584-1588
17. Feng G. EKG and EEG Multiphase Information Analysis (A collection of unpublished notes, thesis, papers and published articles from mid seventies to the late eighties translated into English from Chinese). First Edition. New York: American Medical Publishers. 1992
18. Weiss MB, Narasimhadevara SM, Feng GQ, Shen JT. Computer-enhanced frequency-domain and 12-lead electrocardiography accurately detect abnormalities consistent with obstructive and nonobstructive coronary artery disease. Heart Dis. 2002;4:2-12
19. Altman DG, Bland JM. Statistics Notes: Diagnostic tests 2: predictive values. BMJ. 1994;309:102
20. Deeks JJ, Altman DG. Diagnostic tests 4: likelihood ratios. BMJ. 2004;329:168-169
21. Thom T, Haase N, Rosamond W. et al. Heart disease and stroke statistics--2006 update: a report from the American Heart Association Statistics Committee and Stroke Statistics Subcommittee. Circulation. 2006;113:e85-151
22. Mant J, McManus RJ, Oakes RA. et al. Systematic review and modelling of the investigation of acute and chronic chest pain presenting in primary care. Health Technol Assess. 2004;8:1-158
23. Anthony D. Diagnosis and screening of coronary artery disease. Prim Care. 2005;32:931-946
24. Cox JL, Teskey RJ, Lalonde LD, Iles SE. Noninvasive testing in women presenting with chest pain: evidence for diagnostic uncertainty. Can J Cardiol. 1995;11:885-890
25. Curzen N, Patel D, Clarke D. et al. Women with chest pain: is exercise testing worthwhile? Heart. 1996;76:156-160
26. Detry JM, Robert A, Luwaert RJ. et al. Diagnostic value of computerized exercise testing in men without previous myocardial infarction. A multivariate, compartmental and probabilistic approach. Eur Heart J. 1985;6:227-238
27. Robert AR, Melin JA, Detry JM. Logistic discriminant analysis improves diagnostic accuracy of exercise testing for coronary artery disease in women. Circulation. 1991;83:1202-1209
28. Deckers JW, Rensing BJ, Tijssen JG. et al. A comparison of methods of analysing exercise tests for diagnosis of coronary artery disease. Br Heart J. 1989;62:438-444
29. Koide Y, Yotsukura M, Yoshino H, Ishikawa K. A new coronary artery disease index of treadmill exercise electrocardiograms based on the step-up diagnostic method. Am J Cardiol. 2001;87:142-147
30. Lehtinen R, Sievänen H, Uusitalo A. et al. Performance characteristics of various exercise ECG classifiers in different clinical populations. J Electrocardiol. 1994;27:11-22
31. Pruvost P, Lablanche JM, Beuscart R. et al. Enhanced efficacy of computerized exercise test by multivariate analysis for the diagnosis of coronary artery disease. A study of 558 men without previous myocardial infarction. Eur Heart J. 1987;8:1287-1294
32. Rodriguez M, Moussa I, Froning J. et al. Improved exercise test accuracy using discriminant function analysis and "recovery ST slope". J Electrocardiol. 1993;26:207-218
33. Mowatt G, Vale L, Brazzelli M, Hernandez R, Murray A, Scott N, Fraser C, McKenzie L, Gemmell H, Hillis G, Metcalfe M. Systematic review of the effectiveness and cost-effectiveness, and economic evaluation, of myocardial perfusion scintigraphy for the diagnosis and management of angina and myocardial infarction. Health Technol Assess. 2004;8:1-207
34. Elhendy A, Bax JJ, Poldermans D. Dobutamine stress myocardial perfusion imaging in coronary artery disease. J Nucl Med. 2002;43:1634-1646
35. Morise AP, Diamond GA, Detrano R, Bobbio M. Incremental value of exercise electrocardiography and thallium-201 testing in men and women for the presence and extent of coronary artery disease. Am Heart J. 1995;130:267-276
36. Geleijnse ML, Krenning BJ, Soliman OI. et al. Dobutamine stress echocardiography for the detection of coronary artery disease in women. Am J Cardiol. 2007;99:714-717
37. Marwick TH, Shaw L, Case C, Vasey C, Thomas JD. Clinical and economic impact of exercise electrocardiography and exercise echocardiography in clinical practice. Eur Heart J. 2003;24:1153-1163
38. Smart SC, Bhatia A, Hellman R. et al. Dobutamine-atropine stress echocardiography and dipyridamole sestamibi scintigraphy for the detection of coronary artery disease: limitations and concordance. J Am Coll Cardiol. 2000;36:1265-1273
39. Holubkov R, Pepine CJ, Rickens C. et al. Electrocardiogram abnormalities predict angiographic coronary artery disease in women with chest pain: results from the NHLBI WISE Study. Clin Cardiol. 2002;25:553-558
40. Mieres JH, Shaw LJ, Arai A. et al. Role of noninvasive testing in the clinical evaluation of women with suspected coronary artery disease: Consensus statement from the Cardiac Imaging Committee, Council on Clinical Cardiology, and the Cardiovascular Imaging and Intervention Committee, Council on Cardiovascular Radiology and Intervention, American Heart Association. Circulation. 2005;111:682-696
41. DeLuca AJ, Kaplan S, Aronow WS. et al. Comparison of prevalence of unrecognized myocardial infarction and of silent myocardial ischemia detected by a treadmill exercise sestamibi stress test in patients with versus without diabetes mellitus. Am J Cardiol. 2006;98:1045-1046
42. Macfarlane PW, Norrie J; WOSCOPS Executive Committee. The value of the electrocardiogram in risk assessment in primary prevention: experience from the West of Scotland Coronary Prevention Study. J Electrocardiol. 2007;40:101-109
43. Alderman E, Stadius M. The angiographic definitions of the Bypass Angioplasty Revascularization Investigation. Coron Artery Dis. 1992;3:1189-1207
44. ELE 436: Communication Systems. University of Rhode Island Department of Electrical and Computer Engineering. http://www.ele.uri.edu/~hansenj/projects/ele436/fft.pdf
45. Pelle G, Ohayon J, Oddou C, Brun P. Theoretical models in mechanics of the left ventricle. Biorheology. 1984;21:709-22
46. Choi HW, Barakat AI. Numerical study of the impact of non-Newtonian blood behavior on flow over a two-dimensional backward facing step. Biorheology. 2005;42:493-509
Appendix I – Premier Heart 3DMP Technology
Overview
The Premier Heart 3DMP technology investigated in this study is based on systems theory, in which mathematical modeling is used in the analysis of complex systems and the interactions of internal and external environments with those systems. In the case of the heart, analysis is performed on the signals emitted by the heart, such as the surface resting electrical signal recorded by an ECG.
In systems analysis, the ECG signals are therefore not analyzed conventionally, such as when each individual cardiac cycle (P-QRS-T complex) of each ECG lead is measured and analyzed in a single time domain (milliseconds vs. millivolts) in sequence. Rather, multiple cardiac cycles from both ECG leads are sampled, digitized, and analyzed individually and in relation to each other. This means that analysis focuses not only on the variations of heart harmonics in the frequency domain from each lead independently but also on other linear or non-linear correlations between the two leads in both frequency and time domains, in combination.
3DMP records a short (82-second) resting analog ECG signal from two left ventricular leads (V5 and II). The use of leads V5 and II has been empirically tested over many years and confirmed to provide the information required to build the analysis software. Following the principles of Systems Analysis this approach is considered adequate, as one only needs an input and an output of the systems of interest. The signal is amplified and digitized at a sampling rate of 100 Hz in multiple time series. As it could consistently be demonstrated that far more than 90% of the power output of the autopower spectra of the human ECGs in the 3DMP database fall within 50 Hz, 100 Hz are an adequate sampling rate as they are the respective Nyquist frequency. The signal is then converted to the frequency domain via DFT (Discrete Fourier Transforms) intervals [44]. These frequency intervals are then averaged following DFT procedures. The result is a signal-averaged digital data segment in the frequency domain with maximum signal-to-noise ratio. In the next step, post-averaging digital signal deconstruction takes place using a series of signal analysis functions. A sequence of abnormal indexes from a total of 166 discovered thus far is derived from each analysis, which quantify abnormalities in the ECG signals that are not expressed by conventional ECG methods. Over the years, an accumulation of abnormal elements or indexes has been discovered. The efforts to verify, validate in clinical trials, and quantify the thresholds of each index are largely complete. Clusters of indexes and their permutations, representing potential diagnoses, are compared probalistically with a proprietary database containing the abnormal index patterns of tens of thousands of patients with known and clinically verified diagnoses as well as with the patterns of several thousand normal individuals, male and female, from ages 14 to 91. The primary focus has been on the automatic detection of myocardial ischemia; the final diagnosis produced by the system includes the presence (or absence) of local or global myocardial ischemia and an associated severity score.
History and Development of 3DMP
Research into the theoretical models underlying 3DMP began in 1976 in the People's Republic of China in a project that investigated the effect of noise exposure on cardiac function under the auspices of the Academia Sinica, Institute of Dynamics, Beijing. Electrocardiographic analysis was found to be inadequate because although previous clinical observations correlated with noise exposure, electrocardiogram waveforms were consistently unremarkable.
The Chinese research group focused on ECG analysis and transformations and used a mathematical model of the myocardium and blood to address this problem. The first models of ECG transformations were tested using an animal model of acute myocardial infarction. This showed the potential of this mathematical approach to ECG analysis for detecting myocardial ischemia and stimulated further experimental and clinical research1. Several very ambitious clinical studies were conducted in the 1980s to test the system's ability to detect and differentiate eight differential diagnoses. As a result of these studies and from a better understanding of the mathematical approach, the research concentrated more and more on myocardial ischemia. The first DOS stand-alone PC version received FDA approval in 1995 (FDA 510(k) K953470).
After 1983, research continued outside China until the present day. An initial PC (DOS)-based version of the analytical system was used in clinical trials in 30 hospitals. Further research with this version was done in France, Belgium, and the US. During these trials, data from approximately 23,000 subjects (7,000 patients qualified as normal, 16,000 patients with confirmed cardiac pathologies) were collected for the construction of the initial 3DMP database (unpublished data).
Since then the system has evolved from a stand-alone version due to the need for an expanding centralized database and new algorithmic developments to prioritize the differential diagnosis of myocardial ischemia detection along with other secondary clinical diagnoses, such as myocardial infarction. A new quantitative scoring system has also been created and added to the analysis. The most recent version of the 3DMP system has been developed on a web-based paradigm which allows the analysis of remote ECGs on a centralized database. This new version of 3DMP, which also uses relational database architecture, received FDA clearance in 1999 (FDA 510(k) K992703). This version has been used in all current trials including the one in Siegburg, Germany, reported herein.
Basic principles of 3DMP
3DMP is based on a purely mathematical approach to ECG description that is validated against a very large clinical database. Whereas Einthoven historically presumed the myocardium to be a single-point electrical generator, research leading to the development of 3DMP began by using two mathematic descriptions of two intrinsic physiologic properties of the heart:
- First, the myocardium is a viscoelastic solid [45].
- Second, blood is a non-Newtonian fluid at low and intermediate shearing states [46].
To unify these two properties, these two mathematic relations can be fused into one using the Laplace transform.
Mathematical transformations of ECG data
The 3DMP ECG analysis employs six mathematical transformations. All these transformations are based on the power spectrum of the recorded ECG leads (Gxx for lead V5, and Gyy for lead II). The power spectrum uses both real and imaginary number sets where the domain of the coordinate plane is the set of real numbers [R] and the range encompasses the imaginary number set [I]. The autopower spectrum remains within the respective lead (V5 or II), and the cross-power spectrum (Gxy) is used when the attributes of each lead are to be compared. Empirical observation has elicited patterns among the six transformations that have consistently correlated with specific patient conditions.
Autopower Spectrum
The autopower spectrum, Gxx = Sx(f) • Sx(f)i and Gyy = Sy(f) • Sy(f)I, where S(f) and S(f)i represent the real and imaginary components of the FFT (f) function, respectively, depicts the power distribution along a frequency range of 0.1 to 50 Hz. Gxx is obtained from V5; thus, “x” represents the lead V5 input. Gyy is obtained from lead II; thus, “y” represents the lead II input. The autopower spectrum is a measure of the power in watts of each frequency of an ECG signal. The peak with the lowest frequency in the autopower spectrum represents the heart rate, which is generally around 1.2 Hz (72 bpm); higher frequency peaks will generally have less power than lower frequency peaks, with the signal generally fading out at approximately 35 Hz. On the basis of analysis of 23,000 ECGs with confirmed clinical diagnoses, it has been established that approximately 80% of the power exerted by the myocardium is represented in the first 10 peaks of the autopower spectrum graphic output. Based on the power spectra, 3DMP uses the remaining transformations, described below. The autopower spectrum data can be used to identify physiological or pathological conditions such as fast or slow heart rate, arrhythmias, and fibrillation. In addition, various peak-to-peak power amplitude abnormal distributions correlated well with clinical conditions such as myocardial ischemia, hypertensive heart disease, congestive heart failure, and cardiogenic shock.
Transfer Function
The transfer function Txy = Gxy / Gxx , Txy = A,φ has two components or phases. Dividing the cross-power spectrum (Gxy) by the lead V5 autopower spectrum (Gxx) yields two complementary components of phases of the frequency and power axes, namely amplitude and phase angle. The amplitude of this result is referred to as the transfer function. Transfer function is a measure of deviations away from 1, where 1 is the ideal ratio between Gxy and Gxx. Deviations from 1 may reflect myocardial abnormalities.
Phase Angle Shift of Transfer Function
The phase shift angle θxy = tan-1 {Txy(I) / Txy(R)} = tan-1 [{Gxy / Gxx(I)} / {Gxy / Gxx(R)}] is a comparison of an actual waveform (the combined autopower spectra of each lead) to an ideal waveform (the cross-power spectrum of the two leads). This is expressed as the angle in degrees of the phase shift for each frequency: essentially, the relative angles of the harmonics at a specific frequency to each other. The angle represents the delay between the two leads, so that a greater angle is evidence of higher degrees of asynchronization; positive angles indicate angle shift favoring the input lead (V5), and negative angles indicate angle shift favoring the output lead (II). Asynchrony between the leads may be due to infarction, myocardial ischemia, and myocardial hypertrophies.
Impulse Response
The impulse response function Pih = F-1Txy measures the continuous activation and response of the cardiac system between input (lead V5) and output (Lead II). It is derived from the transfer function using a reverse DFT and is expressed in the time domain as the latency for each amplitude peak in millivolts. The impulse response function uses the V5 lead as system input and lead II as system output; this makes the impulse response function as an idealized system, which generates Lead II from Lead V5 in response to a unit impulse. Changes in myocardial compliance correlate with changes in impulse response. Increased compliance as represented in the impulse-response graph can be associated with ventricular dilatation and overall system quality, i.e., better signal-to-noise ratio. Decreased compliance may indicate left ventricular hypertrophy or damage due to ischemia or infarction.
Coherence Function
The coherence function γ2 = (Gxy)2/{(Gxx)(Gyy)} generates a unitless number that reflects the net disparity between the cross-power spectrum and the product of the two power spectra of leads II and V5. It represents the correspondence of the amplitude, frequency, and phase shift of the two ECG leads. Coherence is expressed as the amplitude ratio of the two leads squared for each frequency; the result is a measure of the correspondence of the output energy of the two leads. The coherence function is primarily useful in the frequency band of the heart harmonics because higher frequencies show little variation in amplitude ratio. The distortion of the myocardial coherence function away from a predefined threshold is reflected here. This is a universal threshold of degree of coherence for the autopower spectra and the cross-power spectrum of both ECG leads at the system's fundamental frequency. A value of 1 would indicate a theoretically perfect spherical order (where the products of auto- and cross-power spectra from both leads are equal), whereas a value of 0 is undefined and clinically represents chaotic ventricular interaction.
Cross-Correlation
Cross-correlation Vxy = F-1Gxy is the reciprocal of the cross-power spectrum. It provides the linear relation between the R waves of the ECG signals, expressed as the measure of amplitude in millivolts over time. Only the shared qualities of both leads are studied here. The commonalties of both leads are compared during one 5.12-second cycle, and this inversion is reflected in the cross-correlation graph.
Final Diagnostic Output
Each of these transformations generates numerous indexes that can be related to certain pathological changes in the myocardium. Whereas each transformation or single index by itself does not have sufficient diagnostic significance to allow a conclusive diagnosis, the combination of these six transformations and the resulting 166 indexes does. To reach the final diagnosis, the index patterns of the individual subject or patient are compared to the patterns stored in a database of healthy subjects and patients with confirmed, detailed diagnoses. The end result is a confirmed and verified diagnostic report that is typically transmitted back to the remote ECG site within 2 minutes after reception of the ECG data.
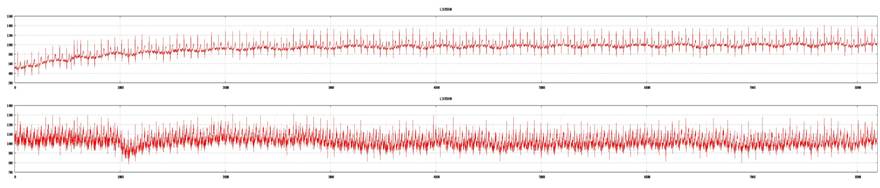
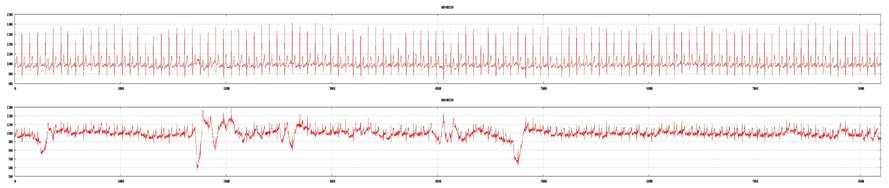
Appendix II – Grading of Tracing Quality
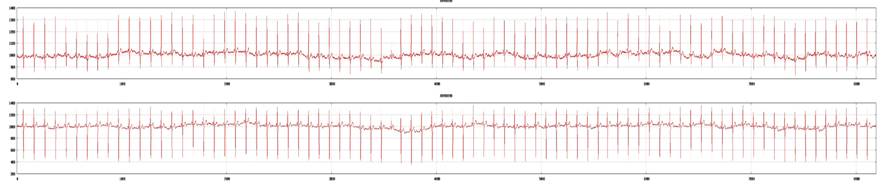
Examples of good tracings from both ECG leads (top: lead V5; bottom: lead II). ECG recording is acceptable for 3DMP analysis.
Examples of marginal tracings from both leads (top: lead V5; bottom: lead II). ECG recording is acceptable for 3DMP analysis.
Examples of a poor tracing from lead II and a good tracing from lead V5 (top: lead V5; bottom: lead II). ECG recording is not acceptable for 3DMP analysis and will be rejected.
Author contact
![]() Correspondence to: Michael Imhoff, MD, PhD, Am Pastorenwäldchen 2, D-44229 Dortmund, Germany. Phone: +49-231-973022-0; Fax: +49-231-973022-31; e-mail: mikede
Correspondence to: Michael Imhoff, MD, PhD, Am Pastorenwäldchen 2, D-44229 Dortmund, Germany. Phone: +49-231-973022-0; Fax: +49-231-973022-31; e-mail: mikede
Footnotes
Presented at the 11th International Congress on Acoustics: Paris July 19-27, 1983: “Effect of Noise on EKG (with Computer Analysis)”