Impact Factor ISSN: 1449-1907

 Global reach, higher impact
Int J Med Sci 2007; 4(1):36-44. doi:10.7150/ijms.4.36 This issue Cite
Research Paper
Proteomic analysis of mechanisms of hypoxia-induced apoptosis in trophoblastic cells
Shin-ichi Ishioka, Yoshiaki Ezaka, Kota Umemura, Takuhiro Hayashi, Toshiaki Endo, Tsuyoshi Saito ![]()
Department of Obstetrics and Gynecology, Sapporo Medical University, School of Medicine, Sapporo, Japan
Received 2006-9-13; Accepted 2006-12-26; Published 2006-12-29
Abstract
Preeclampsia is often accompanied by hypoxia of the placenta and this condition induces apoptosis in trophoblastic cells. The aim of this study was to characterize global changes of apoptosis-related proteins induced by hypoxia in trophoblastic cells so as to clarify the mechanism of hypoxia-induced apoptosis by using the PoweBlot, an antibody-based Western array. Human choriocarcinoma cell line JAR was cultured for 24 hours under aerobic and hypoxic conditions. Hypoxia induced apoptosis accompanied by increased expression of Bcl-x, Caspase-3 and -9, Hsp70, PTEN, and Bag-1. Bad, pan-JNK/SAPK-1, Bcl-2, Bid, and Caspase-8 showed decreased expression. Hypoxia-induced apoptosis was increased with the transfection of a bag-1 antisense oligonucleotide. The bag-1 antisense oligonucleotide affected the expression of Bid, Bad, Bcl-2, JNK, and phosphorylated JNK, although expression of PTEN and Bcl-X did not change. Bag-1 may inhibit apoptosis by suppressing the expression of Bid and Bad. It may also enhance apoptosis by inhibiting the expression of Bcl-2 and by modulating phosphorylation of JNK. Both mitochondrial and stress-activated apoptosis pathways played important roles in the hypoxia induced cell death of trophoblastic cells. These findings will contribute to establish new approach to detect hypoxic stress of the placenta, which leads to preeclampsia and other hypoxia-related obstetrics complications.
Keywords: Hypoxia, apoptosis, trophoblast, preeclampsia
1. Introduction
Hypoxia of the placenta is a cause of various complications of pregnancy. Clinical conditions such as preeclampsia, anemia, and smoking can be accompanied by villous hypoxia, characterized by diminished syncytial differentiation, syncytial knots, and prominent cytotrophoblasts [1]. Hypoxia is known to induce apoptosis in various cells, including trophoblastic cells [2-4]. A higher degree of apoptosis is found in placentas from pregnancies complicated by intrauterine fetal growth retardation (IUGR) [5]. Similarly, apoptosis is more prevalent in cytotrophoblasts from pregnancies complicated by preeclampsia compared with similar specimens obtained from uncomplicated pregnancies [6]. Thus, apoptosis plays an important role in the development of various obstetrical complications.
Apoptosis is a cascade of events that involves activation of many genes and synthesis of various proteins. The importance of several apoptotic pathways such as mitochondrial pathways and death receptor pathways has been reported [7,8]. However, apoptosis is a very complex process, and only a single pathway cannot explain the whole apoptotic network. The balance of the expression of positive and negative regulators of apoptosis determines the apoptotic propensity. Therefore, to understand the complicated network of apoptotic pathways, detection of many genes as well as proteins is important. The cDNA microarray technique is one of the most powerful tools to elucidate the mechanism of this network. However, a poor correlation between mRNA and protein abundance has also been reported [9]. Furthermore, a single gene can encode for more than one mRNA species through differential splicing, and proteins can undergo as many as 200 posttranslational modifications. Therefore, to understand the complicated network of hypoxia-induced apoptotic pathways, global detection of various proteins is essential. Recent advances in molecular biology and biochemistry have enabled analysis of the expression profiles of numerous proteins at once.
In this study, we looked at hypoxia-induced apoptosis and, by using the Western array technique, we monitored the expression of almost 40 apoptosis-related proteins after hypoxia in the choriocarcinoma cell line JAR. Because of the limited availability of first, second, and early third trimester placental tissues, the choriocarcinoma cell line JAR was used instead. Furthermore, we also evaluated the changes of expression of apoptosis-related genes by using the RT-PCR and real-time RT-PCR techniques.
Early prediction of preeclampsia is difficult. Several maternal serum proteins such as PAPP-A, free β-HCG, placental growth factor, vascular endothelial growth factor and soluble fms-like tyrosine kinase-1 are reported to be useful markers for the prediction of preeclampsia. However, it is still difficult to predict the occurrence of hypoxia-related complications precisely [10,11].
The aim of this study was to characterize global changes in the proteins related to apoptosis during hypoxia to clarify the mechanism of hypoxia-induced apoptosis, and to find out useful hypoxia-related markers of trophoblastic cells.
2. Materials and methods
Cell line and cell cultures
The human choricarcinoma cell line JAR was obtained from American Type Culture Collection (Manassas, VA, USA). Cells were maintained in RPMI 1640 medium supplemented with 20mM HEPES, 6 mM glutamine, 100 IU of penicillin, 100 μg of streptomycin, and 15% fetal calf serum in 25 cm2 or 75 cm2 flasks at 37ºC.
Hypoxia treatment
When JAR cells had reached 70-80% confluence, they were grown under aerobic or hypoxic conditions for 24 hours. The anaerobic chamber provided a hypoxic atmosphere, defined as 2% oxygen (5% CO2 and 93% N2) that yielded a PO2 of < 15 mmHg. Standard aerobia was defined as 5% CO2 and 95% air (i.e., 20% oxygen).
Antisense oligonucleotide treatment
FITC-labeled morpholino oligomers were synthesized at Gene Tools, LLC (Philomath, OR, USA) as described previously. Purity was >95% as determined by reverse-phase HPLC and matrix-assisted laser desorption ionization time-of-flight mass spectroscopy. The base composition of the oligomer was as follows. The sequence of the Bag-1 morpholino antisense oligomer (hereafter designated Bag-1 Morpho/AS) was 5'- GCTGAGCCAGGCCCGCACTTGTTGA-3'. Morpholino oligomer 5'-CCTCTTACCTCAgTTACAATTTATA-3' was used for the negative control.
JAR cells were seeded on 25 cm2 flasks and after 48 hours, when they had reached 70-80% confluence, the cells were transfected with Bag-1 Morpho/AS in serum-free conditions using a weakly basic delivery reagent, ethoxylated polyethylenimine (EPEI), as instructed by Gene Tools. Thus, 3.7 μl of Bag-1 Morpho/AS stock solution (0.5 mM) and 3.7 μl of EPEI delivery reagent (200 μM) were mixed in sterile Milli Q water (125.9 μl) in a small tube. After immediate mixing with a vortex mixer and reaction at room temperature for 20 minutes, 1.2 ml of serum-free medium (RPMI 1640 medium) was added, and mixed immediately to generate the complete delivery solution as instructed by Gene Tools. One milliliter of the Bag-1 Morpho/AS/EPEI complex was added to each flask and incubated at 37ºC for 3 hours. After transfection, the medium with transfection complex was removed, complete medium (1 ml) with 10% FBS was added, and incubation was continued. After 16 hours of incubation, the cell pellets were collected for analysis. The intracellular location of the Bag-1 Morpho/AS was confirmed by fluorescent microscopy.
Cell viability assay
Cell viability assays were performed after 12 and 24 hours of exposure of the cells to hypoxic or aerobic conditions. Briefly, cells were seeded on 6-well plates, and after 12- and 24-hour exposures to hypoxic or aerobic conditions, 200μl of 5mg/ml MTT (Sigma Chemical Co. St. Louis, MO, USA) was added to each well in a 6-well plate at 37ºC until blue coloration started to appear in the cells. The medium was then aspirated and replaced with DMSO. The absorbance was read at 540nm in a microtiter plate reader.
Quantitation of internucleosomal DNA fragmentation by ELISA
Internucleosomal DNA fragmentation as a result of apoptosis was measured with a Cell Death Detection ELISA (Boehringer Mannheim, Indianapolis, Ind. USA). Cells (1×10⁴/well) were plated in 24-well plates. After exposure to hypoxia for 12-24 hours, the cells were collected by trypsinization, and the supernatant of the cell lysate was assessed for DNA fragmentation according to the manufacturer's protocol. The same procedures were also used under aerobic conditions for the cell line. From the absorbance at 405 nm, the percent fragmentation in comparison with that in controls was calculated according to the formula: DNA fragmentation (-fold of control) = absorbance of drug-treated cells/absorbance of control cells.
Becton Dickinson PowerBlot
In this study, we analyzed forty proteins by using the PowerBlot (BD Bioscience Pharmingen, San Diego, CA, USA) system. We selected 40 apoptosis-related proteins to examine the mechanism of hypoxia-induced apoptosis. After the JAR cells were exposed to hypoxia or maintained under aerobic conditions, protein extracts were analyzed as follows. First, 13×10 cm, 4-15% gradient SDS-polyacrylamide gels were used to separate the proteins, and 200 μg of protein was loaded on the gel (10 μg/lane). The gels were run for 1.5 hours at 150 volts and then transferred to Immobilon-P membranes for 2 hours at 200 mAmp. The membranes were clamped with Western blotting manifolds capable of isolating 42 channels across the membrane. In each channel, a complex antibody mixture was added and allowed to hybridize for 1 hour at 37ºC. The blots were then removed from the manifold, washed, and hybridized for 30 minutes at 37ºC with the secondary goat anti-mouse antibody conjugated to Alexa 680 fluorescent dye. The membrane was washed, dried, and scanned at 700 nm using the Odyssey Infrared Imaging System. Results were expressed as fold change, a semi-quantitative value that represented the general trend of protein changes, either increasing or decreasing, for the experimental sample relative to the control. Changes were classified in the order of confidence, level 3 having the highest confidence. Confidence levels were defined as: Level 3 – Changes greater than 2-fold from good quality signals that also passed a visual inspection; Level 2 – Changes greater than 2-fold from good quality signals that did not pass a visual inspection; Level 1 – Changes greater than 2-fold from low quality signals; Level 0 – No significant protein changes.
Forty apoptosis related proteins studied in this study are as follows: Akt (pS473), phospho-specific, Apaf-1, Bad, BAG-1, basic FGF, Bax,Bcl-2, Bcl-x, Bid, BRCA1, caspase-3, caspase-6, caspase-7, caspase-8, cox-2, cyclinD2, EGF receptor, EGF receptor (activated form), eNOS phosphor-specific, FADD, Fas/CD95/APO-1, GST-p, Hsp70, Hsp90, HspBP1, JNK (pT183/pY185) Phospho-Specific, JNK1, Ki67, JNK (pT183/pY185) phospho-specific, Nm23, PAI-1, pan-JNK/SAPK1, PARP, PCNA, PTEN, Rb, Smac/DIABLO, TRADD, XRCC4.
Quantitation of phosphorylated JNK 1&2 by ELISA
The phosphorylated JNK 1&2 protein level was measured with Phospho-JNK1&2 (pThr183/pTyr185) ELISA (SIGMA, Saint Louis, USA). After 12 hours and 24 hours of exposure to hypoxia or normoxia, cells (1×10⁶ cells/flask) were collected by trypsinisation. Cell lysates of hypoxia-treated cells and untreated control cells were assayed for phosphorylated JNK 1&2 protein according to the manufacturer's protocol. Briefly, cell lysates diluted >1:10 were incubated in 96-well plates coated with an anti-JNK 1&2 antibody for 2 hours. Then an anti-phospho-JNK 1&2 (pThr183/pTyr185) rabbit antibody was added, and incubated for 1 hour. After washing the wells, an anti-rabbit IgG-HRP antibody was added, and incubated for 30 minutes. Stabilized Chromogen (TMB) was added to each well, and from the absorbance at 450 nm, the phosphorylated JNK 1&2 protein level in comparison with the control was calculated according to the formula: Changes in the level of phosphorylated JNK1&2 (-fold of control) = absorbance of hypoxia-treated cells/absorbance of control cells.
RT-PCR analysis
Total RNA was extracted from JAR cells using RNeasy mini kits (QIAGEN, Mississauga, Canada). Two micrograms of total RNA was reverse transcribed, and then PCR was performed using Ready-to-Go RT-PCR Beads (GE Healthcare Bio-Sciences, Piscataway, NJ, USA ), according to the manufacturer's protocol in a TAKARA amplification cycler. The sequences of the human primers used were as follows: Bag-1: sense, 5'-GGA GGA TGA GTG ACG AGT TTG TG-3', antisense, 5'-TGG TGG GAT CGG AAC TTG GG-3'. Bad: sense, 5'-GAG GAT GAG TGA CGA GTT TGT G-3', antisense, 5'-TGG TGG GAT CGG AAC TTG GG-3'. JNK 1: sense, 5'-AGA ACC AAG AAT GGA GTT ATA CGG-3', antisense, 5'-GTC TTC AAT GTC AAC AGA TCC GA-3'. Hsp-70: sense, 5'-GCC TTC TGC CGT GAT TGT GAG-3', antisense, 5'-GGC AAG GTG GAG ATC ATC GC-3'. PTEN: sense, 5'-CCA ATG TTC AGT GGC GGA ACT-3; antisense, 5'-GAA CTT GTC TTC CCG TCG TGTG-3'. GAPDH: sense, 5'-CAT GGA GAA GGC TGG GGC TC-3', antisense, 5'-CAC TGA CAC GTT GGC AGT GG-3'. The conditions used for the PCR were as follows: 94ºC for 2 min, 30 cycles of 94ºC for 45 sec, 68ºC for 45 sec, and 74ºC for 1 min, with final extension at 74ºC for 3 min. The integrity of the RNA used for RT-PCR was confirmed using GAPDH synthesis as a positive control reaction as described previously. The amplified RT-PCR products were analyzed electrophoretically through 2% agarose gels, visualized by ethidium bromide staining, and photographed under UV illumination.
Semiquantitative real-time RT-PCR
Total RNA was extracted from JAR cells using RNeasy mini kits (QIAGEN, Valencia CA, USA). Real-time semiquantitative RT-PCR was performed using an ABI 7500 RealTime PCR System (Perkin-Elmer, Applied Biosystems, Foster City, CA, USA). Total RNA was reverse transcribed to cDNA, using a QuantiTect Reverse Transcription kit (QIAGEN, Valencia CA, USA), according to the manufacturer's protocol. Briefly, template RNA, gDNA wipeout buffer, and RNase-free water were incubated at 42ºC for 2 minutes. Then Quantiscript reverse transcriptase, quantiscript RT buffer, and a commercially available RT primer mix were added and incubated at 42ºC for 15 minutes, followed by incubation at 95ºC for 3 minutes to inactivate Quantiscript reverse transcriptase. An aliquot of each finished reverse transcription reaction was added to the real-time PCR mix. A probe for GAPDH was used for normalization. The following quantification cycling protocol was used: 50ºC for 2 minutes, followed by 95ºC for 15 minutes, and 45 cycles of 76ºC for 30 seconds, 94ºC for 15 seconds, and 56ºC for 35 seconds. JNK, PTEN, and caspase-3 mRNA quantities were analyzed in triplicate, normalized against GAPDH as a control gene and expressed in relation to a calibrator sample.
Statistical analysis
Experiments for the detection of cell viability, those for the quantitation of internucleosomal DNA fragmentation, and JNK 1&2 were carried out in duplicate and repeated three times. Differences between the groups were evaluated with Mann-Whitney U-test. Experiments of the PowerBlot protein array were carried out twice, and the real-time RT-PCR was carried out three times, and results were expressed as mean +/- SD.
3. Results
Cellular uptake and distribution of Bag-1 Morpho/AS
The cellular uptake and distribution of FITC-labeled Bag-1 Morpho/AS was examined using a fluorescent microscope. Fluorescence was mainly observed in cytosol areas in transfected cells. FITC-labeled Bag-1 Morpho/AS was transfected into almost all JAR cells by EPEI-mediated transfection (data not shown).
Hypoxia-induced apoptosis in the JAR cell line, and Bag-1 Morpho/AS enhanced apoptosis of the cell line
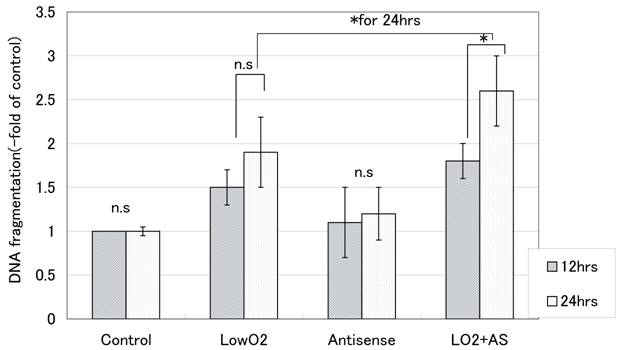
With hypoxic treatment for 24 hours, internucleosomal DNA fragmentation increased in a time-dependent manner for JAR cells. In cells transfected with Bag-1 Morpho/AS, significantly more internucleosomal DNA fragmentation was detected than in non-treated control JAR cells after hypoxia treatment, also in a time-dependent manner (Fig. 1).
Internucleosomal DNA fragmentation with hypoxia (-fold of control). Internucleosomal DNA fragmentation was measured with a Cell Death Detection ELISA after 12 hours and 24 hours exposure to hypoxia. From the absorbance at 405nm, the percent fragmentation in comparison that in controls was calculated according to the formula: DNA fragmentation(-fold of control) = absorbance of treated cells / absorbance of control cells. All points were done duplicate X three times, and the results are average +/- SD. “* “means p<0.05, and “n.s”: means statistically not significant.
Altered expression of apoptosis-related proteins by hypoxia in the JAR cell line demonstrated using the PowerBlot Western array
We used a proteomic method to identify hypoxia-regulated proteins. The PowerBlot is an antibody-based Western array that can rapidly analyze the expression levels of many proteins at once. We selected 40 apoptosis-related proteins and determined that 22 of those proteins were significantly increased or decreased after hypoxia treatment. A summary of the PowerBlot expression data of proteins detected is listed in Table 1. Briefly, Bcl-x-28kD, caspase-3, caspase-7, Hsp70-64kD, PTEN, and JNK phosphor-specific showed 2.39-fold, 4.96-fold, 2.16-fold, 1.85-fold, 1.92-fold, and 2.29-fold increases of protein expression, respectively. Bag-1-29kD was only expressed after hypoxia treatment. On the other hand, Bad, pan-JNK/SAPK1-50kD, pan-JNK/SAPK-1-43kD, Bcl-2, Bid-21kD, and caspase-8 showed 1.92-fold, 2.21-fold, 2.17-fold, 1.91-fold, 9.40-fold, and 2.76-fold decreases of protein expression, respectively.
Altered protein expression of JAR cells induced by hypoxia in the apoptosis pathways using PowerBlot.
| Protein | Confidence level | (-) Under (+)Over | Fold change | Protein | Confidence level | (-) Under (+)Over | Fold change |
|---|---|---|---|---|---|---|---|
| Bad | 3 | - | 1.92 | Bid | 1 | - | 9.40 |
| Bcl-x | 3 | + | 2.39 | Caspase-6 | 1 | + | 0/+ |
| Caspase-3 | 3 | + | 4.96 | Caspase-8 | 1 | - | 2.76 |
| Caspase-7 | 3 | + | 2.16 | Hsp90 | 1 | - | 2.32 |
| Hsp70-64kD | 3 | + | 1.85 | Bax | 0 | 1.25 | |
| Pan-JNK/SAPK1-50kD | 3 | - | 2.21 | FADD | 0 | 1.15 | |
| PTEN | 3 | + | 1.92 | ||||
| JNK-phospho-specific | 2 | + | 2.29 | ||||
| Pan-JNK/SAPK1-43kD | 2 | - | 2.17 | ||||
| BAG-1 | 1 | + | 0/+ | ||||
| Bcl-2 | 1 | - | 1.91 |
Fold change means a semiquantitative value that represents the general trend of protein changes for the experimental sample to control detected by using the Odyssey Infrared Imaging System. (+) means an increase of signal intensity, and (-) means a decrease of signal intensity after exposure to hypoxia.
Confidence levels are defined as: Level 3 – Changes greater than 2 fold from good quality signals that also pass a visual inspection. Level 2 - Changes greater than 2 fold from good quality signals that do not pass a visual inspection. Level 1 – Changes greater than 2 fold from low quality signals. Level 0 – No significant protein changes.
Fold changes: a semiquantitative value that represents the general trend of protein changes for experimental sample relative to control. 0/+ means no expression in control and the expression after treatment.
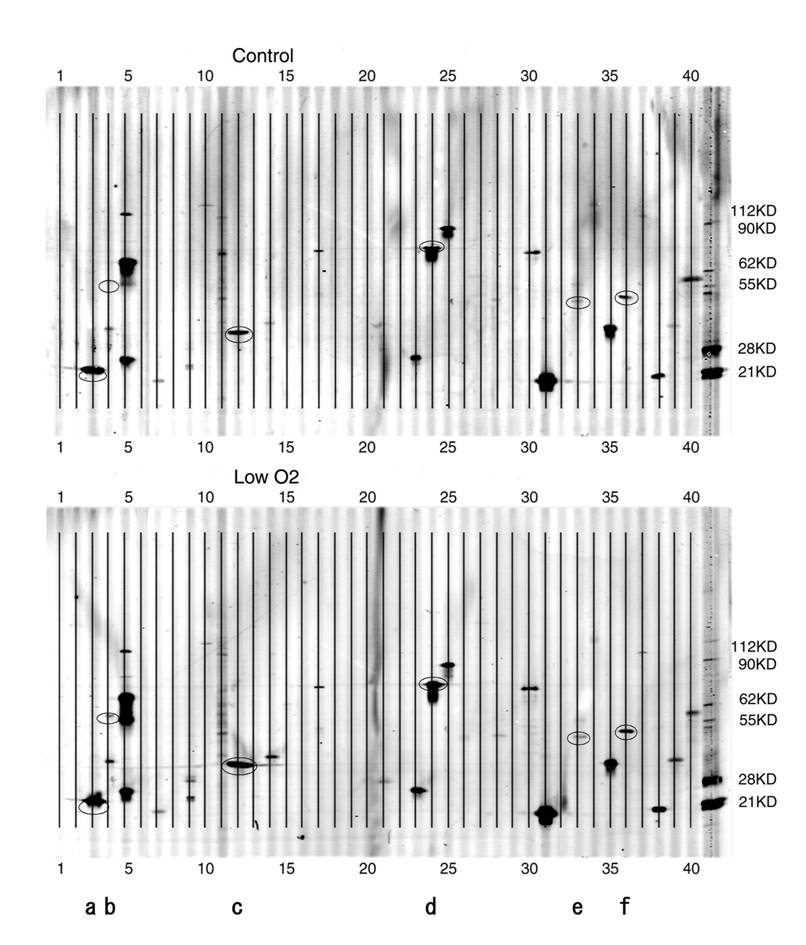
Both decreases and increases in the expression of proapoptotic and antiapoptotic proteins were detected. PowerBlot analysis showed altered expression of many proteins involved in apoptosis, including the expression profiles of proteins involved in the mitochondrial (bcl-2, bax, and bcl-x, etc.) and stress reaction-related pathways of apoptosis (Fig. 2).
PowerBlot patterns of JAR cells. Forty elements of various apoptosis-related proteins were spotted onto the membrane. A. Control( exposed to aerobic condition). B. Low O2( exposed to hypoxic condition for 24 hours). After the hypoxia treatment, cell extracts were analyzed with the PowerBlot western array. 40 apoptosis-related proteins described in Table 1 were examined. The membrane was scanned at 700 nm using the Odyssey Infrared Imaging System. *a-f in the Figure are as follows; a:Bad, b:Bag-1, c:caspase-3, d:Hsp70, e:JNK/SAPK, f:PTEN.
Altered expression after hypoxia treatment in JAR cell line transfected with Bag-1 Morpho/AS of apoptosis-related proteins using PowerBlot Western array
A summary of the PowerBlot-detected expression data of proteins is given in Table 2. Briefly, caspase-3, GST-p, Hsp70-64kD, Bcl-x-22kD, PTEN, and caspase-7 showed 3.75-fold, 3.31-fold, 2.66-fold, 2.32-fold, 1.91-fold, and 1.86-fold increases of protein expression, respectively. On the other hand, smac/DIABLO, Bag-1, and JNK phosphor-specific showed 3.55-fold, 3.53-fold, and 2.06-fold decreases of protein expression, respectively. Interestingly, Bad, pan-JNK/SAPK1-50kD, pan-JNK/SAPK-1-43kD, Bcl-2, and Bid-21kD did not show decreased protein levels after hypoxia treatment with the transfection of Bag-1 Morpho/AS, although the expression of PTEN and Bcl-X was not changed. Thus Bag-1 showed inhibitory effects on the proapoptotic proteins Bid and Bad. Bag-1 also exhibited apoptotic effects, probably by inhibiting the expression of Bcl-2 and by modulating phosphorylation of JNK.
Altered protein expression of JAR cell with anti-Bag-1 antisense oligo nucleotide induced by hypoxia in the apoptosis pathways using PowerBlot.
| Protein | Confidence level | (-) Under (+) Over | Fold change | Protein | Confidence level | (-) Under (+)Over | Fold change |
|---|---|---|---|---|---|---|---|
| Bcl-x | 3 | + | 2.32 | Ki-67 | 1 | + | 0/+ |
| Caspase-3 | 3 | + | 3.75 | Bad | 0 | 1.08 | |
| Caspase-7 | 3 | + | 1.86 | Bid | 0 | 1.19 | |
| GST-p | 3 | + | 3.31 | Apaf-1 | 0 | 1.23 | |
| PTEN | 3 | + | 1.91 | Bcl-2 | 0 | 1.01 | |
| Smac/DIABLO | 3 | - | 3.55 | Pan-JNK/SAPK1-43kD | 0 | 1.07 | |
| Hsp70-64kD | 2 | + | 2.66 | TRADD | 0 | 1.22 | |
| Caspase-6 | 1 | + | 0/+ | Bag-1 | No exp. | ||
| JNK-phospho-specific | 1 | - | 2.06 |
Fold change means a semiquantitative value that represents the general trend of protein changes for the experimental sample to control detected by using the Odyssey Infrared Imaging System. (+) means an increase of signal intensity, and (-) means a decrease of signal intensity after exposure to hypoxia.
Confidence levels are defined as: Level 3 – Changes greater than 2 fold from good quality signals that also pass a visual inspection. Level 2 - Changes greater than 2 fold from good quality signals that do not pass a visual inspection. Level 1 – Changes greater than 2 fold from low quality signals. Level 0 – No significant protein changes.
Fold changes: a semiquantitative value that represents the general trend of protein changes for experimental sample relative to control. 0/+ means no expression in control and the expression after treatment.
No exp. means no expression both in control and after treatment.
Changes in the level of phosphorylated JNK 1&2 protein
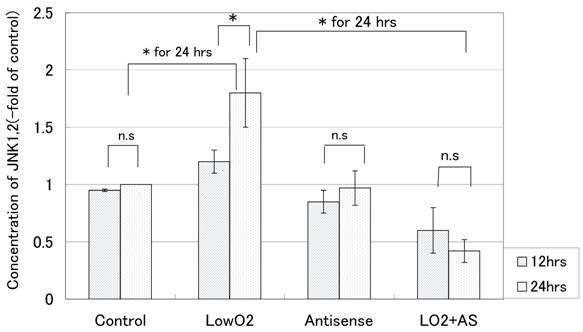
We also quantitated changes in the protein level of phosphorylated JNK 1&2 over 24 hors for the cell line. According to the PowerBlot data, increased expression of phosphorylated JNKs in JAR cells was detected after exposure to hypoxia. On the other hand, JAR cells transfected with Bag-1 Morpho/AS did not show such an increase in the expression of phosphorylated JNKs. As shown in Fig. 3, 12hr exposure to hypoxia caused almost no increase in the phosphorylated JNKs protein level in the cell line. Twenty-four-hour exposure to hypoxia resulted in a marked increase (1.8-fold of control) in the level of phosphorylated JNK 1&2, whereas 24hr exposure to hypoxia resulted in a decrease (0.4-fold of the control) in the level of phosphorylated JNK 1&2 for JAR cells with Bag-1 Morpho/AS.
Phosphorilated JNK1&2 protein levels (-fold of control) of JAR over 24 hours of exposure to hypoxia. The phosphorylated JNK 1&2 protein level was measured with Phospho-JNK1&2(pThr183/pTyr185) ELISA after 12 hours and 24 hours exposure to hypoxia. From the absorbance at 450nm, the phosphorylated JNK 1&2 protein level in comparison with the control was calculated according to the formula: Changes in the level of phosphorylated JNK 1&2 (-fold of control) = absorbance of treated cells / absorbance of control cells. All points were done duplicate X three times, and the results are average +/- SD. “* “means p<0.05, and “n.s”: means statistically not significant.
RT-PCR and real-time RT-PCR
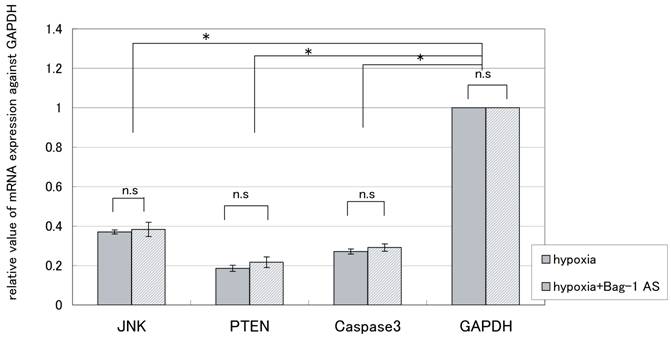
To confirm the changes observed using the PowerBlot, we measured the expression of several representative genes by RT-PCR and real-time RT-PCR. As shown in Tables 3, 4 and Fig.4, downregulation of three representative genes was detected after 24hr exposure to hypoxia. On the other hand, the protein expression of caspase 3, PTEN, and JNK1 in JAR cells exhibited a 4.96-fold increase, 1.92-fold increase, and 2.17-fold decrease, respectively. For JAR cells transfected with Bag-1 Morpho/AS, they exhibited a 3.75-fold increase, 1.91-fold increase, and 1.07-fold increase, respectively. Thus discrepancies between mRNA expression and the PowerBlot results were detected. Furthermore, as shown in Table 4, such expression discrepancies between mRNA and the protein were detected for several other genes.
Slope of standard curve and correlation coefficient of representative genes by Semiquantitative RT-PCR after 24 hours exposure to hypoxia.
| Gene | Slope | Correlation coefficient |
|---|---|---|
| JNK1 | -3.24 | 0.989 |
| PTEN | -3.59 | 0.993 |
| Caspase 3 | -3.25 | 0.996 |
| GAPDH | -3.53 | 0.999 |
mRNA was obtained after 24 hours exposure to hypoxia for JAR cells and JAR cells with Bag-1 Morpho/AS. Real-time semiquantitative RT-PCR was performed using an ABI 7500 RealTime PCR System. Then standard curves were obtained, and the slope and correlation coefficient were calculated for each gene.
Expression of three representative genes by Semiquantitative RT-PCR after 24 hours exposure to hypoxia. mRNA was obtained after 24 hours exposure to hypoxia for JAR cells and JAR cells with Bag-1 Morpho/AS. Real-time semiquantitative RT-PCR was performed using an ABI 7500 RealTime PCR System. JNK, PTEN, and caspase3 mRNA quantities were analyzed in triplicate, normalized against GAPDH as a control gene. The results are average +/- SD. “* “means p<0.05, and “n.s”: means statistically not significant.
Comparison between mRNA and protein expression of representative genes and proteins after hypoxia treatment for 24 hours.
| JAR | JAR+Bag-1 Morpho/AS | |||
|---|---|---|---|---|
| Name of gene | Protein expression | mRNA expression | Protein expression | mRNA expression |
| JNK | ↑ | + | ↓ | + |
| PTEN | ↑ | + | ↑ | + |
| Caspase3 | ↑ | + | ↑ | + |
| Bag-1 | ↑ | + | - | - |
| Hsp-70 | ↑ | - | ↑ | - |
| Bad | ↓ | + | ↑ | + |
Protein expression: ↑ means increased expression of protein. ↓ means decreased expression of protein. → means no changes of protein expression. - means negative expression
mRNA expression: (+) means positive, and ( -) means negative expression by RT-PCR.
4. Discussion
Apoptosis is a cascade of events that involves activation of many genes and synthesis of numerous proteins. Upon exposure to hypoxia, an increase in internucleosomal DNA fragmentation as a result of apoptosis was noted in JAR cells. The internucleosomal DNA fragmentation induced by hypoxia was increased with the transfection of Bag-1 Morpho/AS, which suggested that Bag-1 was related to the inhibition of apoptosis of trophoblastic cells under hypoxic conditions. By using the PowerBlot Western array technique, we detected global changes in the proteins related to apoptosis induced by hypoxia. There are two major intracellular apoptosis-signaling cascades; mitochondrial pathways and death receptor pathways [4]. Mitochondrial pathways are regulated by various proapototic and antiapoptotic proteins, which either induce or prevent the permeabilization of the outer mitochondrial membrane. The stress-activated pathway, which leads to activation of caspase 3 and/or caspase 9, is also thought to be involved. On the other hand, death receptor pathways are regulated by signals from death receptors that exist on the cell surface membrane. Fas-induced apoptosis and/or the tumor necrosis factor (TNF)-related pathway, which lead to the activation of caspase 8, are thought to be involved in this pathway.
Indeed, apoptosis is more prevalent in trophoblasts from pregnancies complicated by preeclampsia and IUGR, compared with similar specimens obtained from uncomplicated pregnancies. And it is reported that the elevated apoptosis of trophoblasts observed in such complications might be due, in part, to placental oxidative stress, which can be triggered by hypoxia [12]. Thus hypoxia of trophoblasts can be a cause of preeclampsia and IUGR. The mechanism by which hypoxia mediates the proapoptotic effect is thought to involve the mitochondrial pathway. Levy et al. demonstrated that hypoxia enhanced apoptosis in term trophoblasts by decreasing the expression of Bcl-2 while increasing the expression of p53 and Bax and activating caspases [13]. In addition, DiFederico et al. reported that the apoptotic extravillous cytotrophoblasts detected in preeclamptic samples were negative for Bcl-2 expression, suggesting that a decrease in Bcl-2 expression might induce apoptosis in extravillous trophoblast cells [14]. However, most of those reports only looked at certain apoptotic pathways.
In this study, we have elucidated the importance of several hypoxia-induced apoptosis pathways using a PowerBlot Western array. Increased expression of proapoptotic proteins, such as caspase-3, caspase-7, PTEN, and JNK phosphor-specific-54-kD, and decreased expression of antiapoptotic protein Bcl-2, which would contribute to the induction of apoptosis, were detected. Furthermore, increased expression of antiapoptotic proteins such as Bag-1, Hsp70, and Bcl-X, and decreased expression of proapoptotic proteins such as Bid and Bad, which both would contribute to the prevention of apoptosis, were also detected. However, the contribution of death receptor pathways seemed to be low for the hypoxia-induced apoptosis in this study, although several reports have demonstrated the importance of Fas and FasL [15], and that of TNF-R1 and TNF-α[16], in preeclampsia.
Thus, hypoxia-induced changes in the expression of both proapoptotic and antiapoptotic proteins, and the balance of the expression of such positive and negative regulators of apoptosis would determine apoptotic propensity. In this study, we focused on the role of Bag-1 in the regulation of trophoblastic cells to induce apoptosis under hypoxia. Growth of trophoblast tissue in early pregnancy is rapid and accomplished in an unusually hypoxic environment. However, apoptosis is considered to be suppressed even under those hypoxic conditions. As we mentioned above, antiapoptotic Bcl-2 is reported to be overexpressed in cytotrophoblasts, and a decrease in the expression of Bcl-2 and increase of apoptotic cells are seen in preeclampsia. Thus antiapoptotic proteins can play an important role in preventing apoptosis of trophoblasts, which leads to various hypoxia-induced obstetrics complications. In this study, we detected an increase in the expression of another antiapoptotic protein, Bag-1, although the expression of Bcl-2 protein was decreased.
Bag-1 is a multifunctional protein containing a domain that binds tightly to heat shock 70-kD (Hsp70) family molecular chaperones and appears to modulate stress responses [17]. It is reported to be associated with enhanced cell proliferation and survival, and eventually suppresses apoptosis [18].
In this study, internucleosomal DNA fragmentation induced by hypoxia was increased with the transfection of Bag-1 Morpho/AS, which also affected the expression of Bid, Bad, Bcl-2, JNK, and phosphorylated JNK, although the expression of PTEN and Bcl-X was not changed. PTEN (phosphatase and tensin homolog deleted on chromosome 10) is a tumor suppressor gene that regulates cell growth, apoptosis, and proliferation. PTEN is known to negatively regulate Akt activation by preventing its phosphorylation [19]. Overexpression or enhanced activation of PTEN induces apoptosis by blocking Akt activation, leading to increased Bad and caspase-9 activities. In this study, increased expression of PTEN was detected after the exposure to hypoxia. However, transfection of Bag-1 Morpho/AS to JAR cells did not alter the expression of PTEN after the exposure to hypoxia, which would mean that the expression of PTEN, and also that of Bcl-X, was independent of Bag-1. Real-time PCR showed decreased expression of PTEN after 24hr exposure to hypoxia, and transfection of Bag-1 Morpho/AS into JAR cells also resulted in a decrease of PTEN expression after the exposure to hypoxia. The time lag between protein synthesis and gene expression, and posttranslational modification of proteins might be a cause of this discrepancy. Stress-activated hypoxia-induced pathways were also shown to be important. The PowerBlot showed increased expression of phosphorylated c-Jun N-terminal kinase/stress-activated protein kinase (JNK/SAPK) (activated type), and decreased expression of nonphosphorylated JNK/SAPK (inactivated type) after exposure to hypoxia, although the mRNA expression was decreased after exposure to hypoxia for both transfected cells and control cells. Interestingly, the phosphorylation of JNK/SAPK was inhibited by the transfection of Bag-1 Morpho/AS. This phenomenon was also confirmed by quantitive ELISA of phosphorylated JNKs. JNKs are known to activate downstream caspases such as caspase-3 and -6. Our study indicates that Bag-1 might control apoptosis not by regulation of the JNK gene, but by modulating phosphorylation of JNKs. Thus, Bag-1 may inhibit apoptosis by suppressing the expression of Bid and Bad. Bag-1 may also enhance apoptosis by inhibiting the expression of Bcl-2 and by modulating phosphorylation of JNK.
In conclusion, various pro- and antiapoptosis-related proteins were expressed in the process of hypoxia-induced apoptosis in the trophoblastic cell line JAR. Mitochondrial pathway-related and stress reaction-induced pathways, as well as PTEN, were revealed to be important in this study. It was also demonstrated that antiapoptotic Bag-1 controlled the expression and function of several apoptosis-related proteins. Therefore, in placentas with hypoxia, Bag-1 might play an important role in the development of hypoxia-related diseases such as preeclampsia.
How can we clinically apply these results? Changes of the expression of various hypoxia-related proteins originated from trophoblastic cells in the clinical samples such as serum or amnionic fluid, might reflect the degree of hypoxic damages of placenta. We are looking at changes of various hypoxia and apoptosis-related proteins detected in this study in clinical samples during pregnancy. We believe that some of those proteins can be a target for the early detection of preeclampsia and IUGR.
Furthermore, we have also demonstrated that the PowerBlot Western array represents a powerful approach to identify key molecules in the course of hypoxia-induced apoptotic pathways. Such analysis of trophoblastic cells will, in the near future, yield insights into the mechanisms of preeclampsia and other hypoxia-related obstetrical diseases and lead to the rational design of more effective strategies to detect hypoxic stress of the placenta and to establish “tailor-made” approaches for patients with such diseases.
Conflict of Interests
The authors declare no conflict of interests.
References
1. Benirschke K, Kaufman P. Pathology of the Human Placenta (3rd ed). New York: Springer-Verlag. 1995
2. Muschel R.J, Bernhard E.J, Garza L, McKenna W.G, Koch C. Induction of apoptosis at different oxygen tensions: evidence that oxygen radicals do not mediate apoptotic signaling. Cancer Res. 1995 ;55:995-998
3. Levy R, Smith S.D, Chandler K, Sadovsky Y, Nelson D.M. Apoptosis in human cultured trophoblast is enhanced by hypoxia and diminished by epidermal growth factor. Am J. Physiol. Cell Physiol. 2000 ;278:982-988
4. Straszewski-Chavez S.L, Abrahams V.M, Mor G. The role of apoptosis in the regulation of trophoblast survival and differentiation during pregnancy. Endocrine Rev. 2005 ;26:877-897
5. Smith S.C, Baker N.P, Symonds E.M. Increased placental apoptosis in intrauterine growth restriction. Am J Obstet Gynecol. 1997 ;177:1395-1401
6. Heikkilä A, Tuomisto T, Häkkinen S.K, Keski-Nisula L, Heinonen S, Ylä-Herttuala S. Tumor suppressor and growth regulatory genes are overexpressed in severe early-onset preeclampsia - an array study on case-specific human preeclamptic placental tissue. Acta Obstetricia et Gynecologica Scandinavica. 2005 ;84:679-689
7. Tsujimoto Y, Shimizu S. Bcl-2 family:life-or-death switch. FEBS Lett. 2000 ;466:6-10
8. Nagata S. Apoptosis by death factor. Cell. 1997 ;88:355-365
9. Yoo G.H, Piechocki M.P, Ensley J.F. et al. Docetaxel Induced Gene Expression Patterns in Head and Neck Squamous Cell Carcinoma Using cDNA Microarray and PowerBlot. Clin Cancer Res. 2002 ;8:3910-3921
10. Spencer K, Yu CKH, Cowans NJ, Otigbah C, Nicolades KH. Prediction of pregnancy complications by first-trimester maternal serum PAPP-A and free β-hCG and with second trimester uterine artery Doppler. Prenatal Diagn. 2005 ;25:949-953
11. Papaqeorqhiou AT, Campbell S. First trimester screening for preeclampsia. Curr Opin Obstet Gynecol. 2006 ;18:594-600
12. Murthi P, Kee M.W, Gude N.M, Brennecke S.P, Kalionis B. Fetal growth restriction is associated with increased apoptosis in the chorionic trophoblast cells of human fetal membranes. Placenta. 2005 ;26:329-38
13. Levy R, Smith S.D, Chandler K, Sadovsky Y, Nelson D.M. Apoptosis in human cultured trophoblasts is enhanced by hypoxia and diminished by epidermal growth factor. Am J Physiol Cell Physiol. 2000 ;278:982-988
14. DiFederico E, Genbacev O, Fisher S.J. Preeclampsia is associated with widespread apoptosis of placental cytotrophoblasts within the uterine wall. Am J Pathol. 1999 ;155:293-301
15. Neale D.M, Mor G. The role of Fas mediated apoptosis in preeclampsia. J. Perinat Med. 2005 ;33:471-477
16. Fukushima K, Miyamoto S, Tsukimori K. et al. Tumor Necrosis Factor and Vascular Endothelial Growth Factor Induce Endothelial Integrin Repertories, Regulating Endovascular Differentiation and Apoptosis in a Human Extravillous Trophoblast Cell Line. Biol.Reprod. 2005 ;73:172-9
17. Takayama S, Krajewski S, Krajewska M. et al. Expression and location of Hsp70/Hsc-binding anti-apoptotic protein BAG-1 and its variants in normal tissues and tumor cell lines. Cancer Res. 1998 ;58:3116-3131
18. Ding Z, Yang X, Pater A, Tang S.C. Resistance to apoptosis is correlated with the reduced caspase-3 activation and enhanced expression of antiapoptotic protein in human cervical multidrug-resistant cells. Biochem Biophys Res Commun. 2000 ;270:415-420
19. Zhu Y, Hoell P, Ahlemeyer B, Krieglstein J. PTEN: A crucial mediator of mitochondria-dependent apoptosis. Apoptosis. 2006 ;11:197-207
Author contact
![]() Correspondence to: Shin-ichi Ishioka, Department of Obstetrics and Gynecology, Sapporo Medical University, School of Medicine, Minami 1-jo, Nishi 16-chome, Chuou-ku, Sapporo, Japan. E-mail: ishiokaac.jp. Tel: 011-611-2111(ext.3373). Fax: 011-563-0860
Correspondence to: Shin-ichi Ishioka, Department of Obstetrics and Gynecology, Sapporo Medical University, School of Medicine, Minami 1-jo, Nishi 16-chome, Chuou-ku, Sapporo, Japan. E-mail: ishiokaac.jp. Tel: 011-611-2111(ext.3373). Fax: 011-563-0860