Impact Factor ISSN: 1449-1907

 Global reach, higher impact
Int J Med Sci 2026; 23(5):1854-1864. doi:10.7150/ijms.130441 This issue Cite
Research Paper
Diabetes Status Modifies the Association Between Carotid Plaque Burden and Retinal Microvascular Parameters
Ming Yang, Xueru Cheng, Jiaxin Guan, Zixuan Zhou, Jialin Wang ![]()
Department of Ophthalmology, Beijing Friendship Hospital, Capital Medical University, NO.95 Yong'an Road, Xicheng District, Beijing 100050, China.
Received 2025-9-21; Accepted 2026-3-21; Published 2026-4-8
Abstract

Purpose: Carotid plaque burden (CPB) is a key indicator of atherosclerosis, yet its relationship with ocular microcirculation in the context of type 2 diabetes mellitus (T2DM) remains poorly understood. This study aimed to examine the association between CPB and ocular vascular parameters, and to evaluate whether this relationship is modified by diabetic status.
Methods: This retrospective study included 237 eyes from 123 participants (47 with T2DM, 76 without diabetes). All participants underwent head and neck computed tomography angiography (CTA) to quantify CPB using plaque presence and maximum thickness scores. Retinal vascular calibers (central retinal arteriolar equivalent [CRAE], central retinal venular equivalent [CRVE], and arteriovenous ratio [AVR]) were assessed using fundus photography. Hemodynamic parameters (peak systolic velocity [PSV], end-diastolic velocity [EDV], resistance index [RI], and pulsatility index [PI]) of the ophthalmic artery (OA), central retinal artery (CRA), and posterior ciliary artery (PCA) were measured using color Doppler ultrasound. Linear mixed-effects models (LMM) with patient-level random intercepts were employed to account for inter-eye correlation, with adjustment for age, sex, hypertension, smoking history, ischemic heart disease, stroke history, and hyperlipidemia.
Results: In the diabetic group, plaque thickness score was significantly associated with CRAE (beta = -2.223, P = 0.003), AVR (beta = -0.011, P < 0.001), and PCA RI (beta = 0.005, P = 0.021). Plaque presence score was significantly associated with AVR (beta = -0.022, P = 0.021) and PCA RI (beta = 0.016, P = 0.009). No such associations were observed in the non-diabetic group (all P > 0.05). Interaction analyses revealed that diabetic status significantly modified the relationship between plaque thickness and both CRAE (P for interaction = 0.014) and AVR (P for interaction = 0.002). For plaque presence score, diabetic status significantly modified the association with AVR (P for interaction = 0.013).
Conclusion: Diabetic status significantly modifies the associations between CPB and retinal microvascular parameters (CRAE and AVR). These findings underscore the importance of metabolic status in ocular vascular pathology and suggest that diabetic patients may benefit from intensified ocular monitoring even with modest CPB. Further longitudinal studies are warranted to elucidate the underlying mechanisms.
Keywords: carotid plaque burden, diabetes mellitus, retinal microvascular parameters
Introduction
Diabetes mellitus (DM) is a metabolic disorder characterized by chronic hyperglycemia. Its global prevalence continues to rise, with an estimated 537 million cases in 2021, projected to increase to 643 million by 2030 and 783 million by 2045 [1]. DM is a significant risk factor for systemic vascular disease, contributing to microvascular complications (diabetic nephropathy, retinopathy, and neuropathy) and macrovascular complications (stroke and coronary artery disease), which may lead to disability and death, imposing a substantial economic burden on individuals, families, and healthcare systems [2-3]. Carotid plaques can induce carotid artery stenosis, resulting in diminished ocular blood perfusion and alterations in hemodynamics. It is well-established that type 2 diabetes mellitus (T2DM) accelerates the progression of atherosclerosis. Even short-term diabetes may contribute to an elevated CPB, adverse carotid remodeling, and luminal narrowing. A study by Jocelyn et al. reported that carotid artery stenosis and wall thickening in patients with T2DM were associated with a reduction in perifoveal microvascular density [4]. Robyn et al. observed that diabetic patients displayed greater retinal venous tortuosity compared to non-diabetic subjects; however, the positive correlation between tortuosity and glycated hemoglobin (HbA1c) was less pronounced in the diabetic group, indicating potential impairment of retinal vascular autoregulation in diabetes [5].
CPB serves as a critical metric for evaluating the total extent of carotid atherosclerosis and is significant in predicting and mitigating major adverse cardiovascular events [6]. The OA, being the first branch of the internal carotid artery, derives its perfusion directly from upstream hemodynamic conditions. As the principal source of ocular blood supply, the OA is capable of reflecting changes in ocular blood flow in a more immediate and dynamic manner [7]. The retinal artery, which terminates from the OA, along with the short posterior ciliary arteries—responsible primarily for supplying the choroidal circulation—collectively form the terminal vascular system of the carotid artery and exhibit high sensitivity to hemodynamic fluctuations [8].
Current understanding of the relationship between CPB and ocular vascular parameters remains limited, particularly concerning the moderating influence of diabetic status, which has yet to be fully elucidated. This study aims to examine the association between CPB and both morphological and hemodynamic parameters of the ocular vasculature, and to evaluate whether this relationship is modulated by diabetic status.
Methods
Study population
This retrospective study was approved by the Ethics Committee of Beijing Friendship Hospital, Capital Medical University (No. 2020-P2-008). A total of 237 eyes from 123 patients were included.
Inclusion Criteria: Patients who underwent head and neck CT angiography (CTA) and ophthalmic examinations (fundus photography and ocular ultrasound flowmetry) at Beijing Friendship Hospital between January 2014 and December 2019 due to suspected carotid artery disease were enrolled. Based on WHO criteria for type 2 diabetes, patients were stratified into diabetes (DM) and non-diabetes (non-DM) groups. Exclusion Criteria: Patients with diabetic retinopathy (DR) or diabetes duration exceeding 10 years; Ocular pathologies affecting measurements (e.g., severe cataracts, corneal lesions, high myopia, glaucoma, macular degeneration, retinal vascular occlusion, optic nerve disorders); Ophthalmic artery blood flow reflux; Recent (within 3 months) acute cardiovascular or cerebrovascular events (e.g., myocardial infarction, stroke); Systemic infections or malignancies. All participants provided informed consent and were aware of the study's nature and implications.
Demographic data (age, sex, medical history) were collected. Ophthalmic evaluations included slit-lamp examination, color Doppler ultrasound, and fundus photography.
CTA acquisition and CPB assessment
Computed tomography angiography (CTA) was performed using a 64-row multidetector CT scanner (LightSpeed VCT; GE Healthcare, Chicago, IL, USA), covering a range from the aortic arch to the skull base. A total of 65 mL of contrast medium (iohexol, 300 mg iodine/mL) was injected via an 18-gauge needle into the antecubital vein using a power injector at a flow rate of 4 mL/s. A smart prep technique was applied to determine the scan start position. The trigger threshold was set at 140 Hounsfield units (HU), and scanning commenced automatically once the contrast enhancement reached this predefined threshold. The scanning parameters were configured as follows: pixel spacing, 0.625 mm; image matrix, 512 × 512; slice thickness, 0.8 mm; table speed per rotation, 39.37 mm/rotation; gantry rotation time, 0.5 s/rotation; and pitch, 0.984 [9]. Plaque presence was scored with reference to the carotid plaque scoring method proposed by Matangi et al. [10] According to the classification system proposed by Bouthillier et al. [11], the internal carotid artery (ICA) was divided into seven segments, designated C1 through C7: C1, the cervical segment; C2, the petrous segment; C3, the lacerum segment; C4, the cavernous segment; C5, the clinoid segment; C6, the ophthalmic segment; and C7, the communicating segment. A schematic illustration of the Bouthillier classification is provided in Figure 1E.
Computed tomography angiography images of the internal carotid artery (ICA) in a patient with diabetes mellitus (DM) (A, B) and a non-DM subject (C, D), demonstrating the method for plaque thickness measurement. Asterisks indicate the residual lumen of the ICA. White lines represent the measurement of maximal plaque thickness. Schematic illustration of internal carotid artery segmentation (E).
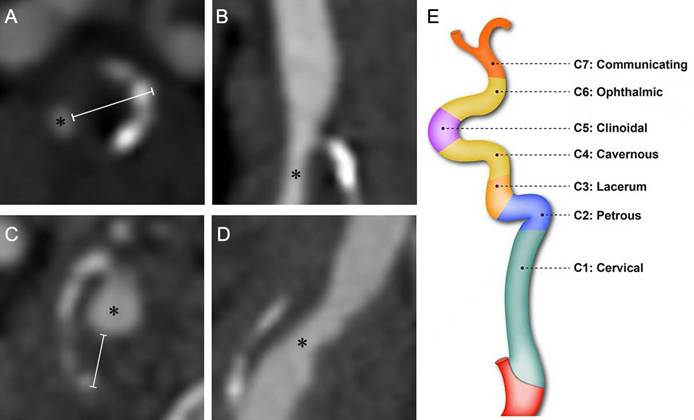
Plaque presence in any segment scored one point, yielding a total score (range: 0-4). The rating only requires the presence/absence of plaques, without considering the number of plaques. The plaque thickness score was based on a modification of the carotid plaque thickness grading system proposed by Ihle-Hansen et al. [12] The maximum thickness of the plaque within each of the aforementioned ICA segments (C1-C2, C3, C4, and C5) was measured via CTA cross-sectional imaging (Figure 1). Each segment was scored based on the maximum plaque thickness (0, 0-1mm, 1-2mm, 2-3mm, and ≥3mm were given 0, 1, 2, 3 and 4 points, respectively). The scores from all segments of the unilateral internal carotid artery were summated to yield the total maximum plaque thickness score, which ranged from 0 to 16. Additionally, we measured the narrowest diameter of each of the aforementioned ICA segments.
Fundus photography and retinal vessel measurement
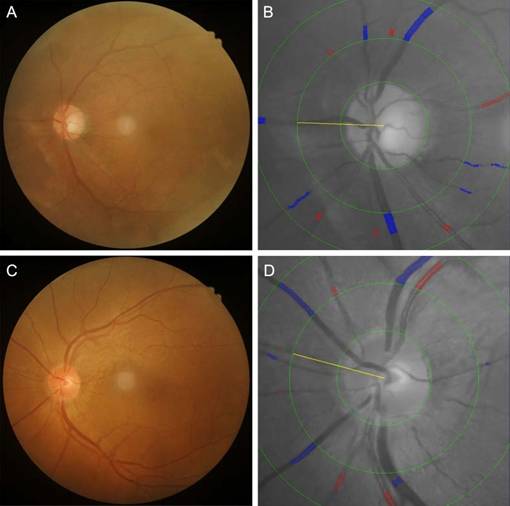
Color fundus images centered on the fovea are acquired for all patients using a Kowa fundus camera (Tokyo, Japan) following pupillary dilation and are evaluated by a single trained technician. High-quality images are required to clearly visualize retinal vasculature, the optic disc, and the macula (Figure 2B). Retinal vessel diameters—including the CRAE, CRVE and AVR—are measured semi-automatically using IVAN software (University of Wisconsin, Madison, WI, USA). Fundus photographs are digitized, and the six largest retinal arterioles and venules are analyzed within a zone 0.5-1.0 disc diameters from the optic disc margin. CRAE, CRVE, and AVR are derived using the modified Parr-Hubbard-Knudtson formula, with results reflecting the luminal diameters of the central retinal artery and vein. The reproducibility of these measurements has been previously validated, with intraclass correlation coefficients (ICCs) exceeding 0.85 for all parameters, confirming high interobserver agreement.
Fundus photographs and corresponding retinal vessel measurements in a patient with diabetes mellitus (DM) (A, B) and a non-DM subject (C, D). In the patient with DM, the central retinal arteriolar equivalent (CRAE), central retinal venular equivalent (CRVE), and arteriolar-to-venular ratio (AVR) were 162.43 μm, 323.21 μm, and 0.503, respectively. In the non-DM subject, CRAE, CRVE, and AVR were 188.92 μm, 337.15 μm, and 0.560, respectively.
Ocular hemodynamic assessment
Ocular blood flow parameters-including the OA, CRA, and PCA-are evaluated using a color Doppler ultrasound system (MyLab Class C, Esaote, Italy) operated by two certified sonographers. Examinations are performed with a 4-12 MHz linear-array transducer and a fixed sample volume of 1 mm, maintaining an insonation angle of < 20° relative to the vessel axis. During the procedure, subjects are positioned supine with eyes closed. The transducer is gently applied to the upper eyelid without exerting pressure on the globe. Following orbital scanning, optimal Doppler spectra are acquired and stored for analysis. The following hemodynamic parameters are recorded: Peak systolic velocity (PSV), representing arterial filling and perfusion intensity; End-diastolic velocity (EDV), reflecting distal tissue blood supply; Resistance index (RI) and pulsatility index (PI), both quantifying vascular resistance. RI is calculated as (PSV-EDV)/PSV, while PI is derived as (PSV-EDV)/mean velocity. Elevated PI values indicate increased diastolic vascular resistance, whereas higher RI suggests greater peripheral vascular impedance [13]. For each vessel, 3-5 consecutive cardiac cycles are analyzed, with total examination time limited to 5 minutes (Figure 2A). Measurement reliability is confirmed by intraclass correlation coefficients >0.85 for all parameters, demonstrating excellent interobserver agreement.
Statistical analyses
We adopted a two-tiered analytical strategy. For patient-level variables (e.g., age, sex, medical history), comparisons between the diabetes and non-diabetes groups were performed using standard tests for independent samples: the independent samples t-test for normally distributed continuous variables, the Mann-Whitney U test for skewed continuous variables, and the chi-square test for categorical variables. For eye-level variables (e.g., ocular vascular diameters and hemodynamic parameters), we employed linear mixed-effects models (LMM) with a random intercept for each participant to account for the inherent correlation between the two eyes. This approach is the preferred method for handling the nested data structure (eyes nested within patients). In cases where the mixed model failed to converge or encountered a singular matrix fit, we reverted to generalized estimating equations (GEE) with an exchangeable correlation structure and robust standard errors to ensure valid and stable statistical inference. All multivariable models were adjusted for potential confounders, including age, sex, hypertension, smoking history, ischemic heart disease, stroke history, and hyperlipidemia. Statistical significance was set at a two-tailed P-value of < 0.05. All analyses were performed using Python 3.8.
Results
Demographic, clinical, and vascular characteristics of participants
A total of 93 eyes from patients with diabetes mellitus (DM; median age 58.0 years; 73.1% male) and 144 eyes from non-DM patients (median age 60.0 years; 69.4% male) were included in this study. The clinical characteristics of the participants are summarized in Table 1. Compared to the non-DM group, the DM group had a significantly higher prevalence of hyperlipidemia (89.2% vs. 66.0%, P < 0.001). No significant differences were observed between the two groups in terms of age, sex, prevalence of carotid artery plaque, hypertension, ischemic heart disease, history of stroke, or smoking history. The minimum diameters of the C1-C2, C3, and C4 segments of the internal carotid artery (ICA) were significantly smaller in the DM group than in the non-DM group. Regarding ocular parameters, the DM group exhibited significantly lower CRAE (145.74±31.03 vs. 155.71±28.93 μm, P = 0.012), lower AVR (0.65±0.12 vs. 0.68±0.13, P = 0.032), lower CRA PSV (8.50 vs. 9.40 cm/s, P<0.001), and higher PCA RI (0.71 vs. 0.68, P = 0.003) compared to the non-DM group. No significant differences were found in other ocular vascular parameters between the groups. Detailed data are presented in Table 1.
Demographic, clinical, and Vascular Characteristics of Participants
| Characteristics | DM (n = 93) | Non-DM (n = 144) | P* |
|---|---|---|---|
| Demographic and clinical characteristics | |||
| Age, y | 58.0 (53.5, 66.0) | 60.0 (56.0, 69.0) | 0.304 |
| Male sex, n (%) | 68 (73.1) | 100 (69.4) | 0.640 |
| Fasting blood glucose (mmol/L) | 6.93 (6.09,8.13) | 5.29 (4.88,5.69) | < 0.001* |
| Carotid plaque, n (%) | 83 (89.2) | 111 (77.1) | 0.089 |
| Hypertension, n (%) | 70 (75.3) | 97 (67.4) | 0.738 |
| Hyperlipidemia, n (%) | 83 (89.2) | 95 (66.0) | <0.001* |
| Ischemic heart disease, n (%) | 34 (36.6) | 36 (25.0) | 0.090 |
| Stroke history, n (%) | 64 (68.8) | 91 (63.2) | 0.960 |
| Smoking history, n (%) | 46 (49.5) | 62 (43.1) | 0.756 |
| ICA diameters | |||
| C1-C2 min diameter, mm | 2.80 (2.30, 3.15) | 3.10 (2.60, 3.50) | < 0.001* |
| C3 min diameter, mm | 3.00 (2.30, 3.70) | 3.50 (2.83, 3.90) | < 0.001* |
| C4 min diameter, mm | 3.20 (2.70, 3.78) | 3.60 (3.00, 4.20) | 0.001* |
| C5 min diameter, mm | 3.90 (3.20, 4.30) | 4.00 (3.53, 4.30) | 0.042* |
| Ocular vascular diameters | |||
| OA diameter, mm | 1.30 (1.20, 1.40) | 1.25 (1.20, 1.40) | 0.524 |
| CRAE, μm | 145.74±31.03 | 155.71±28.93 | 0.012* |
| CRVE, μm | 244.75 (207.35, 247.48) | 230.90 (214.01, 245.98) | 0.518 |
| AVR | 0.65±0.12 | 0.68±0.13 | 0.032* |
| Ocular arterial hemodynamic parameters | |||
| OA PSV, cm/s | 32.40 (22.90, 42.65) | 31.10 (21.45, 38.65) | 0.164 |
| OA EDV, cm/s | 7.25 (4.66, 10.95) | 6.83 (4.70, 9.48) | 0.458 |
| OA RI | 0.76 (0.70, 0.82) | 0.74 (0.69, 0.80) | 0.706 |
| OA PI | 1.26 (1.10, 1.47) | 1.24 (1.10, 1.40) | 0.303 |
| CRA PSV, cm/s | 8.50 (6.79, 9.83) | 9.40 (8.06, 11.48) | < 0.001* |
| CRA EDV, cm/s | 2.30 (1.80, 2.95) | 2.50 (1.91, 3.10) | 0.107 |
| CRA RI | 0.71 (0.67, 0.77) | 0.74 (0.67, 0.78) | 0.407 |
| CRA PI | 1.14±0.18 | 1.18±0.20 | 0.111 |
| PCA PSV, cm/s | 11.60 (9.80, 14.50) | 12.15 (9.51, 15.60) | 0.935 |
| PCA EDV, cm/s | 3.20 (2.50, 4.20) | 3.50 (2.66, 4.59) | 0.748 |
| PCA RI | 0.71 (0.66, 0.77) | 0.68 (0.63, 0.75) | 0.003* |
| PCA PI | 1.11 (0.99, 1.24) | 1.08 (0.95, 1.21) | 0.138 |
Data were presented as mean ± standard deviation, number (%), or median (25th percentile, 75th percentile). For patient-level variables, comparisons between groups were performed using independent samples t-test, Mann-Whitney U test, or chi-square test as appropriate. For eye-level variables, P-values were derived from linear mixed-effects models with a patient-level random intercept to account for inter-eye correlation. DM, diabetes mellitus; ICA, internal carotid artery; OA, ophthalmic artery; CRAE, central retinal artery equivalent; CRVE, central retinal vein equivalent; AVR, arteriovenous ratio; CRA, central retinal artery; PCA, posterior ciliary artery; PSV, peak systolic velocity; EDV, end-diastolic velocity; RI, resistance index; PI, pulsatility index. *P < 0.05
Correlations between internal carotid artery plaque parameters and ocular parameters in DM and non-DM groups
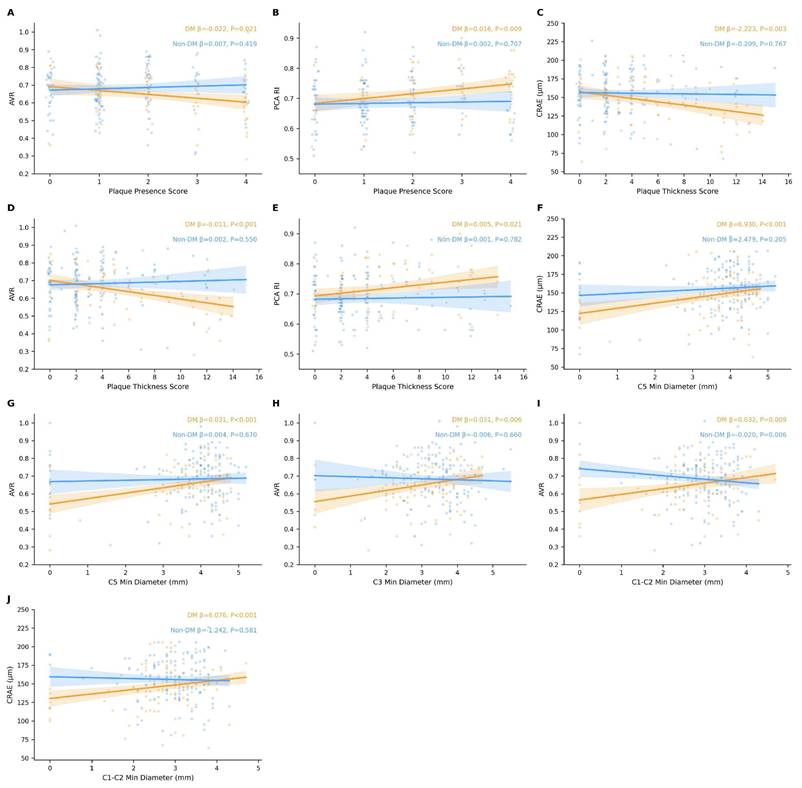
As shown in Figure 3, after accounting for inter-eye correlation using patient-level clustered models and adjusting for extended confounders (age, sex, hypertension, smoking history, ischemic heart disease, stroke history, and hyperlipidemia), distinct patterns of association emerged between carotid plaque parameters and ocular outcomes in the DM versus non-DM groups. In the DM group, the plaque presence score was significantly associated with AVR (beta = -0.022, P = 0.021) and PCA RI (beta = 0.016, P = 0.009). The plaque thickness score was significantly associated with CRAE (beta = -2.223, P = 0.003), AVR (beta = -0.011, P < 0.001), and PCA RI (beta = 0.005, P = 0.021). Segmental analysis of ICA diameters in the DM group revealed that the minimal diameter of the C5 segment was significantly associated with both CRAE (beta = 6.930, P < 0.001) and AVR (beta = 0.031, P < 0.001). The C1-C2 segment minimal diameter showed significant associations with CRAE (beta = 6.076, P < 0.001) and AVR (beta = 0.032, P = 0.009). The C3 segment minimal diameter was significantly associated with AVR (beta = 0.031, P = 0.006). In the non-DM group, no significant associations were observed between plaque thickness score, plaque presence score, or most ICA segmental diameters and the ocular parameters examined (all P > 0.05). However, an unexpected inverse association was detected between the C1-C2 segment minimal diameter and AVR (beta = -0.020, P = 0.006), while the association with CRAE remained non-significant (beta = -1.242, P = 0.581).
Correlations between ICA plaque parameters (plaque presence score, plaque thickness score, and segmental minimum diameters) and ocular parameters (CRAE, AVR, and PCA RI) in the DM and non-DM groups. Correlation coefficients and P-values were derived from linear mixed-effects models with a patient-level random intercept to account for inter-eye correlation; generalized estimating equations (GEE) with an exchangeable correlation structure were used when mixed models failed to converge. All models were adjusted for age, sex, hypertension, smoking history, ischemic heart disease, stroke history, and hyperlipidemia. *P < 0.05. ICA, internal carotid artery; CRAE, central retinal arteriolar equivalent; AVR, arteriovenous ratio; PCA, posterior ciliary artery; RI, resistance index; DM, diabetes mellitus.
Associations of plaque presence score with ocular parameters: interactions with diabetes status
To further investigate whether diabetic status modifies the associations of plaque thickness score and plaque presence score with ocular parameters, interaction terms were incorporated into linear mixed-effects models accounting for inter-eye correlation, with adjustment for age, sex, hypertension, smoking history, ischemic heart disease, stroke history, and hyperlipidemia (Tables 2 and 3). For PCA RI, DM showed a significant positive association in the main effects model (B = 0.036; 95% CI: 0.013 to 0.058; P = 0.002), while plaque presence score was not significantly associated with PCA RI (B = 0.008; 95% CI: -0.001 to 0.016; P = 0.089). The interaction term (DM × plaque presence score) for PCA RI did not reach statistical significance in the interaction model (B = 0.015; 95% CI: -0.003 to 0.032; P = 0.096). For AVR, although neither plaque presence score nor DM showed significant main effects, the interaction term (DM × plaque presence score) was significant (B = -0.033; 95% CI: -0.060 to -0.007; P = 0.013) (Table 2).
Linear mixed-effects / clustered models for associations of plaque presence score, DM, and their interaction with PCA RI and AVR (extended confounder adjustment).
| PCA RI (Main effects) B (95% CI) | PCA RI (Main effects) P | PCA RI (Interaction model) B (95% CI) | PCA RI (Interaction model) P | AVR (Main effects) B (95% CI) | AVR (Main effects) P | AVR (Interaction model) B (95% CI) | AVR (Interaction model) P | |
|---|---|---|---|---|---|---|---|---|
| Plaque presence score | 0.008 (-0.001, 0.016) | 0.089 | 0.001 (-0.011, 0.013) | 0.863 | -0.005 (-0.019, 0.008) | 0.436 | 0.009 (-0.008, 0.027) | 0.301 |
| DM | 0.036 (0.013, 0.058) | 0.002* | 0.008 (-0.032, 0.048) | 0.694 | -0.032 (-0.068, 0.004) | 0.083 | 0.030 (-0.031, 0.091) | 0.331 |
| DM × Plaque presence score | 0.015 (-0.003, 0.032) | 0.096 | -0.033 (-0.060, -0.007) | 0.013* | ||||
| Age | 0.002 (0.001, 0.003) | 0.003* | 0.002 (0.001, 0.003) | 0.006* | -0.001 (-0.003, 0.001) | 0.2 | -0.001 (-0.003, 0.001) | 0.295 |
| Sex female1 male0 | 0.001 (-0.011, 0.012) | 0.932 | 0.001 (-0.011, 0.013) | 0.886 | 0.010 (-0.008, 0.028) | 0.295 | 0.009 (-0.009, 0.027) | 0.327 |
| Hypertension | -0.016 (-0.041, 0.008) | 0.190 | -0.015 (-0.039, 0.010) | 0.242 | -0.020 (-0.057, 0.017) | 0.299 | -0.024 (-0.061, 0.013) | 0.204 |
| Smoking history | -0.002 (-0.017, 0.014) | 0.824 | -0.002 (-0.017, 0.014) | 0.824 | -0.005 (-0.029, 0.019) | 0.694 | -0.005 (-0.029, 0.018) | 0.664 |
| Ischemic heart disease | 0.016 (-0.009, 0.040) | 0.216 | 0.014 (-0.010, 0.039) | 0.250 | 0.014 (-0.024, 0.051) | 0.478 | 0.016 (-0.021, 0.054) | 0.384 |
| Stroke history | -0.000 (-0.023, 0.022) | 0.969 | 0.001 (-0.021, 0.023) | 0.930 | -0.011 (-0.044, 0.023) | 0.527 | -0.014 (-0.047, 0.019) | 0.409 |
| Hyperlipidemia | -0.014 (-0.040, 0.012) | 0.278 | -0.012 (-0.038, 0.014) | 0.355 | -0.009 (-0.049, 0.031) | 0.647 | -0.013 (-0.053, 0.026) | 0.505 |
PCA, posterior ciliary artery; RI, resistance index; AVR, arteriovenous ratio; DM, diabetes mellitus. Linear mixed-effects models included a patient-level random intercept to account for inter-eye correlation. *P<0.05.
Linear mixed-effects / clustered models for associations of plaque thickness score, DM, and their interaction with CRAE and AVR (extended confounder adjustment).
| CRAE (Main effects) B (95% CI) | CRAE (Main effects) P | CRAE (Interaction model) B (95% CI) | CRAE (Interaction model) P | AVR (Main effects) B (95% CI) | AVR (Main effects) P | AVR (Interaction model) B (95% CI) | AVR (Interaction model) P | |
|---|---|---|---|---|---|---|---|---|
| Plaque thickness score | -1.288 (-2.342, -0.235) | 0.017* | -0.031 (-1.472, 1.409) | 0.966 | -0.004 (-0.009, 0.001) | 0.083 | 0.003 (-0.004, 0.009) | 0.407 |
| DM | -8.618 (-16.893, -0.343) | 0.041* | 2.837 (-9.401, 15.075) | 0.650 | -0.028 (-0.064, 0.008) | 0.125 | 0.033 (-0.020, 0.085) | 0.225 |
| DM × Plaque thickness score | -2.603 (-4.678, -0.528) | 0.014* | -0.014 (-0.023, -0.005) | 0.002* | ||||
| Age | -0.269 (-0.728, 0.191) | 0.252 | -0.234 (-0.688, 0.221) | 0.314 | -0.001 (-0.003, 0.001) | 0.234 | -0.001 (-0.003, 0.001) | 0.305 |
| Sex female1 male0 | 2.570 (-1.543, 6.683) | 0.221 | 2.402 (-1.660, 6.464) | 0.246 | 0.010 (-0.008, 0.028) | 0.283 | 0.009 (-0.009, 0.026) | 0.320 |
| Hypertension | -5.973 (-14.528, 2.583) | 0.171 | -6.523 (-14.973, 1.926) | 0.130 | -0.021 (-0.058, 0.016) | 0.263 | -0.024 (-0.060, 0.012) | 0.195 |
| Smoking history | -0.376 (-5.907, 5.155) | 0.894 | -0.617 (-6.078, 4.845) | 0.825 | -0.004 (-0.028, 0.020) | 0.735 | -0.005 (-0.029, 0.018) | 0.652 |
| Ischemic heart disease | 4.518 (-4.098, 13.135) | 0.304 | 5.274 (-3.255, 13.803) | 0.226 | 0.014 (-0.023, 0.052) | 0.45 | 0.018 (-0.018, 0.055) | 0.326 |
| Stroke history | 2.781 (-4.887, 10.449) | 0.477 | 1.922 (-5.686, 9.531) | 0.620 | -0.010 (-0.043, 0.023) | 0.557 | -0.015 (-0.047, 0.018) | 0.385 |
| Hyperlipidemia | 2.813 (-6.344, 11.969) | 0.547 | 2.150 (-6.896, 11.196) | 0.641 | -0.008 (-0.047, 0.032) | 0.708 | -0.011 (-0.050, 0.028) | 0.577 |
CARE, central retinal arteriolar equivalent; AVR, arteriovenous ratio; DM, diabetes mellitus. Linear mixed-effects models included a patient-level random intercept to account for inter-eye correlation. *P < 0.05.
Associations of plaque thickness with ocular parameters: interactions with diabetes status
Similar trends were observed when plaque presence score was used as the independent variable (Table 3). In the analysis using plaque thickness score (Table 3), the main effects model for CRAE showed that both plaque thickness score (B = -1.288; 95% CI: -2.342 to -0.235; P = 0.017) and DM (B = -8.618; 95% CI: -16.893 to -0.343; P = 0.041) were negatively associated with CRAE. The interaction term (DM × plaque thickness score) remained significant in the interaction model (B = -2.603; 95% CI: -4.678 to -0.528; P = 0.014), indicating that the effect of plaque thickness on CRAE varied by diabetic status. Although the total plaque thickness score was not significantly associated with AVR in the main effects model (B = -0.004; 95% CI: -0.009 to 0.001; P = 0.083), the interaction term (DM × plaque thickness score) was significant in the interaction model (B = -0.014; 95% CI: -0.023 to -0.005; P = 0.002).
Discussion
The present study identified significant negative associations between carotid plaque burden (CPB) and both CRAE and AVR among individuals with diabetes, whereas no such associations were observed in non-diabetic subjects after adjusting for inter-eye correlation and extended confounders. These findings suggest that diabetic status modifies the relationship between carotid atherosclerosis and retinal microvascular parameters. Our results are partially consistent with previous studies, though some discrepancies warrant discussion. For example, a prospective nested case-control study involving 156 participants reported that AVR and CRAE—but not central retinal venous equivalent (CRVE)—were significantly associated with the risk of carotid plaque formation, independent of body mass index, hypertension, and diabetes [14]. This discrepancy may be attributed to two main factors: differences in the comprehensiveness of carotid plaque assessment methods and the specific influence of diabetes on microvascular pathology. First, our study utilized more comprehensive analytical indicators. By incorporating both plaque presence scores and maximum plaque thickness scores, we achieved more sensitive detection of plaque severity and a more accurate representation of the extent of carotid atherosclerosis. This approach is particularly relevant in diabetic populations, where plaque burden tends to be greater and its association with retinal microvascular damage is more pronounced. In contrast, other studies may have relied on relatively simplistic metrics—such as binary ultrasound-based plaque presence—which are insufficient to differentiate variations in plaque burden and severity [15-16]. The comprehensive evaluation employed in our study thus enhanced the detectability of the relationship between CPB and microvascular alterations. Second, our findings indicate that diabetes may amplify the association between carotid atherosclerosis and ocular microvascular parameters through distinct pathophysiological pathways, positioning diabetes as an exacerbating factor in vascular disease [17]. Hemodynamic disturbances originating from carotid plaques are transmitted via branches of the ophthalmic artery to the retinal and choroidal circulations. Retinal vessels possess autoregulatory mechanisms: in response to decreased ocular perfusion pressure, retinal arterioles initially dilate to maintain blood flow and perfusion. However, beyond a certain threshold, compensatory vasoconstriction occurs [18-19]. We hypothesize that diabetic individuals may exhibit impaired vascular autoregulation, potentially rendering them more vulnerable to upstream hemodynamic fluctuations and leading to earlier exhaustion of compensatory reserves. This hypothesis is supported by recent basic research demonstrating that hyperglycemia induces endothelial oxidative stress via upregulation of NADPH oxidase and mitochondrial fission proteins, leading to reduced nitric oxide (NO) bioavailability and impaired endothelium-dependent vasodilation [20]. In the retinal circulation, where arteriolar diameter is highly dependent on NO-mediated tone [21], this mechanism may directly contribute to the observed association between CPB and CRAE in diabetic patients.
Regarding the posterior ciliary artery circulation, we observed that diabetic patients exhibited significantly higher PCA RI compared to non-diabetic individuals, suggesting that diabetes itself is associated with increased choroidal vascular resistance. Furthermore, after extended confounder adjustment, plaque thickness score—but not plaque presence score—was significantly associated with PCA RI within the diabetic group, indicating that carotid hemodynamic alterations may preferentially affect choroidal perfusion in diabetic patients. However, in the plaque presence score analysis, the interaction effect on PCA RI was attenuated and no longer reached statistical significance, whereas the interaction effect on AVR remained robust. This discrepancy may reflect that plaque thickness is a more sensitive indicator of hemodynamic compromise than plaque presence, or that the choroidal circulation is influenced by a broader set of factors beyond those captured in our models, consistent with the limited autoregulatory capacity of the choroidal vasculature [22]. A potential mechanism that may contribute to these findings involves hemodynamic coupling: carotid stenosis could reduce blood supply through the OA, and diabetic individuals, owing to possibly impaired choroidal autoregulation, may experience more pronounced reductions in EDV and elevations in RI [23]. However, given the cross-sectional design, this mechanistic interpretation remains hypothetical and requires confirmation in future longitudinal studies. Previous studies have also indicated that diabetes-related carotid stenosis increases the risk of hypoperfusion and ocular ischemic syndrome [24]. Additionally, recent basic research has shown that in type 1 diabetes, endothelial PFKFB3 is further upregulated, resulting in excessive glycolysis that increases lactate production on one hand, and on the other hand exacerbates oxidative stress through Nox1-dependent pathways and activates methylglyoxal-HIF-1α signaling, ultimately associated with impaired endothelium-dependent relaxation. In diabetic patients, the metabolic reprogramming (enhanced glycolysis) induced by disturbed flow and hyperglycemia may have a synergistic effect [25]. The choroidal circulation, with its limited autoregulatory capacity, may be particularly susceptible to such metabolic stress [25].
This study also identified a significant negative correlation between the minimum diameter of each carotid segment and both CRAE and AVR in the diabetic group—a relationship absents in non-diabetic individuals. This further supports the hypothesis that diabetes exacerbates vascular pathology, thereby modulating the interaction between carotid stenosis and ocular microcirculation. Experimental studies have demonstrated that high fructose intake induces aortic oxidative stress in rats, characterized by upregulation of NADPH oxidase subunit p47phox and eNOS uncoupling (reflected by a decreased eNOS dimer/monomer ratio), which is associated with reduced NO bioavailability and impaired endothelium-dependent vasodilation [21]. These mechanisms may collectively explain the negative correlation between carotid stenosis and CRAE observed in diabetic patients. Prior research has demonstrated that retinal hemodynamic abnormalities in diabetic retinopathy are closely linked to systemic vascular conditions such as carotid atherosclerosis [26]. Our results reinforce this concept and suggest that diabetes is associated with more pronounced adverse effects of carotid stenosis on ocular microvascular health. In non-diabetic individuals, neither CPB nor stenosis severity was correlated with the ocular parameters examined. This may imply that non-diabetic subjects retain relatively robust vascular regulatory mechanisms, capable of maintaining ocular perfusion through compensatory vasodilation or collateral circulation [27]. Moreover, carotid plaques in non-diabetic individuals may be less frequently associated with microcirculatory impairment, thereby exerting limited influence on ocular hemodynamics. A population-based cross-sectional study also reported stronger correlations between carotid intima-media thickness and retinal microvascular parameters in diabetic patients, with causal implications for structural, functional, and hemodynamic ocular changes in this population [28]—consistent with our findings.
In our cohort, diabetic patients exhibited significantly smaller CRAE and AVR values compared to non-diabetic individuals, indicative of early microvascular structural remodeling in diabetes. Hyperglycemia promotes the accumulation of advanced glycation end products, oxidative stress, and inflammatory activation, leading to basement membrane thickening, endothelial dysfunction, arteriolar narrowing, and dysregulated vascular tone [29]. The underlying mechanism may involve endothelial-to-mesenchymal transition (EndMT). EndMT is a cellular differentiation process driven by signals such as TGF-β and is involved in the pathogenesis of various chronic vascular diseases [30]. Hyperglycemia can elevate TGF-β levels, and TGF-β-induced EndMT is sustained and continuously amplified through a metabolic-epigenetic positive feedback loop. This EndMT process, driven by metabolic reprogramming, is a key mechanism of small artery structural remodeling (e.g., vessel wall thickening) and may explain the more pronounced reduction in AVR observed in the diabetic group [31].
Notably, a previous study by Robyn et al. demonstrated that HbA1c was significantly associated with retinal venular diameter but showed minimal association with arteriolar diameter [5], suggesting that glycemic control may have differential effects on arterial versus venous sides of the retinal circulation. This is consistent with our focus on arteriolar parameters (CRAE and AVR) and supports the biological plausibility of our findings despite the absence of HbA1c data. In contrast to our results, one cross-sectional case-control study reported no significant differences in CRAE, CRVE, or AVR between newly diagnosed type 2 diabetes patients and healthy controls [32]. Another study described increased CRAE in mild non-proliferative diabetic retinopathy (NPDR) and decreased CRAE in severe NPDR and proliferative diabetic retinopathy (PDR), while finding no significant difference between patients with and without retinopathy [1]. These discrepancies may reflect variations in diabetes duration and severity, which are known modifiers of CRAE and AVR [1,32]. Our findings further underscore the impact of systemic metabolic dysregulation on ocular microvascular architecture, suggesting that microvascular diameter changes may precede overt diabetic retinopathy. We also observed hemodynamic impairments in the diabetic group. Reduced PSV in the central retinal artery implies diminished retinal perfusion. In diabetic patients, lower PSV may be attributable to increased microvascular resistance [33]. Hyperglycemia attenuates endothelial nitric oxide synthesis and promotes calcium overload in vascular smooth muscle cells, resulting impaired vasodilation and increased arterial stiffness [34]. Elevated PCA RI reflects heightened distal vascular resistance, likely associated with choroidal microcirculatory dysfunction. Diabetic choroidopathy often involves ischemic changes due to pericyte loss, capillary occlusion, and vascular leakage [35]. Increased RI may indicate reduced choroidal flow reserve, supporting the hypothesis that choroidal hemodynamics are compromised early in diabetes. This aligns with previous work; for instance, Divya et al. reported significant alterations in resistivity indices and flow velocities in retrobulbar vessels among diabetic patients compared to controls [36], suggesting that PCA RI could serve as a potential biomarker for choroidal ischemia and early diabetic retinopathy. However, the inconsistency in our PCA RI interaction findings across different plaque metrics underscores the need for further research to clarify the relationship between carotid atherosclerosis and choroidal hemodynamics in diabetes.
A key strength of this study is the application of both plaque presence and maximum thickness scores to quantify CPB, combined with rigorous statistical methods (linear mixed-effects models with patient-level random intercepts) to account for inter-eye correlation and extensive confounder adjustment. Our results support clinically relevant distinctions in the management of carotid plaque between diabetic and non-diabetic individuals. Diabetic patients may benefit from intensified monitoring of ocular vascular parameters even when CPB is modest, whereas non-diabetic individuals may be managed based on systemic risk profiles. However, several limitations should be acknowledged. First, the cross-sectional design precludes causal inference; the observed associations cannot establish directionality or temporality. Second, the relatively small sample size, particularly for interaction analyses, may partly explain why the interaction effect on PCA RI in the plaque presence analysis lost significance after extensive confounder adjustment. Third, although we were able to retrieve fasting blood glucose data for the majority of participants, HbA1c, BMI, and detailed diabetes duration data were not available for all participants in this retrospective cohort. Future prospective studies should incorporate comprehensive metabolic profiling to better isolate the independent effects of carotid plaque burden on ocular hemodynamics.
Conclusion
Diabetes significantly modifies the associations between carotid plaque burden and retinal microvascular parameters (CRAE and AVR), with the modifying effect being more consistent for the retinal circulation compared to the choroidal circulation. These findings underscore the importance of metabolic status in ocular vascular pathology and suggest that diabetic patients may benefit from intensified ocular monitoring even with modest carotid plaque burden. Future studies with larger sample sizes and longitudinal designs are warranted to elucidate the underlying molecular mechanisms and to develop integrated vascular protection strategies tailored to the diabetic population.
Acknowledgements
All the authors thank the library of Beijing Friendship Hospital for assistance with literature search.
Funding
This study was supported by the National Natural Science Foundation of China (No. 82301204) and the Beijing Hospitals Authority Innovation Studio of Young Staff Funding Support (No. 202103).
Author contributions
JL Wang mainly contributed in study design and manuscript revision; M Yang mainly contributed to the data collection, statistical analysis, literature search and manuscript writing; both authors read and approved the final manuscript. XR Cheng, JX Guan, and ZY Zhou contributed to the data collection and statistical analysis.
Competing Interests
The authors have declared that no competing interest exists.
References
1. Xiao X, Zhao J, Lin S. et al. Relationships Between Retinal Vascular Characteristics and Systemic Indicators in Patients With Diabetes Mellitus. Invest Ophthalmol Vis Sci. 2025;66(4):72 doi:10.1167/iovs.66.4.72
2. Tomic D, Walker-Bone K, Keegel T. et al. Diabetes mellitus and work participation. Nat Rev Endocrinol. 2025 doi:10.1038/s41574-025-01194
3. Parker ED, Lin J, Mahoney T. et al. Economic Costs of Diabetes in the U.S. in 2022. Diabetes Care. 2023;47(1):26-43 doi:10.2337/dci23-0085
4. Drinkwater JJ, Chen FK, Brooks AM. et al. Carotid Disease and Retinal Optical Coherence Tomography Angiography Parameters in Type 2 Diabetes: The Fremantle Diabetes Study Phase II. Diabetes Care. 2020;43(12):3034-3041 doi:10.2337/dc20-0370
5. Tapp RJ, Owen CG, Barman SA. et al. Retinal microvascular associations with cardiometabolic risk factors differ by diabetes status: results from the UK Biobank. Diabetologia. 2022;65(10):1652-1663 doi:10.1007/s00125-022-05745-y
6. Spence JD. Assessment of atherosclerosis: should coronary calcium score and intima-media thickness be replaced by ultrasound measurement of carotid plaque burden and vessel wall volume? Curr Opin Lipidol. 2023;34(3):126-132 doi:10.1097/MOL.0000000000000880
7. Costa VP, Kuzniec S, Molnar LJ. et al. Collateral blood supply through the ophthalmic artery: a steal phenomenon analyzed by color Doppler imaging. Ophthalmology. 1998;105(4):689-693 doi:10.1016/S0161-6420(98)94025-8
8. Zhou ZH, Cheng XR, Guan JX. et al. A Nomogram Based on Ocular Hemodynamics for Predicting Ischemic Stroke. Am J Ophthalmol. 2025;274:91-100 doi:10.1016/j.ajo.2025.02.034
9. Wu LT, Wang JL, Wang YL. Ophthalmic artery changes in type 2 diabetes with and without acute coronary syndrome. J Transl Med. 2022;20(1):512 doi:10.1186/s12967-022-03712-0
10. Matangi MF, Hétu MF, Armstrong DWJ. et al. Carotid plaque score is associated with 10-year major adverse cardiovascular events in low-intermediate risk patients referred to a general cardiology community clinic. Eur Heart J Cardiovasc Imaging. 2024;26(4):714-724 doi:10.1093/ehjci/jeae153
11. Bouthillier A, van Loveren HR, Keller JT. Segments of the internal carotid artery: a new classification. Neurosurgery. 1996;38(3):425-432 discussion 432-433. doi:10.1097/00006123-199603000-00001
12. Ihle-Hansen H, Vigen T, Berge T. et al. Carotid Plaque Score for Stroke and Cardiovascular Risk Prediction in a Middle-Aged Cohort From the General Population. J Am Heart Assoc. 2023;12(17):e030739 doi:10.1161/JAHA.123.030739
13. Albaghdadi AJH, Hewitt MA, Putos SM. et al. Tacrolimus in the prevention of adverse pregnancy outcomes and diabetes-associated embryopathies in obese and diabetic mice. J Transl Med. 2017;15(1):32 doi:10.1186/s12967-017-1137-4
14. Jiang Y, Yan S, Fan F. et al. Association of Retinal Arterial Narrowing With New-Onset Carotid Plaque: A Chinese Community-Based Nested Case-Control Cohort Study. J Clin Hypertens (Greenwich). 2025;27(3):e14983 doi:10.1111/jch.14983
15. Huang H, Cao Y, Li J. et al. Association between retinal arterial narrowing and left ventricular diastolic dysfunction in masked hypertensives. J Clin Hypertens (Greenwich). 2020;22(6):1050-1058 doi:10.1111/jch.13863
16. Masaidi M, Cuspidi C, Giudici V. et al. Is retinal arteriolar-venular ratio associated with cardiac and extracardiac organ damage in essential hypertension? J Hypertens. 2009;27(6):1277-1283 doi:10.1097/HJH.0b013e32832a4012
17. Divers J, Wagenknecht LE, Bowden DW. et al. Ethnic differences in the relationship between pericardial adipose tissue and coronary artery calcified plaque: African-American-diabetes heart study. J Clin Endocrinol Metab. 2010;95(12):5382-5389 doi:10.1210/jc.2010-0793
18. Cankurtaran V, Ergshev K, Arifoglu HB, Ozates S. Retinal vasculature changes in patients with internal carotid artery stenosis. Int Ophthalmol. 2024;44(1):415 doi:10.1007/s10792-024-03343-y
19. Shen Z, Zhang S, Yu W. et al. Optical Coherence Tomography Angiography: Revolutionizing Clinical Diagnostics and Treatment in Central Nervous System Disease. Aging Dis. 2024;16(1):77-114 doi:10.14336/AD.2024.0112
20. Mori A, Sakurai A, Takimoto S. et al. Quercetin Dilates Retinal Arterioles via Nitric Oxide-Dependent Mechanisms in Rats. Int J Mol Sci. 2026 27
21. Pengnet S, Chonpathompikunlert P, Suttikul S. et al. Bifidobacterium pseudolongum TISTR 2737 Supplementation Alleviates High Fructose-Induced Vascular Injury and Inflammation by Modulating eNOS Uncoupling, AGEs/RAGE Pathway, and NADPH Oxidase Expression. Probiotics Antimicrob Proteins. 2026
22. Jiang J, Wang J, Wang Y. et al. Associations between the retinal/choroidal microvasculature and carotid plaque in patients with CAD: An OCTA study. Heliyon. 2024;10(7):e29107 doi:10.1016/j.heliyon.2024.e29107
23. Hua R, Liu L, Wang X, Chen L. Imaging evidence of diabetic choroidopathy in vivo: angiographic pathoanatomy and choroidal-enhanced depth imaging. PLoS One. 2013;8(12):e83494 doi:10.1371/journal.pone.0083494
24. Gong A, Fu W, Li H. et al. A Siamese ResNeXt network for predicting carotid intimal thickness of patients with T2DM from fundus images. Front Endocrinol (Lausanne). 2024;15:1364519 doi:10.3389/fendo.2024.1364519
25. Atawia RT, Batori RK, Jordan CR. et al. Type 1 Diabetes Impairs Endothelium-Dependent Relaxation Via Increasing Endothelial Cell Glycolysis Through Advanced Glycation End Products, PFKFB3, and Nox1-Mediated Mechanisms. Hypertension. 2023;80(10):2059-2071 doi:10.1161/HYPERTENSIONAHA.123.21341
26. AlQahtani AS, Hazzazi MA, Waheeb SA. et al. Saudi Arabia Guidelines for diabetic macular edema: A consensus of the Saudi Retina Group. Saudi Med J. 2021;42(2):131-145 doi:10.15537/smj.2021.2.25623
27. Liu R, Shao J. Research progress on risk factors related to intracranial artery, carotid artery, and coronary artery stenosis. Front Cardiovasc Med. 2022;9:970476 doi:10.3389/fcvm.2022.970476
28. Ichinohasama K, Kunikata H, Ito A. et al. The Relationship between Carotid Intima-Media Thickness and Ocular Circulation in Type-2 Diabetes. J Ophthalmol. 2019;2019:3421305 doi:10.1155/2019/3421305
29. He W, Tang P, Lv H. Targeting oxidative stress in diabetic retinopathy: mechanisms, pathology, and novel treatment approaches. Front Immunol. 2025;16:1571576 doi:10.3389/fimmu.2025.1571576
30. Pan Y, Si J. Endothelial Metabolic Reprogramming Links Diabetes to Atherosclerosis. Diabetes Metab Syndr Obes. 2026;19:565805 doi:10.2147/DMSO.S565805
31. Zhu X, Wang Y, Soaita I. et al. Acetate controls endothelial-to-mesenchymal transition. Cell Metab. 2023;35(7):1163-1178.e10 doi:10.1016/j.cmet.2023.05.010
32. Nikolaidou B, Triantafyllou A, Anyfanti P. et al. Nighttime Systolic Blood Pressure a Major Factor of Retinal Vascular Caliber Changes in Patients with Newly Diagnosed Type 2 Diabetes Mellitus. Am J Hypertens. 2025;38(4):217-224 doi:10.1093/ajh/hpaf004
33. Zou C, Jiao Y, Li X. et al. Differences between healthy adults and patients with type 2 diabetes mellitus in reactivity of toe microcirculation by ultrasound combined with a warm bath test. Medicine (Baltimore). 2017;96(22):e7035 doi:10.1097/MD.0000000000007035
34. Guo X, Shi Y, Huang X. et al. Features analysis of lower extremity arterial lesions in 162 diabetes patients. J Diabetes Res. 2013;2013:781360 doi:10.1155/2013/781360
35. Long L, Li Y, Yu S. et al. Scutellarin Prevents Angiogenesis in Diabetic Retinopathy by Downregulating VEGF/ERK/FAK/Src Pathway Signaling. J Diabetes Res. 2019;2019:4875421 doi:10.1155/2019/4875421
36. Divya K, Kanagaraju V, Devanand B. et al. Evaluation of retrobulbar circulation in type 2 diabetic patients using color Doppler imaging. Indian J Ophthalmol. 2020;68(6):1108-1114 doi:10.4103/ijo.IJO_1398_19
Author contact
![]() Corresponding author: Jialin Wang, Email: wangjialinedu.cn.
Corresponding author: Jialin Wang, Email: wangjialinedu.cn.