ISSN: 1449-1907International Journal of Medical Sciences
- Current issue
- Volume 21; 2024
- Volume 20; 2023
- Volume 19; 2022
- Volume 18; 2021
- Volume 17; 2020
- Archive
- Cover images
- Index & coverage
- Cover suggestion
- Special issues
Introduction
Materials and Methods
Results
Discussion
Conclusions
Abbreviations
Acknowledgements
References

Int J Med Sci 2020; 17(6):773-786. doi:10.7150/ijms.43272 This issue Cite
Research Paper
Integrative analysis of DNA methylation-driven genes for the prognosis of lung squamous cell carcinoma using MethylMix
Rui Li1, Yun-Hong Yin1, Jia Jin2, Xiao Liu1, Meng-Yu Zhang1, Yi-E Yang3 ![]() , Yi-Qing Qu1
, Yi-Qing Qu1 ![]()
1. Department of Respiratory and Critical Care Medicine, Qilu Hospital of Shandong University, Jinan 250012, China.
2. Department of Cardiology, Zhangqiu District People's Hospital of Jinan, 250200, Shandong, China.
3. Department of Clinical Laboratory, Shandong Provincial Qianfoshan Hospital, the First Hospital Affiliated with Shandong First Medical University, Jinan 250014, China.
Abstract
Background: DNA methylation acts as a key component in epigenetic modifications of genomic function and functions as disease-specific prognostic biomarkers for lung squamous cell carcinoma (LUSC). This present study aimed to identify methylation-driven genes as prognostic biomarkers for LUSC using bioinformatics analysis.
Materials and Methods: Differentially expressed RNAs were obtained using the edge R package from 502 LUSC tissues and 49 adjacent non-LUSC tissues. Differentially methylated genes were obtained using the limma R package from 504 LUSC tissues and 69 adjacent non-LUSC tissues. The methylation-driven genes were obtained using the MethylMix R package from 500 LUSC tissues with matched DNA methylation data and gene expression data and 69 non-LUSC tissues with DNA methylation data. Gene ontology and ConsensusPathDB pathway analysis were performed to analyze the functional enrichment of methylation-driven genes. Univariate and multivariate Cox regression analyses were performed to identify the independent effect of differentially methylated genes for predicting the prognosis of LUSC.
Results: A total of 44 methylation-driven genes were obtained. Univariate and multivariate Cox regression analyses showed that twelve aberrant methylated genes (ATP6V0CP3, AGGF1P3, RP11-264L1.4, HIST1H4K, LINC01158, CH17-140K24.1, CTC-523E23.14, ADCYAP1, COX11P1, TRIM58, FOXD4L6, CBLN1) were entered into a Cox predictive model associated with overall survival in LUSC patients. Methylation and gene expression combined survival analysis showed that the survival rate of hypermethylation and low-expression of DQX1 and WDR61 were low. The expression of DQX1 had a significantly negatively correlated with the methylation site cg02034222.
Conclusion: Methylation-driven genes DQX1 and WDR61 might be potential biomarkers for predicting the prognosis of LUSC.
Keywords: Lung squamous cell carcinoma, Methylation-driven genes, Biomarkers, A Cox predictive model, Overall survival
Introduction
Lung cancer is the leading cause of cancer related deaths worldwide [1]. Lung squamous cell carcinoma (LUSC) accounts for about 30% of all lung cancers with the highest mortality in the world [2]. LUSC accounts for approximately more than 400,000 deaths worldwide each year [3]. The five year survival rate of lung squamous cell carcinoma is less than 15% [4]. Due to the limitation of treatment and poor survival rate for lung squamous cell carcinoma [5], it is imperative that we explore specific diagnostic and prognostic biomarkers for LUSC. In the present study, we aimed to identify novel specific diagnostic and prognostic biomarkers for predicting survival in LUSC.
Genetic aberrant expression is important for the etiology of human cancer and the combined effect of genetic and epigenetic changes contribute to the progress of human cancer [6-10]. DNA methylation is one of the most important elements in epigenetic modifications and participates in the regulation of cellular functions and carcinogenesis [11]. Epigenetic modification, especially DNA methylation, plays a significant role in predicting the prognosis of lung cancer [12-15]. For instance, the identification of eight DNA methylation biomarkers using high-throughput DNA methylation analysis can predict the prognosis of lung squamous cell carcinoma [16]. Aberrant ANK1 methylation contributes to miR-486-5p repression and discriminates lung tumors by histology and smoking status [17]. Pharmacologic inhibition of DNA methylation combined with gene expression reveals new specific diagnostic and prognostic biomarkers in lung squamous cell carcinoma [18].
MethylMix is an R package used for identifying disease-specific hyper- and hypo-methylated genes [19]. More precisely, MethylMix includes two major characteristics: automatic download of DNA methylation and gene expression data sets from TCGA and automated pre-processing of such data sets: value interpolation, batch correction, and CpG positions within each gene point clustering. Currently, few studies based on using MethylMix R package to identify specific methylation-driven genes have been reported [20-22]. Recently, a study based on MethylMix reveals potential prognostic methylation-driven genes for predicting the prognosis in lung adenocarcinoma (LUAD) has been reported [23]. In the present study, we extracted the DNA methylation and RNA-Seq data using bioinformatics methods from The Cancer Genome Atlas (TCGA) database, and then the MethylMix R package was performed to obtain methylation-driven genes. Furthermore, a Cox predictive model was established to predict the diagnosis and prognosis of LUSC. Eventually, the joint of methylation and gene expression combined survival analysis was performed to reveal potential specific methylation-driven genes for predicting the prognosis of LUSC.
Materials and Methods
Data extraction and analysis
RNA-Seq data and methylation data were downloaded from the Cancer Genome Atlas (TCGA) database. The methylation data consists of 504 LUSC samples and 69 normal samples from the Illumina Infinium Human Methylation 450k platform. The RNA-Seq data (level 3) incorporating lncRNA and mRNA expression was obtained from 502 LUSC samples and 49 normal samples from the IlluminaHiSeq_RNASeq platform. First, based on the limma R package, we retrieved the aberrant methylated genes with the screening criteria absolute fold change (log2) > 0 and adjusting the false discovery rate (FDR) to a P value < 0.05. Then, we obtained the differentially expressed lncRNA and mRNA using the edge R package in R software with the absolute fold change (log2) > 0 and adjusted the FDR to a P value < 0.05. Next, we used the MethylMix R package with the screening criteria (|logFC|>0, P<0.05, Cor<-0.3) to extract the methylation-driven genes. Analysis of average methylation differences at 3000 bp (base pair) sites upstream of genes to identify differential methylation levels in gene promoters [23-25]. The differential level of methylation in the promoter of genes was performed by using the limma R package [26]. Eventually, we identified methylation-driven genes and aberrant methylated genes to establish a β-mixture model. The data was directly from the TCGA database. No approval was required from the local ethics committee.
Enrichment analysis of methylation-driven genes in LUSC
We used the Database for Annotation, Visualization and Integrated Discovery (DAVID) (http://david.abcc.ncifcrf.gov/) database to analyze the biological function in methylation-driven genes by using Gene ontology and ConsensusPathDB pathway analysis. In the GO analysis, a P value was less than 0.05 was considered as statistically significance. We used the GOCircle and GOChord plotting to explore the relationship between the methylation-driven genes and their biological function. ConsensusPathDB (http://cpdb.molgen.mpg.de/) is an online software incorporating gene regulatory, drug-target interactions and binary complex signaling. In the ConsensusPathDB pathway analysis, P < 0.05 was considered as statistically significance.
Establishment of predictive model of differentially methylated genes based on DNA methylation in LUSC
First, we obtained the expression of differentially methylated genes and retrieved the survival time and survival status of 366 LUSC patients, then used the survival.pl script to extract the data that combined the expression of differentially methylated genes and survival data. Next, we used the univariate R package to obtain the result of univariate Cox regression. We selected 92 aberrant methylated genes to submit to multivariate Cox regression analysis with the screening criteria P < 0.05. Based on the median risk score, LUSC patients were divided into two groups, incorporating high-risk groups and low-risk groups. To test the influence on differentially methylated genes signature (high risk vs low risk) on overall survival, we performed the receiver operating characteristic (ROC) curves to calculate the area under the curve (AUC) to reveal prognostic specific biomarkers for predicting survival in LUSC.
Univariate and multivariate Cox regression independent prognosis analysis of patients of LUSC
In order to further explore the twelve gene signature that can be used as independent prognosis factor, we performed the univariate and multivariate Cox regression independent prognosis analysis of LUSC patients. We extracted 276 LUSC patients with complete clinical information and combined the twelve genes signature risk score of 276 LUSC patients and the expression data of twelve genes of 276 LUSC patients to perform the univariate and multivariate Cox regression independent prognosis analysis. P < 0.05 was considered as statistically significant.
Methylation and gene expression combined survival analysis in LUSC
We used the methylation and gene expression combined survival analysis to further explore the effect of methylation-driven genes on patient prognosis in terms of expression and methylation levels. We performed the joint of methylation and gene expression combined survival analysis to identify potential methylation-driven genes for predicting the prognosis of LUSC patients. Therefore, we performed the Kaplan-Meier curve analysis. P < 0.05 was considered as statistically significant.
Correlation analysis between site methylation and gene expression in LUSC
In order to further explore the relationship between the methylation-driven genes expression and their methylation sites, we used the R package and Perl Package to perform the correlation analysis. First, site methylation data for methylation-driven genes associated with overall survival extracted from the TCGA database using the Perl package, then, we merged site methylation with gene expression data. Finally, we used the R package to figure out the correlation between site methylation and methylation-driven genes expression.
Survival analysis of methylation site in LUSC patients
In order to further explore the survival rate of methylation site cg02034222 in DQX1 in LUSC patients, we performed the Kaplan-Meier curve analysis of methylation site cg02034222 in DQX1 in LUSC patients. P value less than 0.05 was considered as statistically significant.
Results
Identification of methylation-driven genes in LUSC
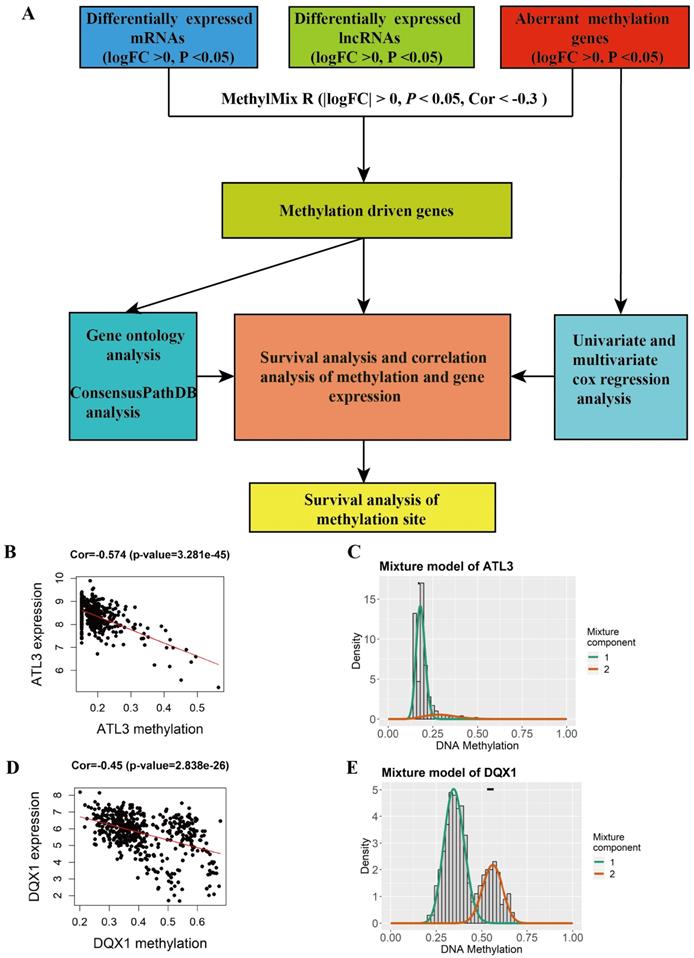
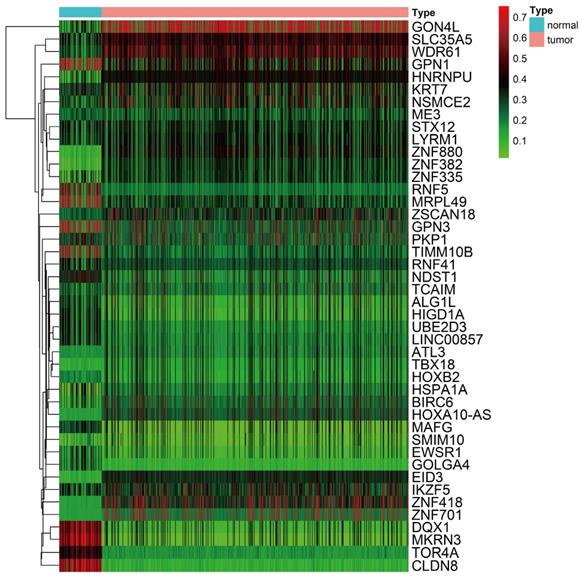
A total of 44 methylation-driven genes were identified to be connected with DNA methylation using the MethylMix R package. The methylation-driven genes incorporating 42 methylation-driven mRNAs and two methylation-driven lncRNAs were shown in Table 1. Figure 1B and 1D shows methylation-driven gene ATL3 and DQX1 have significant negative correlation in methylation and gene expression level. The distribution of the methylation degree shows that ATL3 is hyper-methylated in LUSC patients and hypo-methylated in normal patients (Figure 1C). The distribution of the methylation degree shows that DQX1 is hyper-methylated in non-LUSC patients and hypo-methylated in LUSC patients (Figure 1E). A flow diagram of methylation-driven genes is shown in Figure 1A. A heat-map of methylation driven genes mRNAs and lncRNAs is shown in Figure 2.
Functional enrichment analysis of methylation-driven genes in LUSC
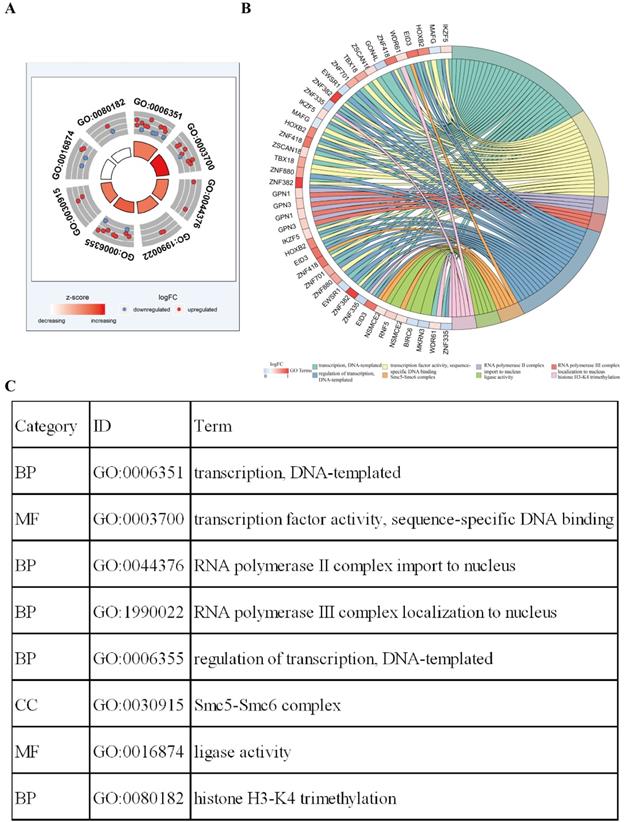
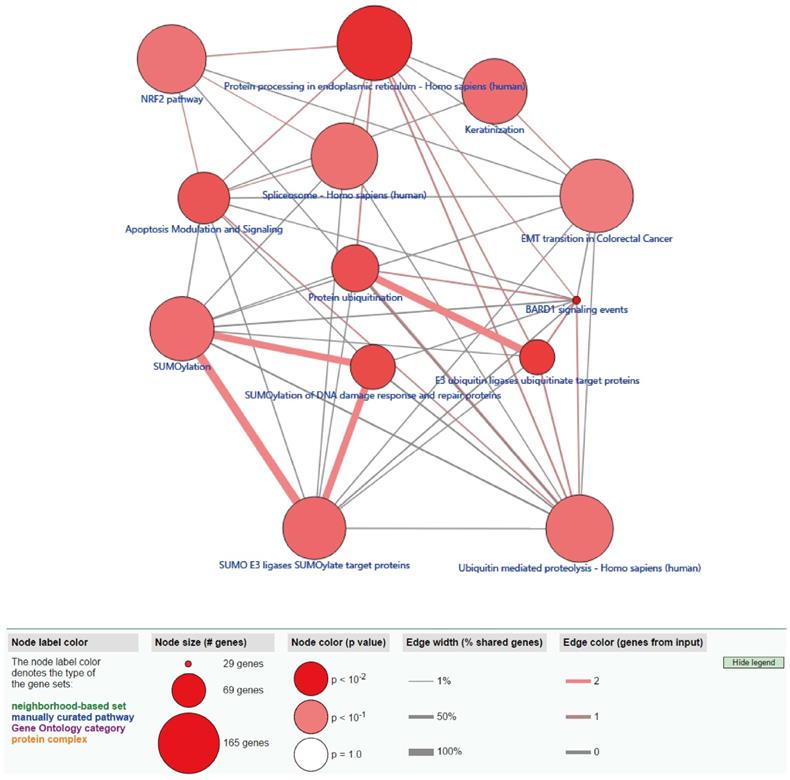
Functional enrichment analysis shows that eight GO terms (transcription, DNA-templated; transcription factor activity, sequence-specific DNA binding; RNA polymerase II complex import to nucleus; RNA polymerase III complex localization to nucleus; regulation of transcription, DNA-templated; Smc5-Smc6 complex; ligase activity; histone H3-K4 tri-methylation) with statistical significance (P < 0.05). The highest GO term was biological process “GO0006351 transcription, DNA templated” (Figure 3A and 3C). Figure 3B shows the all methylation-driven mRNAs with their related eight GO terms. Figure 4 shows that 13 pathways (BARD1 signaling events; Protein processing in endoplasmic reticulum - Homo sapiens (human); E3 ubiquitin ligases ubiquitinate target proteins; SUMOylation of DNA damage response and repair proteins; Protein ubiquitination; Apoptosis Modulation and Signaling; SUMO E3 ligases SUMOylate target proteins; SUMOylation; Keratinization; Spliceosome - Homo sapiens (human); Ubiquitin mediated proteolysis - Homo sapiens (human); NRF2 pathway; EMT transition in Colorectal Cancer) were considered statistically significant (P < 0.05). As we can see from the Figure 4, the methylation-driven genes were most enriched in BARD1 signaling events, Protein processing in endoplasmic reticulum - Homo sapiens (human) and E3 ubiquitin ligases ubiquitinate target proteins (P<0.01).
The pathway analysis is shown in Table 2.
Identification of methylation and gene expression most relevant genes between LUSC and normal tissue. A The flow diagram of identification of methylation driven genes in LUSC. B, D The correlation between methylation and gene expression in methylation driven genes. C, E The methylation degree of the methylation-driven genes between LUSC and normal tissue. The red curve indicates the methylation degree from the LUSC tissue, the green curve indicates the methylation degree from the normal tissue. The black line above the figure is the distribution of methylation level in normal tissue.
Methylation-driven mRNAs and lncRNAs in LUSC
| Gene | Normal Mean | Tumor Mean | logFC | P-Value | Adjusted-P | cor | Cor P-Value |
|---|---|---|---|---|---|---|---|
| ATL3 | 0.17248799 | 0.19693593 | 0.19123 | 2.67E-05 | 0.001522 | -0.5742885 | 3.28E-45 |
| EID3 | 0.11947906 | 0.22283156 | 0.899196 | 1.50E-06 | 8.54E-05 | -0.557997212 | 2.91E-42 |
| HSPA1A | 0.17681654 | 0.17435814 | -0.0202 | 0.000498 | 0.028362 | -0.546760366 | 2.54E-40 |
| KRT7 | 0.32703655 | 0.40270931 | 0.300287 | 5.94E-08 | 3.39E-06 | -0.535706329 | 1.75E-38 |
| ALG1L | 0.26423898 | 0.14912111 | -0.82536 | 2.11E-20 | 1.20E-18 | -0.522826399 | 2.01E-36 |
| HOXB2 | 0.19379899 | 0.32946771 | 0.765576 | 2.62E-07 | 1.49E-05 | -0.49642396 | 1.81E-32 |
| ZNF701 | 0.1511366 | 0.21621834 | 0.516636 | 2.00E-19 | 1.14E-17 | -0.495379361 | 2.55E-32 |
| SMIM10 | 0.11304237 | 0.20223432 | 0.839164 | 1.07E-05 | 0.000613 | -0.453929124 | 8.73E-27 |
| DQX1 | 0.5466067 | 0.41245817 | -0.40626 | 1.12E-17 | 6.41E-16 | -0.449792303 | 2.84E-26 |
| ZNF382 | 0.09030249 | 0.20544586 | 1.18592 | 1.78E-15 | 1.01E-13 | -0.449122352 | 3.43E-26 |
| MKRN3 | 0.59970621 | 0.46968784 | -0.35255 | 4.32E-12 | 2.46E-10 | -0.440157315 | 4.15E-25 |
| RNF41 | 0.3089854 | 0.3720367 | 0.267906 | 3.83E-08 | 2.18E-06 | -0.426198823 | 1.75E-23 |
| TBX18 | 0.12078327 | 0.17927841 | 0.569781 | 1.55E-07 | 8.83E-06 | -0.413942368 | 4.04E-22 |
| MRPL49 | 0.4402478 | 0.53150492 | 0.271767 | 1.10E-07 | 6.27E-06 | -0.409474247 | 1.23E-21 |
| HIGD1A | 0.28409562 | 0.35668444 | 0.328272 | 4.55E-10 | 2.59E-08 | -0.407902793 | 1.81E-21 |
| ZNF418 | 0.14960837 | 0.27538919 | 0.880281 | 2.27E-20 | 1.29E-18 | -0.403101005 | 5.86E-21 |
| EWSR1 | 0.23855847 | 0.19310873 | -0.30493 | 1.42E-07 | 8.07E-06 | -0.402188496 | 7.30E-21 |
| GOLGA4 | 0.23063898 | 0.20194077 | -0.1917 | 0.000172 | 0.009832 | -0.396381517 | 2.93E-20 |
| ZSCAN18 | 0.24775191 | 0.29098815 | 0.232064 | 5.04E-08 | 2.87E-06 | -0.39602996 | 3.18E-20 |
| ME3 | 0.24575626 | 0.31586615 | 0.362085 | 8.19E-12 | 4.67E-10 | -0.390298349 | 1.22E-19 |
| TOR4A | 0.43481132 | 0.50342309 | 0.211382 | 1.19E-12 | 6.78E-11 | -0.386093997 | 3.20E-19 |
| ZNF335 | 0.17544474 | 0.13484788 | -0.37968 | 2.95E-05 | 0.001681 | -0.385838776 | 3.39E-19 |
| GON4L | 0.24833952 | 0.18937769 | -0.39105 | 1.24E-13 | 7.09E-12 | -0.378884895 | 1.63E-18 |
| GPN1 | 0.44840968 | 0.53171848 | 0.245845 | 0.000366 | 0.020889 | -0.3688374 | 1.47E-17 |
| NDST1 | 0.37244227 | 0.39375627 | 0.080286 | 3.03E-05 | 0.001725 | -0.367888744 | 1.80E-17 |
| LYRM1 | 0.26940325 | 0.33139827 | 0.298799 | 1.71E-10 | 9.73E-09 | -0.363619695 | 4.48E-17 |
| ZNF880 | 0.10955173 | 0.16412283 | 0.583164 | 3.15E-08 | 1.80E-06 | -0.358551732 | 1.29E-16 |
| HNRNPU | 0.18185654 | 0.14481692 | -0.32857 | 3.32E-08 | 1.89E-06 | -0.355947775 | 2.22E-16 |
| PKP1 | 0.33730017 | 0.28220385 | -0.2573 | 1.19E-09 | 6.79E-08 | -0.355519119 | 2.42E-16 |
| CLDN8 | 0.59729707 | 0.5081929 | -0.23307 | 1.40E-07 | 7.95E-06 | -0.353071085 | 3.99E-16 |
| GPN3 | 0.44053766 | 0.54189041 | 0.298736 | 1.93E-10 | 1.10E-08 | -0.351039605 | 6.03E-16 |
| STX12 | 0.29864643 | 0.38069839 | 0.35021 | 1.20E-10 | 6.82E-09 | -0.350277807 | 7.03E-16 |
| MAFG | 0.30194995 | 0.26400157 | -0.19376 | 4.30E-06 | 0.000245 | -0.347374761 | 1.26E-15 |
| BIRC6 | 0.18005362 | 0.14959829 | -0.26733 | 0.000359 | 0.020475 | -0.343441891 | 2.74E-15 |
| NSMCE2 | 0.25383424 | 0.28660713 | 0.175188 | 0.00031 | 0.017663 | -0.342286449 | 3.44E-15 |
| IKZF5 | 0.27924672 | 0.32474861 | 0.217783 | 6.03E-05 | 0.00344 | -0.336552652 | 1.05E-14 |
| TIMM10B | 0.41801039 | 0.51747519 | 0.307951 | 8.21E-10 | 4.68E-08 | -0.33036822 | 3.38E-14 |
| SLC35A5 | 0.30500029 | 0.36714383 | 0.267535 | 2.83E-08 | 1.61E-06 | -0.326827649 | 6.55E-14 |
| WDR61 | 0.25539793 | 0.29489636 | 0.207461 | 1.50E-06 | 8.55E-05 | -0.326478841 | 6.98E-14 |
| TCAIM | 0.23709962 | 0.29466613 | 0.313588 | 1.15E-10 | 6.54E-09 | -0.323459542 | 1.22E-13 |
| RNF5 | 0.39135838 | 0.48335106 | 0.304581 | 1.75E-09 | 9.96E-08 | -0.31250345 | 8.67E-13 |
| UBE2D3 | 0.29164547 | 0.34557935 | 0.244801 | 2.00E-06 | 0.000114 | -0.309087728 | 1.57E-12 |
| HOXA10-AS | 0.14920717 | 0.24212565 | 0.698439 | 2.43E-13 | 9.74E-13 | -0.343245543 | 2.85E-15 |
| LINC00857 | 0.28641727 | 0.34963067 | 0.287713 | 0.0046 | 0.018401 | -0.512263266 | 8.45E-35 |
Pathway analysis
| Pathway | count | P-value | q-value |
|---|---|---|---|
| BARD1 signaling events | 2 | 0.00166 | 0.05648 |
| Protein processing in endoplasmic reticulum - Homo sapiens (human) | 3 | 0.00483 | 0.07633 |
| E3 ubiquitin ligases ubiquitinate target proteins | 2 | 0.00674 | 0.07633 |
| SUMOylation of DNA damage response and repair proteins | 2 | 0.01098 | 0.08233 |
| Protein ubiquitination | 2 | 0.01211 | 0.08233 |
| Apoptosis Modulation and Signaling | 2 | 0.01547 | 0.08766 |
| SUMO E3 ligases SUMOylate target proteins | 2 | 0.02599 | 0.10038 |
| SUMOylation | 2 | 0.02844 | 0.10038 |
| Keratinization | 2 | 0.02928 | 0.10038 |
| Spliceosome - Homo sapiens (human) | 2 | 0.03186 | 0.10038 |
| Ubiquitin mediated proteolysis - Homo sapiens (human) | 2 | 0.03318 | 0.10038 |
| NRF2 pathway | 2 | 0.03543 | 0.10038 |
| EMT transition in Colorectal Cancer | 2 | 0.04399 | 0.11506 |
Establishment of predictive model of 12 differentially methylated genes associated with overall survival in LUSC
Univariate Cox regression analysis was first used to identify differentially methylated genes associated with overall survival in LUSC; incorporating 92 differentially methylated genes were selected to submit to perform multivariate Cox regression analysis. (P < 0.05) Multivariate Cox regression analysis shows that 12 differentially methylated genes were finally selected to establish a predictive model. The linear combination of the expression of 12 aberrant methylated genes was performed to establish the predictive model. The relative coefficients weighted in the multivariate Cox regression are as follows: survival risk score = ((-1.7055) × expression value of ATP6V0CP3 + (-2.4550) × expression value of AGGF1P3 + (-2.0585) × expression value of RP11-264L1.4 + 3.1730 × expression value of HIST1H4K + 4.3379 × expression value of LINC01158 + 1.2379 × expression value of CH17-140K24.1 + (-2.3096) × expression value of CTC-523E23.14 + (-3.5519) × expression value of ADCYAP1 + (-1.1394) × expression value of COX11P1 + (-2.0323) ×expression value of TRIM58 + (-1.8202) × expression value of FOXD4L6 + 3.9318 × expression value of CBLN1). The multivariate Cox regression analysis is shown in Table 3.
Multivariate Cox regression analysis of 12 genes associated with overall survival in LUSC patients
| coef | exp(coef) | se(coef) | z | p | |
|---|---|---|---|---|---|
| ATP6V0CP3 | -1.7055 | 0.1817 | 1.06 | -1.61 | 0.108 |
| AGGF1P3 | -2.455 | 0.0859 | 1.586 | -1.55 | 0.122 |
| RP11-264L1.4 | -2.0585 | 0.1276 | 1.034 | -1.99 | 0.046 |
| HIST1H4K | 3.173 | 23.8791 | 1.1964 | 2.65 | 0.008 |
| LINC01158 | 4.3379 | 76.5481 | 2.1068 | 2.06 | 0.039 |
| CH17-140K24.1 | 1.2379 | 3.4482 | 0.8287 | 1.49 | 0.135 |
| CTC-523E23.14 | -2.3096 | 0.0993 | 1.1061 | -2.09 | 0.037 |
| ADCYAP1 | -3.5519 | 0.0287 | 1.6107 | -2.21 | 0.027 |
| COX11P1 | -1.1394 | 0.32 | 0.7318 | -1.56 | 0.119 |
| TRIM58 | -2.0323 | 0.131 | 0.9696 | -2.1 | 0.036 |
| FOXD4L6 | -1.8202 | 0.162 | 0.8431 | -2.16 | 0.031 |
| CBLN1 | 3.9318 | 51.0005 | 1.9069 | 2.06 | 0.039 |
ROC curve analysis and risk groupings
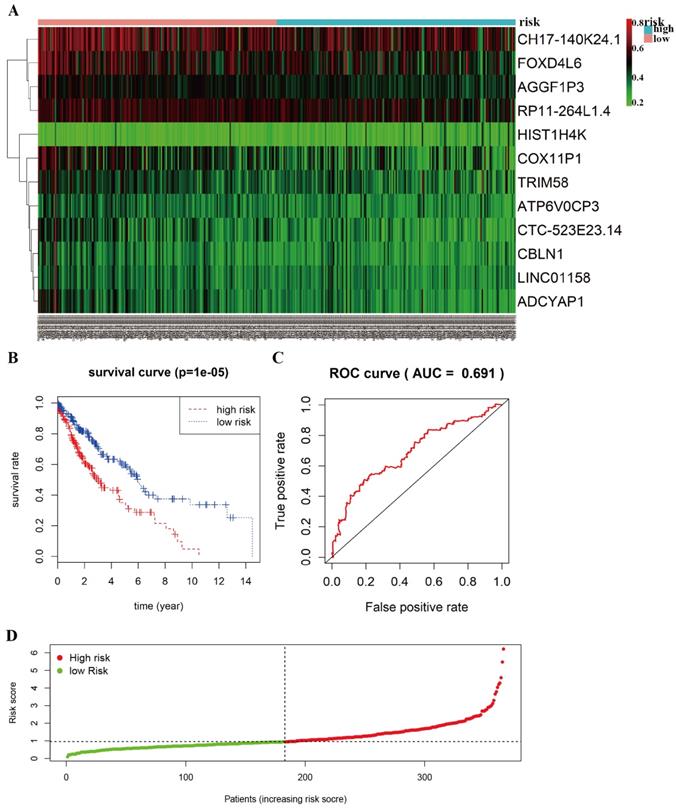
The heat-map shows that 12 differentially methylated genes (ATP6V0CP3, AGGF1P3, RP11-264L1.4, HIST1H4K, LINC01158, CH17-140K24.1, CTC-523E23.14, ADCYAP1, COX11P1, TRIM58, FOXD4L6, CBLN1) were divided into two groups based on the median risk scores (Figure 5A). A total of 366 patients with complete survival information were divided into a high-risk group (n=183) and a low-risk group (n=183). The Kaplan-Meier curve with a Log-rank statistical examination was used to perform survival analysis (Figure 5B). As shown in Figure 5B, patients in the high-risk group had significantly poor survival rate than in the low-risk group (P =1e-05). Receiver operating characteristic (ROC) curve was performed to identify the effect of 12 aberrant methylated genes signature associated with overall survival in LUSC (Figure 5C). The graph of the risk score between high risk group and low risk group in the Cox model is shown in Figure 5D.
Heat map of methylation-driven genes between LUSC and normal tissue. Red represents highly methylated genes and green represents low methylated genes between LUSC and normal tissue.
Functional enrichment analysis of methylation-driven genes in LUSC. A The outer circle represents the expression of methylation driven mRNAs in each enriched GO terms: red dots which were on each GO terms indicated the up-regulated methylation driven mRNAs, the inner circle indicates the significance of GO terms (log10-adjusted P values). Blue dots indicate the down-regulated methylation driven mRNAs. B The circle represents the correlation between 42 methylation driven mRNAs and their GO terms. C The distribution of methylation driven mRNAs in significant GO terms.
Univariate and multivariate Cox regression analysis for the various DNA methylation classifiers of patients with LUSC
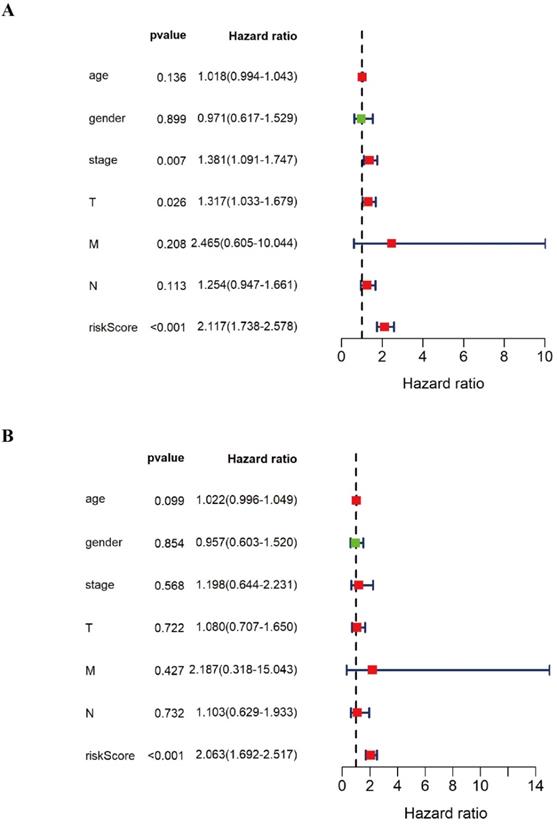
In order to further verify the twelve gene signature is an independent prognosis factor, we used the univariate and multivariate Cox regression analysis. We extracted the complete LUSC clinical features with 276 samples and then combined the twelve gene expression data and the prognostic risk score with the LUSC clinical features, including LUSC age, gender, pathology stage, pathology T stage, pathology M stage, pathology N stage to perform the univariate and multivariate Cox regression analysis. The forest plot of univariate and multivariate Cox regression analysis was showed in Figure 6. Univariate Cox regression analysis showed that pathology stage, pathology T stage and twelve gene signature risk score can act as independent prognostic factor (Figure 6A). Multivariate Cox regression analysis showed that twelve gene signature is an independent prognosis factor (Figure 6B) (Table 4).
ConsensusPathDB pathway analysis of methylation-driven genes in LUSC. The red circles indicate the number of methylation driven genes on each pathway. The line between the two red circles indicates the ratio of methylation driven genes present in the common genes of the two pathways.
Methylation and gene expression combined survival analysis in LUSC
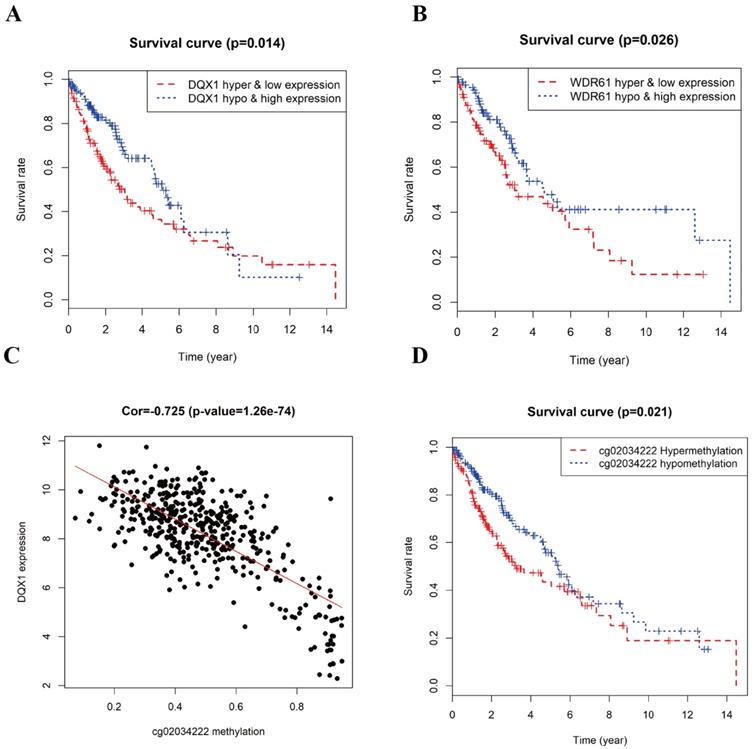
The combined survival analysis revealed that the joint of methylation and gene expression of the genes (DQX1, WDR61) had significant correlation with the prognosis of LUSC patients (Figure 7A and 7B). As shown in Figure 6, the hypermethylation and low-expression survival rate of DQX1 and WDR61 were low. The joint of methylation and gene expression survival analysis shows that the DNA methylation and gene expression of DQX1 and WDR61 were associated with overall survival in LUSC patients (P < 0.05). We used the median to define the DNA methylation cut-off to classify a sample as hypermethylated or hypomethylated about the survival rate based on DQX1 and WDR61 data.
Univariate and multivariate Cox regression analysis of LUSC clinical characteristics based on predictive model
| Variables | Univariate analysis | Multivariate analysis | ||
|---|---|---|---|---|
| Hazards ratio (95% CI) | P value | Hazards ratio (95% CI) | P value | |
| Age | 1.018 (0.994-1.043) | 0.136 | 1.022 (0.996-1.049) | 0.099 |
| Gender | 0.971 (0.617-1.529) | 0.899 | 0.957 (0.603-1.520) | 0.854 |
| Stage | 1.381 (1.091-1.747) | 0.007 | 1.198 (0.644-2.231) | 0.568 |
| T | 1.317 (1.033-1.679) | 0.026 | 1.080 (0.707-1.650) | 0.722 |
| M | 2.465 (0.605-10.044) | 0.208 | 2.187 (0.318-15.043) | 0.427 |
| N | 1.254 (0.947-1.661) | 0.113 | 1.103 (0.629-1.933) | 0.732 |
| riskScore | 2.117 (1.738-2.578) | <0.001 | 2.063 (1.692-2.517) | <0.001 |
Prognostic value of 12-differentially methylated genes based on DNA methylation in LUSC. A Risk heat-map predictive model established from 12 differentially methylated genes from 366 LUSC patients. B Kaplan-Meier curve analysis of 12 differentially methylated genes for overall survival of LUSC patients. C ROC curve analysis of prognostic 12 differentially methylated genes signature. D The riskscore in the Cox model between high risk group and low risk group of LUSC.
Correlation analysis between gene expression and methylation sites
To figure out the relationship between the DNA methylation and gene expression level in DQX1 and WDR61, we used the Perl package to obtain the methylation sites in DQX1 and WDR61, the expression of DQX1 had 8 methylation sites in TCGA database, while only one methylation site had significant correlation between expression and DNA methylation level. The expression of WDR61 had two methylation sites in TCGA database, while no methylation site had significant correlation with the expression of WDR61. As is shown in Figure 7C, the expression of DQX1 had a significant correlation (Cor = -0.725) with cg02034222 methylation (P = 1.26e-74).
Survival analysis of methylation site cg02034222 in DQX1 in LUSC patients
In order to further figure out whether the one methylation site (cg02034222) in DQX1 is responsible of the survival rate of LUSC patients, we performed survival analysis of methylation site (cg02034222) in DQX1 in hypermethylation and hypomethylation LUSC patients (Figure 7D). The one CpG site cg02034222 in DQX1 in hypermethylation LUSC patients had a poor survival rate than the one CpG site cg02034222 in DQX1 in hypomethylation LUSC patients (P = 0.021).
The forest plot of univariate and multivariate Cox regression analysis of the various DNA methylation classifiers of LUSC patients. A The forest plot of univariate Cox regression independent prognosis analysis of LUSC patients. B The forest plot of multivariate Cox regression independent prognosis analysis of LUSC patients. The red mark in the plot indicates that this clinical feature is a high risk factor. The green mark in the plot indicates that this clinical feature is a low risk factor.
Discussion
In recent years, with the increasing numbers of advanced diagnosis and poor prognosis in lung squamous cell carcinoma, it is crucial to explore more effective diagnostic and prognostic biomarkers for predicting survival in LUSC. Genetic and epigenetic changes facilitate the progression of LUSC. DNA methylation and RNA-Seq data analysis provide a novel perspective to reveal disease specific diagnostic and prognostic biomarkers in human lung cancer [27,28]. The rapid development of RNA-Seq analysis technologies provides a novel perspective to explore the molecular characteristic and pathogenesis of LUSC and provides significant evidence for predicting the prognosis of LUSC. Emerging evidences shows that the studies on the molecular mechanism of LUSC and the prognostic biomarkers of the LUSC associated with methylation driven genes is still lacking. In our study, we used the MethylMix R package to identify methylation driven genes and a cox predictive model was established to predict the prognosis of LUSC and the joint of methylation and gene expression combined survival analysis reveals potential prognostic biomarkers for predicting the prognosis of LUSC.
Survival analysis and correlation analysis of methylation and gene expression and survival analysis of methylation site of LUSC. A, B Kaplan-Meier curve analysis of the joint of DNA methylation and gene expression in LUSC patients. C The correlation analysis between the expression of DQX1 and cg02034222 methylation in LUSC patients. D Kaplan-Meier curve analysis of methylation site cg02034222 in DQX1 in LUSC patients.
Epigenetics modification, especially DNA methylation, participates in the pathogenesis of LUSC. Accumulating evidences have demonstrated that DNA methylation acts as the major molecular mechanism of epigenetic modification was associated with the human malignant cancer, incorporating lung cancer [29-31]. The joint of gene and DNA methylation using bioinformatics analysis revealing new diagnostic and prognostic biomarkers for predicting the prognosis of cancer [32-34]. Therefore, it is pivotal to identify disease-specific prognostics biomarkers to determine the exploration of the molecular mechanism of LUSC. The methylation of L1RE1, RARB, and RASSF1 acts as potential disease specific biomarkers for predicting the prognosis of lung cancer [35]. TRIM58/cg26157385 methylation associated with eight genes including A2ML1, CCNE1, COBL, ESCO2, GPR115, MMP10, OVOL1 and SCGB1A1 in lung squamous cell carcinoma [36]. The prognostic value of HOXA9 promoter methylation was associated with lung cancer and can become a new diagnostic and prognostic biomarker for predicting the prognosis of stage I lung adenocarcinoma [37]. Therefore, bioinformatics analysis of DNA methylation and gene expression provide a significant horizon for identifying disease specific diagnostic and prognostic biomarkers in lung squamous cell carcinoma.
Functional enrichment analysis of methylation-driven mRNA reveals the methylation-driven genes might be mostly associated with the biologic function of transcription, DNA template; transcription factor activity; RNA polymerase II complex import to nucleus (P < 0.05). The pathway analysis shows that the methylation-driven genes were associated with 13 pathways (P < 0.05); the most enriched pathway was the Protein processing in endoplasmic reticulum-Homo sapiens (human).
In our study, univariate and multivariate Cox regression analysis shows that ATP6V0CP3, AGGF1P3, RP11-264L1.4, HIST1H4K, LINC01158, CH17-140K24.1, CTC-523E23.14, ADCYAP1, COX11P1, TRIM58, FOXD4L6, CBLN1 were associated with overall survival and could establish a survival predictive model to predict the prognosis of LUSC. The 12 differentially methylated genes could also act as an independent prognostic factor for predicting the prognosis of LUSC. HIST1H4K can be used as prognostic factors for predicting the prognosis of cervical cancer patients [38]. HIST1H4K can be used as DNA methylation biomarkers for predicting the prognosis of prostate cancer [39]. ADCYAP1 can act as prognostic biomarkers to predict risk of endometrial cancer [40]. Recently a study based on TCGA database reveal ADCYAP1 can act as prognostic biomarkers for predicting the prognosis of LUSC [4]. ADCYAP1 can act as novel biomarkers for predicting the prognosis of cervical precancer and cancer [41]. TRIM58/cg26157385 methylation may play a significant role for predicting the prognosis of LUSC [36]. CBLN1 can be used as marker genes for predicting the prognosis of the Ventromedial Hypothalamic Nucleus [42].
In our study, the joint of methylation and gene expression combined survival analysis shows that the survival rate of hypermethylation and low-expression of DQX1 was significant lower than the survival rate of hypomethylation and high-expression of DQX1. Epigenome-wide association studies (EWASs) suggested a novel association between T2D and cg06721411(DQX1; P value=1.18×10(-9)) [43]. The survival rate of hypomethylation and high-expression of WDR61 was significant higher than the survival rate of hypermethylation and low-expression of WDR61. Furthermore, we performed the correlation analysis between DNA methylation sites and gene expression. The expression of DQX1 was significantly negatively associated with the methylation sites cg02034222 (P value= 1.26e-74), which might provide a significant horizon to explore prognostic biomarkers for predicting the diagnosis and prognosis of LUSC. Compared with previous studies[4], our study first obtained aberrant methylated genes using the limma R package, obtained differentially expressed genes using the edge R package and then we filtered the missing values and low expression genes and intersected gene expression data with DNA methylation data to input MethylMix R package to identify methylation driven genes, which may provide a novel perspective to reveal disease-specific prognostic biomarkers in LUSC and may play a significant role in predicting the diagnosis and prognosis of LUSC.
Conclusions
In our study, we aimed to identify methylation-driven genes using MethylMix between LUSC patients and normal samples from the TCGA database for predicting the prognosis of lung squamous cell carcinoma. Univariate and multivariate Cox regression analysis showed that the survival predictive model established by twelve differentially methylated genes (ATP6V0CP3, AGGF1P3, RP11-264L1.4, HIST1H4K, LINC01158, CH17-140K24.1, CTC-523E23.14, ADCYAP1, COX11P1, TRIM58, FOXD4L6, CBLN1) can act as independent prognostic factor for predicting the prognosis of LUSC. In addition, the DNA methylation and gene expression levels of DQX1 and WDR61 are significantly associated with overall survival and the expression of DQX1 has a significantly negatively correlated with the methylation site cg02034222. Our study may provide a novel perspective for predicting the prognosis of LUSC.
Abbreviations
AUC: area under the curve; DAVID: the database for annotation, visualization and integrated discovery; EWASs: epigenome-wide association studies; FC: fold change; FDR: false discovery rate; GO: gene ontology; LUSC: lung squamous cell carcinoma; ROC: receiver operating characteristic; TCGA: the cancer genome atlas.
Acknowledgements
We would like to thank 'TCGA Research Network' for generating, curating and providing high quality biological and clinical data.
Author Contributions
YQQ, YEY and RL designed the study; YHY, JJ collected the data; XL and MYZ analyzed the data; RL drafted the manuscript; YQQ and YEY revised the manuscript. All authors read and approved the final manuscript.
Ethics Committee Approval and Patient Consent
Consent for participation from all patients was obtained through The Cancer Genome Atlas Project.
Funding
This work was supported by grants from the Major Scientific and Technological Innovation Project of Shandong Province (2018CXGC1212), the Science and Technology Foundation of Shandong Province (2014GSF118084), the CSCO-Qilu Cancer Research Fund (Y-Q201802-014), the Medical and Health Technology Innovation Plan of Jinan City (201805002) and the National Natural Science Foundation of China (81372333).
Competing Interests
The authors have declared that no competing interest exists.
References
1. Hirsch FR, Scagliotti GV, Mulshine JL. et al. Lung cancer: current therapies and new targeted treatments. The Lancet. 2017;389:299-311
2. Correia LL, Johnson J-A, McErlean P. et al. SOX2 Drives Bronchial Dysplasia in a Novel Organotypic Model of Early Human Squamous Lung Cancer. Am J Respir Crit Care Med. 2017;195:1494-1508
3. Bray F, Ferlay J, Soerjomataram I. et al. Global cancer statistics 2018: GLOBOCAN estimates of incidence and mortality worldwide for 36 cancers in 185 countries. CA Cancer J Clin. 2018;68:394-424
4. Gao C, Zhuang J, Zhou C. et al. Prognostic value of aberrantly expressed methylation gene profiles in lung squamous cell carcinoma: A study based on The Cancer Genome Atlas. J Cell Physiol. 2019;234:6519-6528
5. Drilon A, Rekhtman N, Ladanyi M. et al. Squamous-cell carcinomas of the lung: emerging biology, controversies, and the promise of targeted therapy. The Lancet Oncology. 2012;13:e418-e426
6. Juergens RA, Wrangle J, Vendetti FP. et al. Combination Epigenetic Therapy Has Efficacy in Patients with Refractory Advanced Non-Small Cell Lung Cancer. Cancer Discov. 2011;1:598-607
7. Kelly AD, Issa J-PJ. The promise of epigenetic therapy: reprogramming the cancer epigenome. Curr Opin Genet Dev. 2017;42:68-77
8. Rahmani S, Abdollahi M. Novel treatment opportunities for sulfur mustard-related cancers: genetic and epigenetic perspectives. Arch Toxicol. 2017;91:3717-3735
9. Ronnekleiv-Kelly SM, Sharma A, Ahuja N. Epigenetic therapy and chemosensitization in solid malignancy. Cancer Treat Rev. 2017;55:200-208
10. Porcellini E, Laprovitera N, Riefolo M. et al. Epigenetic and epitranscriptomic changes in colorectal cancer: Diagnostic, prognostic, and treatment implications. Cancer Lett. 2018;419:84-95
11. Cai Y, Tsai H-C, Yen R-WC. et al. Critical threshold levels of DNA methyltransferase 1 are required to maintain DNA methylation across the genome in human cancer cells. Genome Res. 2017;27:533-544
12. Kettunen E, Hernandez-Vargas H, Cros M-P. et al. Asbestos-associated genome-wide DNA methylation changes in lung cancer. Int J Cancer. 2017;141:2014-2029
13. Grasse S, Lienhard M, Frese S. et al. Epigenomic profiling of non-small cell lung cancer xenografts uncover LRP12 DNA methylation as predictive biomarker for carboplatin resistance. Genome Med. 2018;10:55
14. Altenberger C, Heller G, Ziegler B. et al. SPAG6 and L1TD1 are transcriptionally regulated by DNA methylation in non-small cell lung cancers. Mol Cancer. 2017;16:1
15. Nikolaidis G, Raji OY, Markopoulou S. et al. DNA Methylation Biomarkers Offer Improved Diagnostic Efficiency in Lung Cancer. Cancer Res. 2012;72:5692-5701
16. Anglim PP, Galler JS, Koss MN. et al. Identification of a panel of sensitive and specific DNA methylation markers for squamous cell lung cancer. Mol Cancer. 2008;7:62
17. Tessema M, Yingling CM, Picchi MA. et al. ANK1 Methylation regulates expression of MicroRNA-486-5p and discriminates lung tumors by histology and smoking status. Cancer Lett. 2017;410:191-200
18. Zhong S, Fields CR, Su N. et al. Pharmacologic inhibition of epigenetic modifications, coupled with gene expression profiling, reveals novel targets of aberrant DNA methylation and histone deacetylation in lung cancer. Oncogene. 2006;26:2621-2634
19. Cedoz P-L, Prunello M, Brennan K. et al. MethylMix 2.0: an R package for identifying DNA methylation genes. Bioinformatics. 2018;34:3044-3046
20. Sanford T, Meng MV, Railkar R. et al. Integrative analysis of the epigenetic basis of muscle-invasive urothelial carcinoma. Clin Epigenetics. 2018;10:19
21. Gevaert O, Tibshirani R, Plevritis SK. Pancancer analysis of DNA methylation-driven genes using MethylMix. Genome Biol. 2015;16:17
22. Li Gx, Ding Zy, Wang Yw. et al. Integrative analysis of DNA methylation and gene expression identify a six epigenetic driver signature for predicting prognosis in hepatocellular carcinoma. J Cell Physiol. 2019;234:11942-11950
23. Gao C, Zhuang J, Li H. et al. Exploration of methylation-driven genes for monitoring and prognosis of patients with lung adenocarcinoma. Cancer Cell Int. 2018;18:194
24. Lu T, Chen D, Wang Y. et al. Identification of DNA methylation-driven genes in esophageal squamous cell carcinoma: a study based on The Cancer Genome Atlas. Cancer Cell Int. 2019;19:52
25. Huang C, Cintra M, Brennan K. et al. Development and validation of radiomic signatures of head and neck squamous cell carcinoma molecular features and subtypes. EBioMedicine. 2019;45:70-80
26. Ritchie ME, Phipson B, Wu D. et al. limma powers differential expression analyses for RNA-sequencing and microarray studies. Nucleic Acids Res. 2015;43:e47
27. Suzuki A, Makinoshima H, Wakaguri H. et al. Aberrant transcriptional regulations in cancers: genome, transcriptome and epigenome analysis of lung adenocarcinoma cell lines. Nucleic Acids Res. 2014;42:13557-13572
28. Yao L, Shen H, Laird PW. et al. Inferring regulatory element landscapes and transcription factor networks from cancer methylomes. Genome Biol. 2015;16:105
29. Creighton C, Lin EW, Karakasheva TA. et al. Comparative transcriptomes of adenocarcinomas and squamous cell carcinomas reveal molecular similarities that span classical anatomic boundaries. PLoS Genet. 2017;13:e1006938
30. Chakravarthi BVSK, Nepal S, Varambally S. Genomic and Epigenomic Alterations in Cancer. The American Journal of Pathology. 2016;186:1724-1735
31. Huang T, Chen X, Hong Q. et al. Meta-analyses of gene methylation and smoking behavior in non-small cell lung cancer patients. Sci Rep. 2015;5:8897
32. Dinardo CD, Luskin MR, Carroll M. et al. Validation of a clinical assay of multi-locus DNA methylation for prognosis of newly diagnosed AML. Am J Hematol. 2017;92:E14-E15
33. Joo JE, Dowty JG, Milne RL. et al. Heritable DNA methylation marks associated with susceptibility to breast cancer. Nature Communications. 2018;9:867
34. Lay FD, Liu Y, Kelly TK. et al. The role of DNA methylation in directing the functional organization of the cancer epigenome. Genome Res. 2015;25:467-477
35. Guo NL, Walter RFH, Rozynek P. et al. Methylation of L1RE1, RARB, and RASSF1 function as possible biomarkers for the differential diagnosis of lung cancer. PLoS One. 2018;13:e0195716
36. Zhang W, Cui Q, Qu W. et al. TRIM58/cg26157385 methylation is associated with eight prognostic genes in lung squamous cell carcinoma. Oncol Rep. 2018;40:206-216
37. Robles AI, Arai E, Mathé EA. et al. An Integrated Prognostic Classifier for Stage I Lung Adenocarcinoma Based on mRNA, microRNA, and DNA Methylation Biomarkers. J Thorac Oncol. 2015;10:1037-1048
38. Li X, Tian R, Gao H. et al. Identification of a histone family gene signature for predicting the prognosis of cervical cancer patients. Sci Rep. 2017;7:16495
39. Payne SR, Serth Jr, Schostak M. et al. DNA methylation biomarkers of prostate cancer: Confirmation of candidates and evidence urine is the most sensitive body fluid for non-invasive detection. The Prostate. 2009;69:1257-1269
40. Multinu F, Chen J, Madison JD. et al. Analysis of DNA methylation in endometrial biopsies to predict risk of endometrial cancer. Gynecol Oncol. 2020 doi: 10.1016/j.ygyno.2019.12.023
41. Clarke MA, Luhn P, Gage JC. et al. Discovery and validation of candidate host DNA methylation markers for detection of cervical precancer and cancer. Int J Cancer. 2017;141:701-710
42. Segal JP. Use of Laser-Capture Microdissection for the Identification of Marker Genes for the Ventromedial Hypothalamic Nucleus. J Neurosci. 2005;25:4181-4188
43. Al Muftah WA, Al-Shafai M, Zaghlool SB. et al. Epigenetic associations of type 2 diabetes and BMI in an Arab population. Clin Epigenetics. 2016;8:13
Author contact
![]() Corresponding author: Yi-Qing Qu, MD, PhD, Department of Respiratory and Critical Care Medicine, Qilu Hospital of Shandong University, Jinan 250012, China. Tel: +86 531 8216 9335, Fax: +86 531 8296 7544, E-mail: quyiqingedu.cn; Yi-E Yang, Department of Clinical Laboratory, Shandong Provincial Qianfoshan Hospital, the First Hospital Affiliated with Shandong First Medical University, Jinan 250014, China. Tel: +86 531 8926 9650, Fax: +86 531 8926 2100, E-mail: yiyang1964com.
Corresponding author: Yi-Qing Qu, MD, PhD, Department of Respiratory and Critical Care Medicine, Qilu Hospital of Shandong University, Jinan 250012, China. Tel: +86 531 8216 9335, Fax: +86 531 8296 7544, E-mail: quyiqingedu.cn; Yi-E Yang, Department of Clinical Laboratory, Shandong Provincial Qianfoshan Hospital, the First Hospital Affiliated with Shandong First Medical University, Jinan 250014, China. Tel: +86 531 8926 9650, Fax: +86 531 8926 2100, E-mail: yiyang1964com.
Received 2019-12-20
Accepted 2020-2-16
Published 2020-3-5