ISSN: 1449-1907International Journal of Medical Sciences

Int J Med Sci 2019; 16(7):939-948. doi:10.7150/ijms.32629 This issue Cite
Research Paper
Assessment of abdominal aortic calcification by computed tomography for prediction of latent left ventricular stiffness and future cardiovascular risk in pre-dialysis patients with chronic kidney disease: A single center cross-sectional study
Kenji Furusawa1,2, Kyosuke Takeshita1,2,3, Susumu Suzuki1, Yosuke Tatami1, Ryota Morimoto1, Takahiro Okumura1, Yoshinari Yasuda4, Toyoaki Murohara1 ![]()
1. Department of Cardiology, Nagoya University Graduate School of Medicine, Nagoya, Japan.
2. Department of Clinical Laboratory, Nagoya University Hospital, Nagoya, Japan.
3. Department of Clinical Laboratory, Saitama Medical Centre, Saitama Medical University, Kawagoe, Japan.
4. Department of CKD Initiatives Internal Medicine, Nagoya University Graduate School of Medicine, Nagoya, Japan.
Abstract
Introduction: There is general interest in finding clinical markers for left ventricular diastolic dysfunction (LVDD), a major cause of cardiorenal syndrome leading to heart failure in chronic kidney disease (CKD) patients. The aim was to assess the utility of computed tomography (CT)-based abdominal aortic calcification (AAC) for the prediction of LVDD and prognosis of asymptomatic pre-dialysis CKD patients.
Materials and methods: We prospectively evaluated 218 pre-dialysis CKD patients [median estimated glomerular filtration rate (eGFR); 40.9 mL/min/1.73m²]. Non-contrast CT scan and echocardiography were performed to determine the aortic calcification index (ACI) as a semi-quantitative measure of AAC.
Results: The median ACI was 11.4. AAC and LVDD were diagnosed in 193 patients (89%) and 75 patients (34%), respectively. Using receiver operating characteristic curve analysis for the estimation of LVDD, ACI of 20 showed optimal sensitivity (52.0%) and specificity (62.8 %) (AUC = 0.664, p < .001). High ACI group included more patients with LVDD-related factors, such as old age, hypertension, diabetes, and more severe CKD. LVDD was significantly more common in patients with high ACI group [39 (50%) and 36 (26%), respectively, p<0.001]. Multivariate analysis showed that ACI correlated significantly with E/A (β=-0.993, p=0.003), E/e' (β=0.077, p<0.001), and cardio-ankle vascular index (β=0.209, p=0.001). Correspondingly, E/e' correlated with logBNP and log(ACI+1), and increased proportionately and significantly with the quartiles of ACI values. Cox proportional hazard models showed that ACI was an independent predictor of CV outcome (hazard ratio 1.03, 95% confidence interval 1.00-1.06, p=0.029).
Conclusion: The results would suggest the usefulness of AAC assessment by CT to predict latent LVDD and future CV risk in asymptomatic pre-dialysis CKD patients.
Keywords: chronic kidney disease, abdominal aortic calcification, left ventricular diastolic dysfunction, cardiorenal syndrome
Introduction
Heart failure (HF) is the leading cause of cardiovascular disease in patients with chronic kidney disease (CKD) [1]. The Chronic Renal Insufficiency Cohort study showed that history of HF in patients with CKD was independently associated with a 29% higher risk of progression to end-stage renal disease or 50% decline in estimated glomerular filtration rate (eGFR), compared with patients free of HF[2]. Thus, prediction and prevention of HF is important in CKD [1]. In this regard, left ventricular ejection fraction (LVEF) is preserved in the majority of CKD patients who develop HF[1]. Current HF guidelines of the European Society of Cardiology (ESC) defined HFpEF as heart failure patients with normal LVEF (typically considered as ≥50%) [3]. The most common mechanism of HFpEF is left ventricular diastolic dysfunction (LVDD), consisting of abnormal LV active relaxation, LV passive stiffness, or both [4]. LVDD is regarded as one of the major causes of cardiorenal syndrome type 4, leading to HF, and is closely associated with CKD irrespective of the disease stage [5]. At this stage, there is a need for simple and accurate tools for the diagnosis of LVDD in pre-dialysis CKD patients.
Abdominal aortic calcification (AAC) is often used for cardiovascular risk assessment[6]. The severity of AAC is associated with high risk of cardiovascular morbidity and mortality based on the high potential of cardiovascular events [7]. AAC is also linked to arterial stiffness [8], an independent predictor of mortality and nonfatal CV events in dialysis patients [9]. Furthermore, aortic calcification is associated with arterial stiffness and complicated with left ventricular hypertrophy and LVDD in dialysis-dependent patients [10] [11]. The significance of AAC is also growing in pre-dialysis CKD patients.
In the present study, we hypothesized that AAC as detected by non-contrast computed tomography (CT) scans is a useful tool for prediction of LVDD. For this purpose, we evaluated the relationship between AAC and LVDD, and the incidence of cardiovascular events in asymptomatic pre-dialysis CKD patients. Our results demonstrated the usefulness of AAC assessment by CT scan in predicting latent LVDD and future CV risk in asymptomatic pre-dialysis CKD patients.
Materials and Methods
Patients
We enrolled 347 serial asymptomatic pre-dialysis CKD patients from the Outpatient Clinic of the Department of Nephrology, Nagoya University Hospital, between November 2009 and October 2011. Patients with an estimated glomerular filtration rate (eGFR) of <60 mL/min/1.73 m2 or with proteinuria associated with renal disease at study entry, or both, were defined as having CKD [12]. We excluded 129 patients with the following diseases or conditions; previous admission due to HF; history of percutaneous coronary intervention; previous abdominal aortic artery repair or stenting; cardiac systolic dysfunction [ejection fraction (EF) <50%]; left ventricular dilatation [left ventricular end-diastolic volume (LVEDV) >97 mL/m2]; moderate or severe valvular heart disease; and atrial fibrillation. Thus, the study population was 218 patients.
Hypertension was defined as systolic blood pressure (SBP) of ≥140 mmHg, diastolic blood pressure of ≥90 mmHg, and/or under treatment for hypertension. Diabetes mellitus (DM) was defined as the use of any glucose-lowering medications, current diagnosis of diabetes and/or fasting plasma glucose concentration of >126 mg/dL and/or a glycosylated hemoglobin concentration of ≥6.5% (National Glycohemoglobin Standardization Program). Dyslipidemia was defined as low-density lipoprotein cholesterol ≥140 mg/dL, high-density lipoprotein cholesterol ≤40 mg/dL, triglycerides ≥150 mg/dL, and/or under treatment for hyperlipidemia. Current smokers were defined as those who declared active smoking. Past smokers were defined as those who declared smoking in the past year. Never-smokers were defined as those who had never smoked before or during the study. Pack-years were calculated as the number of packs of cigarettes smoked per day multiplied by the number of years in which the patient had smoked.
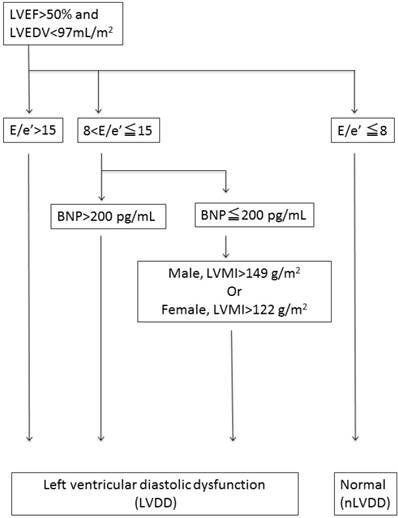
LVDD was defined based on the consensus statement on the diagnosis of HF with normal left ventricular ejection fraction by the Heart Failure and Echocardiography Associations of the European Society of Cardiology [13], as shown in the flow chart in Figure 1. Briefly, LVDD was defined by the combination of echocardiographic values and plasma brain natriuretic peptide (BNP) levels [the ratio of peak early trans-mitral inflow velocity to peak early diastolic mitral annular velocity (E/e') >15, or 15 >E/e' >8 with high BNP levels >200 pg/mL or high left ventricular mass index (LVMI >122 g/m² for females and >149 g/m² for males)][14].
The composite clinical events of cardiovascular death, hospitalization for stroke, acute coronary syndrome, angina pectoris requiring revascularization, and HF requiring admission were monitored during the follow-up period (1236±485 days).
Echocardiography
The standard M-mode and two-dimensional echocardiography, Doppler blood flow, and tissue Doppler imaging measurements were obtained using the Vivid 7 ultrasound system (GE Healthcare, Milwaukee, WI) and the formula approved by the American Society of Echocardiography (ASE) [15].
Blood tests
After an overnight fast of 12 hrs, blood samples were obtained from all patients. Serum creatinine was measured using the isotope-dilution mass spectrometry traceable enzymatic method, and the eGFR was calculated using the equation for Japanese subjects recommended by the Japanese Society of Nephrology: e-GFR (mL/min/1.73 m2) = 194 × SCr-1.094 × age-0.287 × 0.739 (for females) [15]. The eGFR levels were classified according to the National Kidney Foundation's Kidney Disease Outcomes Quality Initiative guidelines (eGFR ≥90, ≥60 to <90, ≥45 to <60, ≥30 to <45, ≥15 to <30, and <15 mL/min/1.73 m2 for G1, G2, G3a, G3b, G4, and G5, respectively) [14]. Serum calcium levels were corrected for albumin using the following formula: corrected calcium = total calcium + (4.0 - albumin) × 0.8, when albumin was <4.0 g/dL. Routine laboratory tests were performed and samples were measured on the Abbott Architect platform (Abbott Laboratories, Abbott Park, IL).
Flowchart to determine left ventricular diastolic dysfunction. Left ventricular diastolic dysfunction (LVDD) was defined with the combination of echocardiographic values and plasma brain natriuretic peptide (BNP) levels {the ratio of peak early transmitral inflow velocity to peak early diastolic mitral annular velocity (E/e') >15, or 15 >E/e' >8 with higher brain natriuretic peptide (BNP) levels > 200 pg/ml or increased left ventricular mass index (LVMI) [LVMI >122g/m² (female); >149 g/m² (male).
Measurement of AAC
All patients were scanned in the supine position in a craniocaudal direction using a 64-slice non-contrast CT scan (Siemens Medical Solutions, Forchheim, Germany), from which images were obtained with a 5-mm slice thickness. Aortic calcification was considered to be present if an area of ≥1 mm2 displayed a density of ≥130 Hounsfield units. The AAC score was calculated for the aortic segment extending from the renal artery to the bifurcation of the aorta into the common iliac arteries. The cross-section of the abdominal aorta on each slice was divided radially into 12 segments. The ACI was calculated as follows: ACI = (total score for calcification on all slices)/12 × 1/ (number of slices) × 100 (%) [16]. Semi-quantitative measurement of AAC was conducted independently by two physicians who were blinded to the clinical data [17], [18].
Measurement of cardio-ankle vascular index (CAVI)
As reported previously by our group[19], CAVI was measured noninvasively by experienced blinded technicians using the standard protocol of VaSera CAVI instrument (Fukuda Denshi Co., Tokyo). The subjects rested on a bed in a supine position for 10 min before the measurements. The CAVI value is based on the stiffness parameter calculated using the following formula: ln(Ps/Pd) × 2ρ/ΔP × PWV2 (where ρ: blood density, Ps: systolic blood pressure, Pd: diastolic blood pressure, ΔP: Ps -Pd, PWV between the aortic and ankle values).
Statistical analysis
Continuous variables are expressed as mean±standard deviation (SD) for data with normal distribution, or median (interquartile range: IQR) for data with skewed distribution, as determined by the F test. Categorical variables were expressed as percentages. The Student's t test or Mann-Whitney test was used to analyze data with normal or skewed distribution, respectively (continuous variables). The chi-squared test or Fisher's exact test was used for analysis of categorical data. Pearson's linear correlation analysis was used to determine the correlation between the ACI or ratio of early diastolic trans-mitral flow velocity to early diastolic mitral annular velocity (E/e'), and the echocardiographic and clinical variables. Receiver operator characteristic (ROC) curve analysis for ACI was performed to discriminate between the patients with or without LVDD. The cutoff point was calculated as ACI 20, as shown in the result section. And then, the subjects were divided into 2 groups according to this cutoff value.
Baseline characteristics of the study population.
| All (n=218) | Low ACI (n=140) | High ACI (n=78) | P | |
|---|---|---|---|---|
| Age (year) | 68 ± 12 | 65 ± 12 | 72 ± 10 | <0.001 |
| male, n (%) | 152 (70%) | 95 (68%) | 57 (73%) | 0.421 |
| Body surface area (m2) | 1.68 ± 0.21 | 1.69 ± 0.22 | 1.66 ± 0.18 | 0.229 |
| Body mass index (kg/m2) | 23.9 ± 3.7 | 24.0 ± 4.1 | 23.7 ± 2.9 | 0.656 |
| Hypertension, n (%) | 187 (86%) | 110 (79%) | 77 (99%) | <0.001 |
| Dyslipidemia, n (%) | 164 (75%) | 100 (71%) | 64 (82%) | 0.082 |
| Diabetes mellitus, n (%) | 81 (37%) | 43 (31%) | 38 (49%) | 0.008 |
| smoking | 0.016 | |||
| current, n (%) | 15 (7%) | 9 (7%) | 6 (8%) | |
| ex-smoker, n (%) | 80 (37%) | 42 (31%) | 38 (49%) | |
| Coronary heart disease, n (%) | 9 (4%) | 1 (1%) | 8 (10%) | <0.001 |
| Heart rate (beats/min) | 67±12 | 68±11 | 66±12 | 0.495 |
| Systolic blood pressure (mmHg) | 132±18 | 129±18 | 137±18 | 0.002 |
| Diastolic blood pressure (mmHg) | 76±11 | 77±11 | 74±12 | 0.060 |
| Pulse pressure (mmHg) | 56±16 | 52±14 | 63±17 | <0.001 |
| Hemoglobin (g/dl) | 12.5±1.9 | 12.9±1.9 | 11.8±1.7 | <0.001 |
| Albumin (g/dl) | 3.8±0.5 | 3.9±0.5 | 3.7±0.5 | <0.001 |
| LDL (mg/dl) | 106±31 | 110±32 | 99±29 | 0.012 |
| HDL (mg/dl) | 50±17 | 51±17 | 48±17 | 0.183 |
| Triglyceride (mg/dl) | 150±84 | 150±84 | 149±83 | 0.922 |
| Corrected Calcium (mg/dl) | 9.5±0.4 | 9.5±0.4 | 9.5±0.4 | 0.547 |
| Phosphorus (mg/dl) | 3.4±0.6 | 3.4±0.6 | 3.5±0.7 | 0.197 |
| Creatinine (mg/dl) | 1.27 (0.95-1.78) | 1.22 (0.90-1.62) | 1.53 (1.11-2.01) | <0.001 |
| eGFR (ml/min/1.73m2) | 40.9 (28.3-55.5) | 44.2 (30.7-60.1) | 34.5 (25.1-50.2) | <0.001 |
| HbA1c (%) | 6.0±0.9 | 5.9±0.8 | 6.1±0.9 | 0.113 |
| BNP (pg/ml) | 21.1 (10.4-49.4) | 15.7 (8.3-36.4) | 39.3 (14.8-73.3) | <0.001 |
| CKD (eGFR) | 0.036 | |||
| G1 (≥90 ), n (%) | 11 (5%) | 10 (7%) | 1 (1%) | |
| G2 (≥60 to <90), n (%) | 31 (14%) | 25 (18%) | 6 (8%) | |
| G3a (≥45 to <60), n (%) | 52 (24%) | 31 (22%) | 21 (27%) | |
| G3b (≥30 to <45), n (%) | 61 (28%) | 41 (29%) | 20 (26%) | |
| G4 (≥15 to <30), n (%) | 52 (24%) | 28 (20%) | 24 (31%) | |
| G5 (<15), n (%) | 11 (5%) | 5 (4%) | 6 (8%) | |
| LVEF (%) | 68.0±5.8 | 68.0±5.7 | 68.1±5.9 | 0.923 |
| LVDd (mm) | 47.7±5.1 | 47.3±5.0 | 48.4±5.3 | 0.109 |
| LVDs (mm) | 29.5±4.0 | 29.2±3.8 | 30.0±4.4 | 0.214 |
| EDVI (ml/m2) | 64.3±14.5 | 62.5±13.7 | 67.5±15.5 | 0.014 |
| ESVI (ml/m2) | 20.7±6.5 | 20.0±5.9 | 21.8±7.3 | 0.055 |
| SVI (ml/m2) | 43.7±10.1 | 42.6±10.0 | 45.5±10.0 | 0.046 |
| RWT | 0.40±0.09 | 0.40±0.08 | 0.42±0.08 | 0.920 |
| LVMI (g/m2) | 117.6±32.5 | 113.3±29.5 | 125.2±36.3 | <0.001 |
| LAD (mm) | 35.9±5.0 | 35.1±5.0 | 37.4±4.6 | 0.001 |
| E (cm/sec) | 66.4±17.4 | 63.3±14.9 | 71.8±20.1 | <0.001 |
| A (cm/sec) | 81.5±20.2 | 76.3±18.6 | 91.0±19.6 | <0.001 |
| DcT (msec) | 248±64 | 245±63 | 255±65 | 0.238 |
| E/A | 0.8±0.3 | 0.9±0.3 | 0.8±0.3 | 0.261 |
| e' (cm/sec) | 5.8±1.8 | 6.0±1.9 | 5.4±1.7 | 0.020 |
| E/e' | 12.4±4.6 | 11.4±3.8 | 14.3±5.3 | <0.001 |
| CAVI | 9.1±1.3 | 8.8±1.4 | 9.5±1.2 | <0.001 |
| ACI (%) | 11.4 (1.8-26.6) | 3.7 (0.5-10.6) | 33.1 (25.4-40.4) | <0.001 |
| ACI>0 | 193 (89%) | 115 (82%) | 78 (100%) | <0.001 |
| LVDD | 75 (34%) | 36 (26%) | 39 (50%) | <0.001 |
Data are mean±SD, n (%) or median (interquartile range). LDL, low-density lipoprotein; HDL, high-density lipoprotein; eGFR, estimated glomerular filtration rate; HbA1c, hemoglobin A1c; BNP, brain natriuretic peptide; CKD, chronic kidney disease; LVEF, left ventricular ejection fraction; LVDd, left ventricular end-diastolic diameter; LVDs, left ventricular end-systolic diameter; EDVI, end-diastolic volume index; ESVI, end-systolic volume index; SVI, stroke volume index; RWT, relative wall thickness; LVMI, left ventricular mass index; LAD, left atrial diameter; E, early diastolic transmitral flow; A , late diastolic transmitral flow; DcT , deceleration time; e', early diastolic mitral annular velocity; CAVI, cardio ankle vascular index; ACI, abdominal aortic calcification index; LVDD, left ventricular diastolic dysfunction.
Multivariate linear regression analysis was performed to assess the factors that determined ACI and E/e'. Variables with p<0.10 in univariate analysis were incorporated into the multivariate linear regression model. Event-free survival curves were estimated using the Kaplan Meier method and compared using the log-rank test. In the Kaplan Meier method, only the day of the first outcome was considered as the day of the cardiovascular event in case of multiple outcomes in the same patient. Kaplan-Meier survival curves were calculated with the data dichotomized at the cut-off point of ACI 20. Multivariate Cox proportional hazards regression analysis was performed to identify independent predictors of cardiovascular events. A two-sided p value of <0.05 was considered statistically significant. The JMP Pro version 11.0.0 (SAS Institute Inc, Cary, NC) was used for all statistical analyses.
Results
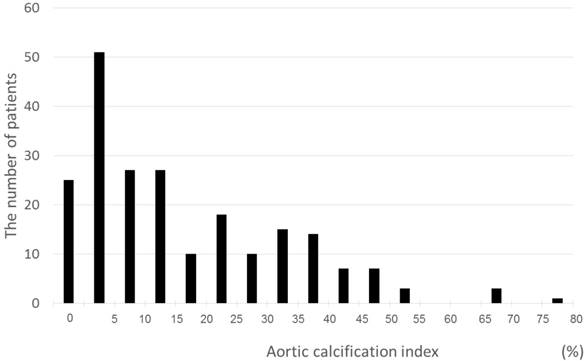
A total of 218 patients with a mean age of 68±12 years and median eGFR of 40.9 mL/min/1.73 m2 were recruited for this study (Table I). Among the subjects, 37% had diabetes and 86% had hypertension. LVDD was observed in 75 (34%) patients. AAC (ACI >0) was confirmed in 193 (89%) patients based on CT evaluation. The ACI of all patients were distributed from 0 to 76.6, with a mean of 11.4 points (Fig. 2).
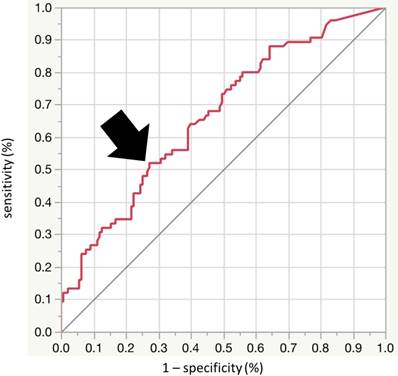
ROC curve analysis was performed to calculate an optimal cutoff value for ACI to detect LVDD, and identified ACI of 20 as the best cutoff (sensitivity 52.0%, specificity 62.8%, area under the ROC curve [AUC] = 0.66; 95% confidence interval [CI], 0.586-0.735) (Fig. 3). Next, we divided the patients into the two groups according to the ACI level, using the cutoff value of 20. Table I shows the baseline clinical characteristics of patients of the two groups. The prevalence of LVDD was significantly higher in the high ACI group (high ACI; 39 (50%), low ACI; 36 (26%), p<0.001). The high ACI group included older patients, and a higher percentage of patients with hypertension, diabetes mellitus, coronary heart disease, and ex-smokers. Furthermore, systolic blood pressure, pulse pressure, eGFR and BNP were significantly higher while hemoglobin and albumin were significantly lower in the high ACI group. Furthermore, the high ACI group included larger percentages of patients with more severe CKD (7%, 18%, 22%, 29%, 20% and 4%, vs 1%, 8%, 27%, 26%, 31% and 6% for G1, G2, G3a, G3b, G4 and G5, respectively; p for trend <0.036). Echocardiographic data showed significantly higher values of EDVI, SVI, LVMI, LAD, E and A waves, e', E/e', and CAVI in the high ACI group.
Determinants of ACI [calculated as log(ACI+1)] were assessed with univariate and multivariate analyses to define the relationship with various physiological parameters, such as echocardiographic and clinical parameters and CAVI (Table II). There were significant correlations between log(ACI+1), and echocardiographic parameters involved in left ventricular hypertrophy and stiffness, including peak early diastolic LV filling velocity/peak atrial filling velocity ratio (E/A) and E/e', and CAVI (E/A, β=-0.993, p=0.003; E/e', β=0.077, p<0.001; CAVI, (β=0.209, p=0.001).
Results of univariate and multivariate analyses for ACI.
| Variable | Univariate | Multivariate | ||
|---|---|---|---|---|
| β | P | β | P | |
| LVDd | 0.042 | 0.539 | - | - |
| LVDs | 0.051 | 0.45 | - | - |
| LVEF | -0.031 | 0.652 | - | - |
| EDVI | 0.161 | 0.018 | 0.009 | 0.354 |
| ESVI | 0.138 | 0.041 | 0.005 | 0.804 |
| SVI | 0.108 | 0.111 | - | - |
| RWT | 0.011 | 0.871 | - | - |
| LVMI | 0.197 | 0.004 | -0.001 | 0.909 |
| LAD | 0.188 | 0.005 | 0.027 | 0.120 |
| DcT | 0.122 | 0.072 | - | - |
| E/A | -0.251 | <0.001 | -0.993 | 0.003 |
| E/e' | 0.337 | <0.001 | 0.077 | <0.001 |
| CAVI | 0.327 | <0.001 | 0.209 | 0.001 |
Abbreviations are the same as in Table I.
Distribution of the ACI. The minimum, median, and maximum ACI scores were 0, 11.4, and 76.6, respectively.
Receiver-operator characteristic (ROC) analysis using aortic calcification index (ACI) to detect LVDD. The optimal cutoff value of ACI for detection of LVDD was 20.0 (sensitivity 52.0%, specificity 62.8%, area under the curve = 0.664; 95%CI [0.586 to 0.735], p < 0.001). AUC: area under the curve, CI: confidence interval.
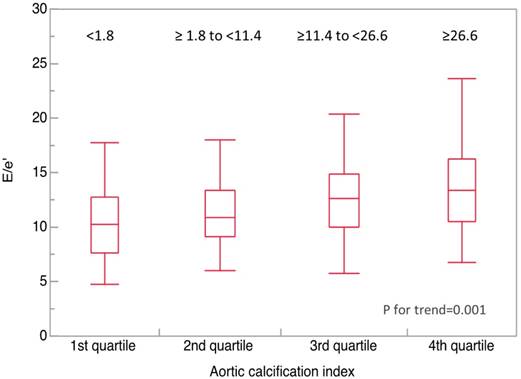
Determinants of inversely E/e' were also analyzed by univariate and multivariate analyses (Table III). The analysis showed that log plasma BNP (log BNP), and log(ACI+1) correlated significantly with E/e'. Values of E/e' were compared among the quartiles of ACI (first quartile, <1.8; second quartile, ≥1.8 to <11.4; third quartile, ≥11.4 to <26.6; fourth quartile, ≥26.6) (Fig. 4). The values of E/e' was significantly higher in the upper quartiles of ACI (10.5, 11.2, 12.5, and 13.2, respectively; P for trend=0.001).
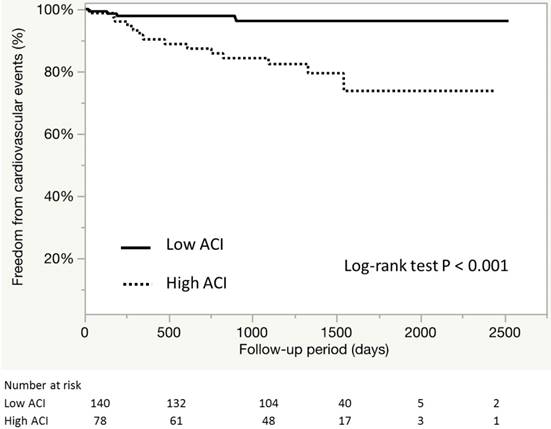
During the median follow-up of 1236±485 days, a total of 19 cardiovascular events were recorded (Table IV). Figure 5 shows the event-free survival curve for cardiovascular outcomes. Kaplan Meier analysis showed that patients of the high ACI group tended to have higher risk of CV outcomes (96.4% and 82.0%, P<0.001). Further analysis showed that the high ACI group included larger proportions of patients with angina pectoris requiring revascularization and HF requiring treatment (p=0.021 and 0.007, respectively). The ACI values and male gender were independently associated with cardiovascular events among the asymptomatic patients with CKD [hazard ratio (HR) 1.03, 95% confidence interval (95%CI) 1.00-1.06, p=0.029; HR 4.63, 95% CI 1.29-29.6, p=0.016, respectively] (Table V). Apart from the above factors, the comorbidity of LVDD did not correlated with the incidence (p=0.53, data not shown).
Results of univariate and multivariate analysis for the ratio of early diastolic transmitral flow velocity to early diastolic mitral annular velocity (E/e')
| Variables | Univariate | Multivariate | ||
|---|---|---|---|---|
| β | P | β | P | |
| Age | 0.113 | <0.001 | 0.036 | 0.276 |
| Body surface area | -5.042 | 0.001 | 0.230 | 0.899 |
| Body mass index | -0.079 | 0.342 | - | - |
| Male | 0.704 | 0.036 | 0.100 | 0.889 |
| Systolic blood pressure | 0.814 | <0.001 | -0.006 | 0.949 |
| Diastolic blood pressure | -0.031 | 0.248 | - | - |
| Pulse pressure | 0.097 | <0.001 | 0.065 | 0.066 |
| Heat rate | 0.007 | 0.790 | - | - |
| Coronary heart disease | -1.016 | 0.191 | - | - |
| Hemoglobin | -0.523 | 0.001 | 0.381 | 0.144 |
| Albumin | -2.150 | <0.001 | 0.139 | 0.604 |
| Corrected Calcium | 2.511 | 0.078 | ||
| Phosphorous | 1.398 | 0.005 | 0.721 | 0.163 |
| HbA1c | 0.901 | 0.013 | 0.415 | 0.279 |
| Triglyceride | <0.001 | 0.911 | - | - |
| HDL | -0.006 | 0.733 | - | - |
| LDL | -0.004 | 0.715 | - | - |
| eGFR | -0.036 | 0.009 | -0.014 | 0.523 |
| CAVI | 0.624 | 0.006 | -0.071 | 0.726 |
| log BNP | 1.572 | <0.001 | 1.107 | <0.001 |
| log(ACI+1) | 1.182 | <0.001 | 0.538 | 0.042 |
Abbreviations are the same as in Table I.
Clinical outcomes
| Events, n (%) | All (n=218) | Low ACI (n=140) | High ACI (n=78) | P |
|---|---|---|---|---|
| ALL | 19 (8.7%) | 5 (3.6%) | 14 (18%) | <0.001 |
| Cardiovascular death | 2 (0.9%) | 1 (0.7%) | 1 (1.3%) | 0.673 |
| Myocardial infarction | 4 (1.8%) | 1 (0.7%) | 3 (3.9%) | 0.501 |
| AP (PCI / CABG) | 10 (4.6%) | 3 (2.1%) | 7 (9.0%) | 0.021 |
| Heart failure | 4 (1.8%) | 0 | 4 (5.1%) | 0.007 |
| Cerebral infarction | 5 (2.3%) | 2 (1.4%) | 3 (3.9%) | 0.790 |
| Follow-up term (days) | 1236±485 | 1260±462 | 1192±526 | 0.323 |
AP, angina pectoris, PCI, percutaneous coronary interventions, CABG, coronary artery bypass grafting.
Results of Cox regression analysis for prediction of cardiovascular events.
| Variables | Univariate | Multivariate | ||||
|---|---|---|---|---|---|---|
| HR | 95% CI | P Values | HR | 95% CI | P Values | |
| Age | 1.05 | 1.01-1.10 | 0.023 | 1.04 | 0.99-1.10 | 0.111 |
| Male | 3.77 | 1.08-23.8 | 0.036 | 4.63 | 1.29-29.6 | 0.016 |
| Body mass index | 1.07 | 0.95-1.19 | 0.286 | - | - | - |
| Current smoking | 1.71 | 0.27-5.96 | 0.505 | - | - | - |
| Systolic blood pressure | 1.01 | 0.99-1.04 | 0.220 | - | - | - |
| Diabetes mellitus | 1.31 | 0.51-3.25 | 0.561 | - | - | - |
| Dyslipidemia | 0.57 | 0.23-1.55 | 0.259 | - | - | - |
| eGFR | 0.99 | 0.97-1.01 | 0.574 | - | - | - |
| Hemoglobin | 1.01 | 0.60-1.28 | 0.919 | - | - | - |
| Albumin | 0.70 | 0.32-1.84 | 0.440 | - | - | - |
| CAVI | 1.18 | 0.84-1.63 | 0.337 | - | - | - |
| LVDD | 1.33 | 0.52-3.30 | 0.539 | - | - | - |
| ACI | 1.03 | 1.01-1.06 | 0.003 | 1.03 | 1.00-1.06 | 0.029 |
eGFR, estimated glomerular filtration rate; CAVI,; cardio ankle vascular index, LVDD; left ventricular diastolic dysfunction, ACI; abdominal aortic calcification index.
Abdominal aortic calcification index (ACI) vs. E/e'. Median ACI significantly increased in accordance to increase in E/e' quadrantile (10.5, 11.2, 12.5, and 13.2, respectively; P for trend=0.001). Bold horizontal line, median; top and bottom of the box, interquartile range; whiskers, maximum and minimum.
Event-free survival curve for CV outcomes according ACI. Kaplan-Meier estimates for overall survival according to ACI divided by an optimal cutoff value of 20%.
The above data suggest that AAC could be useful for the prediction of LVDD and future cardiovascular events in asymptomatic pre-dialysis CKD patients.
Discussion
The main finding of the present study was that the severity of ACC was associated with the prevalence of LVDD and adverse CV outcomes in pre-dialysis CKD patients. From the viewpoint of risk stratification in clinical practice, the results of the present pilot study are significant for asymptomatic pre-dialysis CKD patients, since assessment of ACC by CT scan can be used to predict LVDD and hence help prevent any potential future development of HFpEF and CV events.
The present study investigated the relationship between ACC and LVDD. The subjects were divided into two groups at ACI of 20, which was the best cutoff to detect LVDD using ROC analysis (Fig. 3). In Table I, the high ACI group included more patients with LVDD and LVDD-related factors, such as old age, hypertension, diabetes, and more severe CKD [20, 21]. Based on the criteria of LVDD (Fig 1), the high ACI group included a larger proportion of patients with high BNP and echocardiographic findings of LV hypertrophy and LVDD. Cardiac diastolic dysfunction can be caused by several related factors, such as arterial stiffness, systemic inflammation, and vascular-ventricular overload, and uncoupling [21]. In particular, aortic stiffness is involved in LVDD and incidence of HFpEF [22]. Increase in aortic stiffness would influence diastolic function through its effect on reflected waves within the aorta [23]. Blood in the normal aorta reflects backward when it comes into contact with arterial branch points such as the aortic bifurcation, and the reflected waves do not disturb aortic systolic forward flow and left ventricular ejection. But the reflected waves in the stiff aorta return as early as the systolic ejection period, and increase the peak LV pressure and systole lengthens. And then, increasing LV afterload delays and prolongs LV relaxation, and decreases coronary perfusion [23, 24]. Indeed CAVI, which is a useful measure of atherosclerosis and vascular stiffness [25], was significantly higher in the high ACI group. Furthermore, our data showed significant correlations between log(ACI+1) and indices of ventricular and vascular stiffness, including E/A, E/e', and CAVI (Table II). Inversely, E/e', which is a diagnostic marker of LV diastolic function, correlated significantly with logBNP and log(ACI+1) (Table III). The values of E/e' increased significantly and proportionately with increases in ACI (Fig.4). These results suggest that AAC detected by CT can be potentially a suitable tool for assessment of diastolic dysfunction.
Vascular calcification is defined as abnormal pathological deposition of minerals in the form of calcium phosphate salts into the vascular tissues[26]. Vascular calcification is accelerated by various traditional risk factors, including hypertension, diabetes mellitus, dyslipidemia, aging, smoking, and cardiovascular disease, as well as specific genetic disorders in CKD patients[26]. In CKD patients, abnormal calcium/phosphorous balance plays a critical role in calcification[26]. A recent multicenter, cross-sectional study from Thailand reported a close correlation between the prevalence of AAC and patient's age and pulse pressure but not serum calcium or phosphorous in pre-dialysis patients with CKD[27]. In the present study, the levels of corrected serum calcium and phosphorus did not correlate with the degree of ACC (Table I). The pathogenic process of vascular calcification in CKD patients is complex and includes inflammation-related disruption of the balance between promoters and inhibitors of calcification, oxidative stress, and changes in extracellular matrix metabolism and vascular smooth muscle cell differentiation along with derangements in calcium and phosphate metabolic pathways[26], [28]. This complex mechanism and differences in disease duration can reduce the effects of abnormal calcium regulation in pre-dialysis CKD patients.
In general, the value of arterial calcification in cardiovascular risk assessment is well established [29]. Previous studies showed that severe AAC is associated with high risk of cardiovascular morbidity and mortality due to cardiovascular ischemic events, such as myocardial infarction and stroke [30] [31]. Several studies have discussed the clinical significance of AAC in hemodialysis-dependent CKD patients [10] [32] [20], however, there is little or no information on the clinical significance and pathophysiology of AAC in asymptomatic pre-dialysis CKD patients. In the present study, more CV events were recorded in the high ACI group (Fig. 5, Table IV), including more patients with coronary events and HF (Table IV). This finding suggests the involvement of ACC in cardiac ischemia associated with coronary atherosclerosis, as well as HFpEF associated with LVDD and vascular-ventricular overload. Indeed, Cox regression analysis demonstrated that ACC is a significant predictor of CV events (Table V). Thus, ACC is also a potentially useful predictor of both HFpEF and cardiac ischemic events [33]. The data in Table V show comparable correlations with other conventional CV risk factors, such as hypertension, diabetes, hyperlipidemia, and eGFR; however, male gender, in addition to ACC, was associated with CV events. Recent analysis of data of the Framingham Heart Study showed that the risk factors for the incidence and progression of AAC were similar to the traditional coronary risk factors, including male gender, and that AAC was associated with coronary arterial calcification, which correlated with future incidence of adverse CVD events and increased rate of cardiovascular mortality [31]. A recent systematic review of the impact of social disadvantages in patients with moderate to severe CKD showed that male gender correlated significantly with the incidence and mortality of CV events [34]. Considered together, the above studies suggest that male gender is an important risk factor for CV events in CKD patients [34]. However, we cannot rule out the effect of selection bias since only a relatively small number of patients that matched the study inclusion criteria were selected from a small population in a single-center study.
Cardiovascular disease is the leading cause of death in CKD patients, accounting for up to 50% of all deaths[35]. Furthermore, LVDD is a major cause of HF in CKD patients irrespective of the disease stage, and the condition is categorized as cardiorenal syndrome type 4 [5]. The pathophysiological mechanisms and clinical features have been discussed and investigated[20]. More recent studies have focused on the usefulness of CT scan in the assessment of arterial calcification in CKD patients [36]. Cardiac biomarkers, such as cardiac troponin and BNP, and N-terminal-pro-BNP (NT-pro-BNP), are often used for the diagnosis of exacerbation of congestive heart failure in pre-dialysis CKD [35]. However, renal dysfunction is associated with impaired clearance of these molecules, resulting in increases in their plasma levels even in asymptomatic CKD patients, and such associations are less clearly established in CKD[35]. Thus, new tools for the diagnosis of aortic calcification, such as CT scan, are needed for routine daily clinical management of CKD[20].
Because the present study has a single-center retrospective cross-sectional design, limitations include a small sample number and patient selection bias. This should be taken into account when interpreting the results. Further large scale studies are needed to confirm the study findings on the relationship between ACC, LVDD and CV outcome in pre-dialysis CKD patients. We defined LVDD according to the ESC position statement on the diagnosis of HFpEF in 2007 [13] because we enrolled patients between November 2009 and October 2011. Nowadays, diastolic dysfunction is commonly evaluated by echocardiography using color Doppler and tissue Doppler imaging according to the ASE guidelines in 2016 [37]. The protocol to detect LVDD has been modified and improved in the ESC Guidelines published in 2016 [3]. We would suggest that a further investigation be conducted according to the updated guideline in the future study.
The severity of AAC correlated significantly with latent LVDD and future CV events in asymptomatic pre-dialysis CKD patients. These data would suggest the utility of the CT scan in the assessment of arterial calcification and prediction of cardiorenal syndrome.
Acknowledgements
We express our sincere appreciation to all patients, collaborating physicians, and other medical staff for their important contribution to the study. We also thank Dr. F.G. Issa, Word-Medex Pty Ltd, for the careful reading and editing of the manuscript. This study was supported by a Grant-in-Aid for Scientific Research (Kakenhi 18H02729 to KT).
Ethics approval and consent to participate
Our retrospective cross-sectional study was approved by the local ethics committee (#2013-101) and conducted in accordance with the ethical principles stated by the Declaration of Helsinki (1975). Written informed consent was obtained from all patients.
Competing Interests
Y.Y. is employed by funds made available by Chugai, Kowa, Kyowa Hakko Kirin, MSD, Kureha, and Nippon Boehringer Ingelheim.
References
1. Tuegel C, Bansal N. Heart failure in patients with kidney disease. Heart. 2017;103:1848-53
2. Rahman M, Xie D, Feldman HI, Go AS, He J, Kusek JW. et al. Association between chronic kidney disease progression and cardiovascular disease: results from the CRIC Study. American journal of nephrology. 2014;40:399-407
3. Ponikowski P, Voors AA, Anker SD, Bueno H, Cleland JG, Coats AJ. et al. 2016 ESC Guidelines for the diagnosis and treatment of acute and chronic heart failure: The Task Force for the diagnosis and treatment of acute and chronic heart failure of the European Society of Cardiology (ESC). Developed with the special contribution of the Heart Failure Association (HFA) of the ESC. European journal of heart failure. 2016;18:891-975
4. Zile MR, Baicu CF, Gaasch WH. Diastolic heart failure-abnormalities in active relaxation and passive stiffness of the left ventricle. The New England journal of medicine. 2004;350:1953-9
5. Ronco C, Di Lullo L. Cardiorenal Syndrome in Western Countries: Epidemiology, Diagnosis and Management Approaches. Kidney diseases. 2017;2:151-63
6. Levitzky YS, Cupples LA, Murabito JM, Kannel WB, Kiel DP, Wilson PW. et al. Prediction of intermittent claudication, ischemic stroke, and other cardiovascular disease by detection of abdominal aortic calcific deposits by plain lumbar radiographs. The American journal of cardiology. 2008;101:326-31
7. Hoffmann U, Massaro JM, D'Agostino RB Sr, Kathiresan S, Fox CS, O'Donnell CJ. Cardiovascular Event Prediction and Risk Reclassification by Coronary, Aortic, and Valvular Calcification in the Framingham Heart Study. Journal of the American Heart Association. 2016:5
8. Raggi P, Bellasi A, Ferramosca E, Islam T, Muntner P, Block GA. Association of pulse wave velocity with vascular and valvular calcification in hemodialysis patients. Kidney international. 2007;71:802-7
9. Verbeke F, Van Biesen W, Honkanen E, Wikstrom B, Jensen PB, Krzesinski JM. et al. Prognostic value of aortic stiffness and calcification for cardiovascular events and mortality in dialysis patients: outcome of the calcification outcome in renal disease (CORD) study. Clinical journal of the American Society of Nephrology: CJASN. 2011;6:153-9
10. Fujiu A, Ogawa T, Matsuda N, Ando Y, Nitta K. Aortic arch calcification and arterial stiffness are independent factors for diastolic left ventricular dysfunction in chronic hemodialysis patients. Circulation journal: official journal of the Japanese Circulation Society. 2008;72:1768-72
11. Unagami K, Nitta K, Tago K, Matsushita K. Relationship Between Diastolic Dysfunction and Atherosclerosis and Vascular Calcification in Hemodialysis Patients: Diagnostic Potential of the Cardio-Ankle Vascular Index. Therapeutic apheresis and dialysis: official peer-reviewed journal of the International Society for Apheresis, the Japanese Society for Apheresis, the Japanese Society for Dialysis Therapy. 2016;20:135-41
12. Stevens PE, Levin A, Kidney Disease. Improving Global Outcomes Chronic Kidney Disease Guideline Development Work Group M. Evaluation and management of chronic kidney disease: synopsis of the kidney disease: improving global outcomes 2012 clinical practice guideline. Annals of internal medicine. 2013;158:825-30
13. Paulus WJ, Tschope C, Sanderson JE, Rusconi C, Flachskampf FA, Rademakers FE. et al. How to diagnose diastolic heart failure: a consensus statement on the diagnosis of heart failure with normal left ventricular ejection fraction by the Heart Failure and Echocardiography Associations of the European Society of Cardiology. European heart journal. 2007;28:2539-50
14. Palazzuoli A, Silverberg DS, Iovine F, Calabro A, Campagna MS, Gallotta M. et al. Effects of beta-erythropoietin treatment on left ventricular remodeling, systolic function, and B-type natriuretic peptide levels in patients with the cardiorenal anemia syndrome. American heart journal. 2007;154:645 e9-15
15. Fukaya K, Takeshita K, Okumura T, Hiraiwa H, Aoki S, Ichii T. et al. Sokolow-Lyon voltage is suitable for monitoring improvement in cardiac function and prognosis of patients with idiopathic dilated cardiomyopathy. Annals of noninvasive electrocardiology: the official journal of the International Society for Holter and Noninvasive Electrocardiology, Inc. 2017:22
16. Taniwaki H, Ishimura E, Tabata T, Tsujimoto Y, Shioi A, Shoji T. et al. Aortic calcification in haemodialysis patients with diabetes mellitus. Nephrology, dialysis, transplantation: official publication of the European Dialysis and Transplant Association - European Renal Association. 2005;20:2472-8
17. Tatami Y, Yasuda Y, Suzuki S, Ishii H, Sawai A, Shibata Y. et al. Impact of abdominal aortic calcification on long-term cardiovascular outcomes in patients with chronic kidney disease. Atherosclerosis. 2015;243:349-55
18. Ichii T, Morimoto R, Okumura T, Ishii H, Tatami Y, Yamamoto D. et al. Impact of Renal Functional/Morphological Dynamics on the Calcification of Coronary and Abdominal Arteries in Patients with Chronic Kidney Disease. Journal of atherosclerosis and thrombosis. 2017;24:1092-104
19. Inaba H, Takeshita K, Uchida Y, Hayashi M, Okumura T, Hirashiki A. et al. Recovery of flow-mediated vasodilatation after repetitive measurements is involved in early vascular impairment: comparison with indices of vascular tone. PloS one. 2014;9:e83977
20. Ogawa T, Koeda M, Nitta K. Left Ventricular Diastolic Dysfunction in End-Stage Kidney Disease: Pathogenesis, Diagnosis, and Treatment. Therapeutic apheresis and dialysis: official peer-reviewed journal of the International Society for Apheresis, the Japanese Society for Apheresis, the Japanese Society for Dialysis Therapy. 2015;19:427-35
21. Yen CH, Hung CL, Lee PY, Tsai JP, Lai YH, Su CH. et al. Segmental arterial stiffness in relation to B-type natriuretic peptide with preserved systolic heart function. PloS one. 2017;12:e0183747
22. Desai AS, Mitchell GF, Fang JC, Creager MA. Central aortic stiffness is increased in patients with heart failure and preserved ejection fraction. Journal of cardiac failure. 2009;15:658-64
23. Silbiger JJ. Pathophysiology and Echocardiographic Diagnosis of Left Ventricular Diastolic Dysfunction. Journal of the American Society of Echocardiography: official publication of the American Society of Echocardiography. 2019;32(e2):216-32
24. Fukuta H, Ohte N, Wakami K, Asada K, Goto T, Mukai S. et al. Impact of arterial load on left ventricular diastolic function in patients undergoing cardiac catheterization for coronary artery disease. Circulation journal: official journal of the Japanese Circulation Society. 2010;74:1900-5
25. Shirai K, Utino J, Otsuka K, Takata M. A novel blood pressure-independent arterial wall stiffness parameter; cardio-ankle vascular index (CAVI). Journal of atherosclerosis and thrombosis. 2006;13:101-7
26. Paloian NJ, Giachelli CM. A current understanding of vascular calcification in CKD. American journal of physiology Renal physiology. 2014;307:F891-900
27. Lumlertgul D, Kantachuvesiri S, Apichaiyingyurd S, Treamtrakanpon W, Rattanasompattikul M, Gojaseni P. et al. Prevalence of and Predictive Factor for Abdominal Aortic Calcification in Thai Chronic Kidney Disease Patients. Therapeutic apheresis and dialysis: official peer-reviewed journal of the International Society for Apheresis, the Japanese Society for Apheresis, the Japanese Society for Dialysis Therapy. 2017;21:611-9
28. Ruderman I, Holt SG, Hewitson TD, Smith ER, Toussaint ND. Current and potential therapeutic strategies for the management of vascular calcification in patients with chronic kidney disease including those on dialysis. Seminars in dialysis. 2018
29. Greenland P, LaBree L, Azen SP, Doherty TM, Detrano RC. Coronary artery calcium score combined with Framingham score for risk prediction in asymptomatic individuals. Jama. 2004;291:210-5
30. Wilson PW, Kauppila LI, O'Donnell CJ, Kiel DP, Hannan M, Polak JM. et al. Abdominal aortic calcific deposits are an important predictor of vascular morbidity and mortality. Circulation. 2001;103:1529-34
31. Onuma OK, Pencina K, Qazi S, Massaro JM, D'Agostino RB Sr, Chuang ML. et al. Relation of Risk Factors and Abdominal Aortic Calcium to Progression of Coronary Artery Calcium (from the Framingham Heart Study). The American journal of cardiology. 2017;119:1584-9
32. Cho IJ, Chang HJ, Park HB, Heo R, Shin S, Shim CY. et al. Aortic calcification is associated with arterial stiffening, left ventricular hypertrophy, and diastolic dysfunction in elderly male patients with hypertension. Journal of hypertension. 2015;33:1633-41
33. Ronco C, Di Lullo L. Cardiorenal syndrome. Heart failure clinics. 2014;10:251-80
34. Morton RL, Schlackow I, Mihaylova B, Staplin ND, Gray A, Cass A. The impact of social disadvantage in moderate-to-severe chronic kidney disease: an equity-focused systematic review. Nephrology, dialysis, transplantation: official publication of the European Dialysis and Transplant Association - European Renal Association. 2016;31:46-56
35. Colbert G, Jain N, de Lemos JA, Hedayati SS. Utility of traditional circulating and imaging-based cardiac biomarkers in patients with predialysis CKD. Clinical journal of the American Society of Nephrology: CJASN. 2015;10:515-29
36. Nishimura M. A New Factor for Vascular Calcification in Chronic Kidney Disease: Computed Tomography-Based Renal Parenchymal Volume. Journal of atherosclerosis and thrombosis. 2017;24:1085-7
37. Nagueh SF, Smiseth OA, Appleton CP, Byrd BF 3rd, Dokainish H, Edvardsen T. et al. Recommendations for the Evaluation of Left Ventricular Diastolic Function by Echocardiography: An Update from the American Society of Echocardiography and the European Association of Cardiovascular Imaging. Journal of the American Society of Echocardiography: official publication of the American Society of Echocardiography. 2016;29:277-314
Author contact
![]() Corresponding author: A/Prof. Kyosuke Takeshita, MD, PhD, FAHA. Department of Clinical Laboratory, Saitama Medical Centre, Saitama Medical University, 1981 Kamoda Kawagoe, Saitama, Japan. Tel: +81 49 228 3839; Fax: +81 49 226 3091 E-mail: kyousukeac.jp
Corresponding author: A/Prof. Kyosuke Takeshita, MD, PhD, FAHA. Department of Clinical Laboratory, Saitama Medical Centre, Saitama Medical University, 1981 Kamoda Kawagoe, Saitama, Japan. Tel: +81 49 228 3839; Fax: +81 49 226 3091 E-mail: kyousukeac.jp
Received 2018-12-28
Accepted 2019-5-11
Published 2019-6-7