ISSN: 1449-1907International Journal of Medical Sciences

Int J Med Sci 2019; 16(4):519-528. doi:10.7150/ijms.29296 This issue Cite
Research Paper
Visceral Adipose Tissue Modulates Radiosensitivity in Oesophageal Adenocarcinoma
Ann Marie Mongan1, Niamh Lynam-Lennon1, Suzanne L Doyle2, Rory Casey1, Eibhlin Carr3, Aoife Cannon1, Melissa J Conroy1, Graham P Pidgeon1, Lorraine Brennan3, Joanne Lysaght1, John V. Reynolds1, Jacintha O'Sullivan1 ![]()
1. Trinity Translational Medicine Institute, Department of Surgery, Trinity College Dublin, St. James's Hospital, Dublin 8, Ireland
2. School of Biological Sciences, Dublin Institute of Technology, Dublin, Ireland.
3. School of Agriculture & Food Science, Science Centre-South, Belfield, Dublin 4, Ireland
Abstract
Oesophageal adenocarcinoma (OAC) is an exemplar model of obesity-associated cancer. Response to neoadjuvant chemoradiotherapy (NA CRT) is a clinical challenge. We examined if visceral adipose tissue and obesity status alter radiosensitivity in OAC.
The radioresistant (OE33R) and radioresponsive (OE33P) OAC isogenic model was cultured with adipose tissue conditioned media from three patient cohorts: non-cancer patients, surgery only OAC patients and NA CRT OAC patients. Cell survival was characterised by clonogenic assay, metabolomic profiling by nuclear magnetic resonance spectroscopy and adipokine receptor gene expression by qPCR. A retrospective in vivo study compared tumour response to NA CRT in normal weight (n=53) versus overweight/obese patients (n=148).
Adipose conditioned media (ACM) from all patient cohorts significantly increased radiosensitivity in radioresistant OE33R cells. ACM from the NA CRT OAC cohort increased radiosensitivity in OE33P cells. Metabolomic profiling demonstrated separation of the non-cancer and surgery only OAC cohorts and between the non-cancer and NA CRT OAC cohorts. Gene expression profiling of OE33P versus OE33R cells demonstrated differential expression of the adiponectin receptor-1 (AR1), adiponectin receptor-2 (AR2), leptin receptor (LepR) and neuropilin receptor-1 (NRP1) genes. In vivo overweight/obese OAC patients achieved an enhanced tumour response following NA CRT compared to normal weight patients. This study demonstrates that visceral adipose tissue modulates the cellular response to radiation in OAC.
Keywords: oesophageal cancer, obesity, radiotherapy, visceral adipose tissue
Introduction
Oesophageal adenocarcinoma (OAC) is an aggressive disease with five-year survival rates of approximately 20%, and 40% for patients who are treated with curative intent (1). For locally advanced disease, neoadjuvant chemoradiation (NA CRT) is increasingly the standard of care (2-4). The CROSS trial demonstrated that NA CRT followed by surgery was associated with a greater than two-fold increase in median overall survival compared with surgery alone (2,3). A meta-analysis including CROSS and eleven randomised controlled trials (RCTs) of multimodal therapy compared with surgery alone concluded that NA CRT was associated with a significant improvement in overall survival (4). Tumour response to NA CRT predicts survival, but resistance to therapy remains a significant clinical problem with only 14-45% of patients achieving a complete pathological response (pCR) (2-4).
OAC is an examplar model of an obesity- associated cancer, and obesity may underlie the marked increase in the incidence of OAC (1,5-7). Although the epidemiologic association between obesity and adenocarcinoma is well described, the impact of obesity on tumour biology, response to therapy, and outcomes, is unclear. Several studies have shown that obesity is associated with increased risk of cancer recurrence and death, (8-10), while others have reported no difference in survival between obese and non-obese patients (11-14). Importantly, obesity status may play differential roles in tumour development during treatment and following surgery.
The relationship between visceral adipose tissue (VAT) and radioresponse has not been investigated. The radioresistant phenotype is correlated with features such as altered DNA repair (15), cell cycle checkpoint operation (15), telomere biology (16), reactive oxygen species (ROS) biology (17), and induction of apoptosis (15), all of which are hypothesized to be affected by visceral adiposity. Obesity is associated with a state of low-grade chronic inflammation that causes systemic oxidative stress (18,19), a mechanism by which ionizing radiation can damage cells (17). Obesity is associated with alterations in DNA repair mechanisms (20), and radioresistance of OAC is associated with DNA damage repair efficiency (21). Other putative mechanisms linking obesity and aggressive tumour behaviour include adipokine production, the insulin-like growth factor axis and sex steroids (22). Alterations in tumour biology are mediated not by adipocytes, but predominantly by secreted factors from the adipose tissue stromal vascular fraction (23). We have shown that visceral adipose conditioned media (ACM) in OAC patients is a rich source of adiponectin, leptin and VEGF (24), and metabolomic profiling has demonstrated an altered profile in ACM from viscerally obese compared to non-obese OAC patients (25). This current study assesses the interaction between obesity and radioresponse in vitro and in vivo in OAC.
Methods
OAC tumour and adipose tissue biobank
Histologically proven OAC patients undergoing surgical resection, and elective non-oncological gastrointestinal surgeries were recruited to the study with patient consent. Full ethical approval was granted by the Adelaide and Meath Hospital (incorporating the National Children's Hospital) (AMNCH) research ethics committee. Body weight, height, visceral fat area (VFA) and central waist circumference (WC) were measured. Body mass index (BMI) was calculated as weight (kg)/ height2 (m2). WC was measured to the nearest 0.1 cm using a tape measure midway between the uppermost border of the iliac crest and the lower border of the costal margin in the midaxillary line after respiratory exhalation while the patient was in a standing position (26). VFA was calculated from a pre-operative diagnostic computed tomography (CT) scan by an experienced radiologist, using a validated technique (27,28). A VFA in excess of 163.8 cm2 (men) and 80.1 cm2 (women) was classified as obese, or WC in excess of 94cm (men) and 80cm (women) was used where VFA wasn't available (26). Standard operating procedures for the collection, storage and analysis of specimens were used (29).
Visceral adipose tissue processing and cell co-culture with visceral ACM
Omental adipose tissues were excised at the beginning of the surgical resections; adipose tissue was minced, washed with sterile PBS, and cultured in M199 media (Gibco) (5 g adipose tissue in 10mL media) for 72 hours. The adipose tissue culture was filtered to remove adipose tissue fragments and the supernatant (ACM) stored at -80°C. The OE33P and OE33R isogenic model of radioresistance were cultured as previously described (21) and treated with M199 control media or ACM at 37°C in 95% humidified air and 5% CO2 for 24 hours.
Clonogenic assay to assess radiosensitivity
OE33P and OE33R cells were co-cultured for 24 hours with M199 control media or ACM, cells were irradiated with 0 or 2 Gy X-ray radiation using a Gulmay Medical X-ray generator, (RS225) (Gulmay Medical), at a dose rate of 3.25 Gray (Gy) per minute. Cells were cultured for 7-14 days to allow surviving colonies to reach maximum density without merging of colonies. Cells were stained with crystal violet dye for 30 minutes, dye removed and colonies consisting of 50 cells or more counted. Plating efficiencies (PE), which are the fraction of colonies from untreated cells, were calculated using the formula: PE= No. colonies/ No. cells seeded. The surviving fraction (SF), which is the number of colonies produced after treatment, expressed in terms of PE, was calculated using the formula: SF= No. colonies/(No. cells seeded × PE).
Metabolomic profiling
A volume of 250 µL deuterium and 10 µL sodium trimethyl [2,2,3,3-2H4] propionate (TSP) (0.005 g/mL) were added to each 300 µL ACM sample. Spectra were acquired on a 600-MHz Varian nuclear magnetic resonance (NMR) spectrometer (Varian Limited, Oxford, United Kingdom) by using the first increment of a NOESY (Nuclear overhauser effect spectroscopy) pulse (sequence at 251C). 1H NMR ACM spectra were processed with Chenomx software (version 6; Chenomx Edmonton, Canada) and were phase and baseline corrected. Spectra were integrated into bins consisting of spectral regions of 0.001 ppm. The water region was excluded, and data normalized to the total area of the spectral integral. Discriminating metabolites were identified by using libraries of pure metabolites developed in-house and the Chenomx database library. Acquisition of samples resulted in spectra containing a number of peaks, representing proton resonance in 1H NMR.
Adipokine receptor gene expression following co-culture with ACM
Following co-culture of OE33P and OE33R cells with ACM, RNA was isolated using TriReagent and reverse transcribed as previously described (25). Adipokine gene expression (Adiponectin Receptor 1, Adiponectin Receptor 2, Leptin Receptor, Neuropilin- 1), was measured by qPCR using a TaqMan® assay kit (Applied Biosystems), and 18S was used as an endogenous control for data normalisation. Analysis was performed using SDS 2.3 and SDS RQ 1.2 relative quantification software (Applied Biosystems). One sample was set as the calibrator for analysis. Gene expression was expressed as fold difference in expression relative to control.
Retrospective analysis of patient associations between obesity and radiation sensitivity
A retrospective analysis of patients with resectable oesophageal or oesophagogastric junction adenocarcinoma treated with NA CRT (neoadjuvant chemoradiotherapy) at St. James's Hospital was performed. Clinical, pathological and survival data were retrieved from our cancer database. All resected tumours were staged in accordance with the American Joint Committee on Cancer (AJCC) (30). The extent of residual carcinoma in the surgical specimen was assigned a tumour regression grade (31). Tumour regression grade (TRG) 1-3 was considered to represent a good response to therapy, TRG 4-5 a poor response to therapy. Response to therapy was also classified accordinng to the modified Mandard three-point TRG that distinguishes complete, partial, and minimal or non-responders (32).
Statistical Analysis
Statistical analysis was performed using Graphpad Prism 5 software and SPSS version 18 for Windows software. Unless otherwise stated, data were expressed as mean ± standard error of the mean (SEM). Clinical data was expressed as the median. Unpaired t-tests and the Mann-Whitney U test were used to examine statistical significance between unpaired groups of parametric and non-parametric data respectively. Categorical variables were analysed by Chi-square and Fisher's exact tests. One-way analysis of variance (ANOVA) and Tukey multiple comparisons post-hoc test were performed where the number of groups was three or more. RR refers to relative risk, 95% CI to 95% confidence interval. Survival analysis was performed using Kaplan-Meier curves and log-rank test and calculated from date of diagnosis to the first event (recurrence, progression, death or end of the follow-up period).
For metabolomic data analyses, multivariate metabolite data analyses were performed with Simca- P+ software (version 11.0; Umetrics, Umea°, Sweden). The 1H NMR spectra were analysed using two pattern recognition methods; principal component analysis (PCA) (unsupervised) sets to explore any overall trends in the data; and partial least square discriminant analysis (PLS-DA). The variable importance in the projection (VIP) value of each variable in the model was calculated to indicate its contribution to the classification of samples. Variables with a VIP value >1.5 were considered important in discriminating between groups. The quality of all models was judged by the goodness-of-fit parameter (R2) and the predictive ability parameter (Q2), which is calculated by an internal cross-validation of the data and the predictability calculated on a leave-out basis. For all analysis, p ≤0.05 was considered to be statistically significant.
Results
Visceral ACM increases sensitivity to radiation in OE33P and OE33R cells
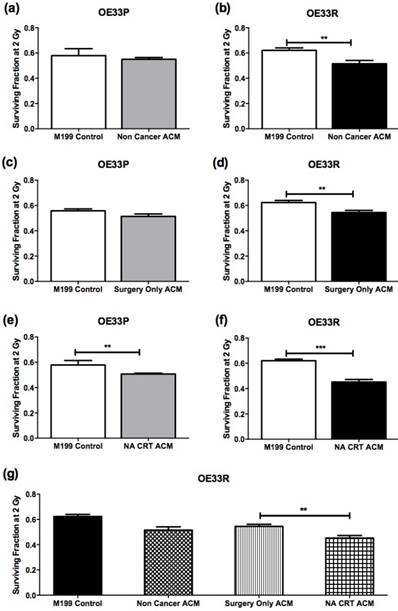
Clonogenic assay was used to assess sensitivity to 2 Gy X-ray radiation in OE33P and OE33R cells following incubation with M199 control media or ACM from non-cancer patients (non-cancer cohort, n=5) (Figure 1A, B), ACM from OAC patients who had not undergone NA CRT prior to surgery (surgery only OAC cohort, n=14) (Figure 1C, D), and ACM from OAC patients who received NA CRT therapy prior to surgery (NA CRT OAC cohort, n=10) (Figure 1E, F). Anthropometric data for patient ACM used in clonogenic assay is summarised in supplementary table 1. OE33P cells incubated with ACM from the non-cancer and surgery only OAC cohort did not demonstrate any significant change in sensitivity to 2 Gy X-ray radiation, when compared to cells incubated with M199 control media (Figure 1A and C). OE33P cells treated with ACM from the NA CRT OAC cohort demonstrated a statistically significant increase in radiosensitivity to 2 Gy, when compared to cells treated with M199 control media (p=0.009, Figure 1E). Interestingly, OE33R cells were significantly more radiosensitive following co-culture with ACM from all three patient groups, the non-cancer cohort (p=0.03, Figure 1B), the surgery only OAC cohort (p=0.002, Figure 1D) and the NA CRT OAC cohort (p<0.0001, Figure 1F), compared to cells treated with M199 control media. Radiosensitivity was significantly increased in OE33R cells treated with ACM from NA CRT OAC patients compared to cells treated with ACM from the radiation naïve OAC patient cohort (p=0.003, Figure 1G). The ACM used in this study was generated from obese and non-obese OAC patients, but no differences in survival fractions of OE33P and OE33R cells were observed when ACM from non-obese compared to obese patients was analysed (data not shown), indicating that it is the visceral adipose tissue itself which can increase radiosensitivity, particularly in cells that are radioresistant.
Metabolomic profiling of ACM from three patient cohorts
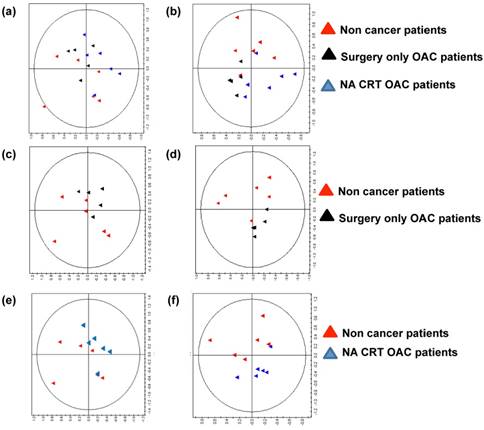
To investigate if the metabolites secreted in ACM differ between the three patient cohorts, we performed metabolomic profiling of ACM using nuclear magnetic resonance spectroscopy (NMR). Anthropometric data for patient ACM used in metabolomic screening is summarised in supplementary table 2. A representtative PCA plot showing separation on the basis of the three patient cohorts (non-cancer, surgery only OAC, and NA CRT OAC patients) is depicted in Figure 2A (R2=0.736). A robust PLS-DA model (Figure 2B) was built to further explore the differences (R2=0.453, Q2= 0.235). To aid comparison and identification or regions of difference a pairwise comparison was performed. The most influential peaks in the models were identified and a metabolite assigned to each peak. Semi-quantitative concentrations were compared between groups for the most influential metabolites.
A PCA plot of 1H NMR ACM data for non- cancer patients versus surgery only OAC patients showed separation of the two cohorts, (R2=0.699, Figure 2C). A PLS-DA model was built to compare ACM profiles from the two cohorts (R2=0.479, Q2= 0.304, Figure 2D). Glucose was significantly increased (p=0.019), whilst threonine (p=0.014) lysine, (p=0.017), and valine (p=0.029) were all significantly decreased in ACM from non-cancer patients, when compared to surgery only OAC patients (Table 1A).
PCA and PLS-DA plots revealed separation between ACM from non-cancer and NA CRT OAC patients (Figure 2E, R2=0.0474, Q2=0.318). ACM from non-cancer patients demonstrated significantly increased glucose (p=0.012) but significantly decreased threonine (p=0.005) lysine, (p=0.004), valine (p=0.007), isoleucine (p=0.039) and glycine (p=0.05) when compared to NA CRT OAC patients (Table 1B).
Adipokine receptor expression differs between OE33P and OE33R at baseline and following culture in visceral ACM
Gene expression of four adipokine receptors representing abundant adipokines in non-obese and obese VAT was assessed in OE33P and OE33R cell lines both at baseline and following co-culture with ACM; adiponectin receptor 1 (AR1); adiponectin receptor 2 (AR2); leptin receptor (LepR); and the VEGF receptor neuropilin-1 (NRP1). Anthropometric data for patient ACM used in these analyses is shown in supplementary table 3.
ACM increases radiosensitivity in OE33P and OE33R. OAC cells were treated with either M199 control media or ACM from non-cancer patients (n=5), ACM from surgery only OAC patients (OAC patients who had not undergone NA CRT) (n=14), or ACM from OAC patients who had previously undergone NA CRT (n=10) for 24hrs, and sensitivity to 2 Gy X-ray radiation was assessed. (A) Co-culture of OE33P cells with ACM from non-cancer patients did not significantly alter radiosensitivity. (B) Co-culture of OE33R cells with ACM from non-cancer patients significantly increased radiosensitivity, when compared to M199 control media (p=0.03). (C) OE33P cells treated with ACM from surgery only OAC patients did not demonstrate significantly altered radiosensitivity. (D) OE33R cells treated with ACM from surgery only OAC patients demonstrated significantly increased sensitivity to 2 Gy, when compared to M199 control media (p=0.002). (E) OE33P cells treated with ACM from NA CRT OAC patients demonstrated significantly increased sensitivity to 2 Gy, when compared to M199 control media (p=0.009). (F) OE33R cells treated with ACM from NA CRT OAC patients demonstrated significantly increased sensitivity to 2 Gy (p<0.0001), when compared to M199 control media. (G) OE33R cells treated with ACM from NA CRT OAC patients showed significantly increased sensitivity to 2 Gy, when compared to cells treated with ACM from surgery only OAC patients (p=0.003). Data are expressed as mean ± SEM. Statistical analysis was performed using unpaired student's t test. Statistical analysis was performed using one-way ANOVA with Tukey post-hoc correction. *p<0.05, **p<0.001, ***p<0.0001
Metabolites discriminating non-cancer patients versus surgery only OAC patients, and non-cancer patients versus NA CRT OAC patients. A. VIPs generated from the PLS-DA of non-cancer patients versus surgery only OAC patients
| Non-cancer | Surgery only OAC | |||||||||
|---|---|---|---|---|---|---|---|---|---|---|
| ppm | VIP [1] | Mean | SD | Mean | SD | Metabolite | P-value | |||
| 1.305 | 6.58509 | 0.0128 | 0.0106 | 0.0304 | 0.008 | Threonine | 0.014 | |||
| 1.865 | 2.22582 | 0.0019 | 0.0014 | 0.0039 | 0.0008 | Lysine | 0.017 | |||
| 3.845 | 2.02298 | 0.0022 | 0.0012 | 0.0005 | 0.0002 | Glucose | 0.019 | |||
| 1.035 | 1.95987 | 0.0011 | 0.001 | 0.0027 | 0.0011 | Valine | 0.029 | |||
| 3.515 | 3.03494 | 0.0008 | 0.0003 | 0.0019 | 0.0013 | Glycerol | NS | |||
| 1.315 | 7.33073 | 0.0492 | 0.0402 | 0.0827 | 0.0277 | Lactate | NS | |||
| 1.325 | 5.31929 | 0.0582 | 0.0484 | 0.0834 | 0.0284 | Lactate | NS | |||
Glucose was significantly increased (p=0.019), whilst threonine (p=0.014) lysine, (p=0.017), and valine (p=0.029) were all significantly decreased in ACM from non-cancer patients, when compared to surgery only OAC patients.
VIP scores are indicated. For each metabolite, only peak is presented here. VIP= Variable in the Projection; PLS-DA= Partial least square discriminant analysis; PPM=Parts per million; NS=Non-significant
VIPs generated from the PLS-DA of non-cancer patients versus NA CRT OAC patients
| Non-cancer | NA CRT OAC | |||||||
|---|---|---|---|---|---|---|---|---|
| ppm | VIP [2] | Mean | SD | Mean | SD | Metabolite | P-value | |
| 1.295 | 5.67466 | 0.0005 | 0.0061 | 0.0114 | 0.0042 | Threonine | 0.005 | |
| 1.885 | 2.18606 | 0.0013 | 0.0005 | 0.0029 | 0.001 | Lysine | 0.004 | |
| 3.745 | 2.09995 | 0.0025 | 0.001 | 0.0011 | 0.0002 | Glucose | 0.012 | |
| 1.035 | 2.26945 | 0.0011 | 0.001 | 0.0029 | 0.0008 | Valine | 0.007 | |
| 3.535 | 5.24455 | 0.0083 | 0.0076 | 0.0205 | 0.0111 | Glycine | 0.05 | |
| 1.225 | 2.15509 | 0.0011 | 0.0017 | 0.003 | 0.0011 | Isoleucine | 0.039 | |
| 1.445 | 3.68593 | 0.0085 | 0.0072 | 0.0023 | 0.0006 | Alanine | NS | |
ACM from non-cancer patients demonstrated significantly increased glucose (p=0.012) but significantly decreased threonine (p=0.005) lysine, (p=0.004), valine (p=0.007), isoleucine (p=0.039) and glycine (p=0.05) when compared to NA CRT OAC patients. P-values are based on unpaired t-test.
VIP scores are indicated. For each metabolite, only peak is presented here. VIP= Variable in the Projection; PLS-DA= Partial least square discriminant analysis; NA CRT=Neoadjuvant chemoradiotherapy; PPM=Parts per million; NS=Non significant
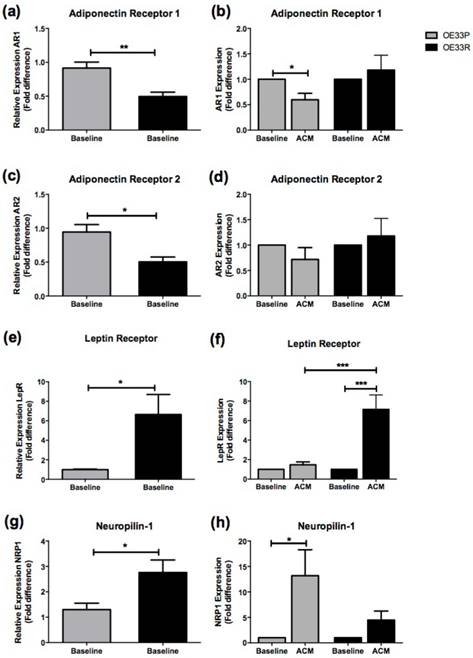
Expression of AR1 was significantly higher in OE33P cells compared to OE33R cells at baseline (p=0.008) (Figure 3A). There was a two-fold downregulation in AR1 expression in OE33P cells following 24 hours of ACM treatment compared to cells treated with control media (p=0.019). ACM treatment did not significantly alter AR1 expression in OE33R cells (Figure 3B). Expression of AR2 was significantly higher in OE33P cells compared to OE33R cells at baseline (p=0.015) (Figure 3C). AR2 expression following ACM treatment was not altered in OE33P or OE33R (Figure 3D).
Interestingly, levels of LepR were significantly lower in OE33P cells compared to OE33R cells at baseline (p=0.033) (Figure 3E). LepR expression was five-fold lower in OE33P compared to OE33R cells treated with ACM (p=0.0004), (Figure 3F). Levels of NRP1 were also significantly lower in OE33P cells compared to OE33R cells at baseline (p=0.038) (Figure 3G). ACM induced a 13-fold upregulation in NRP1 expression in OE33P cells (p=0.047), but did not alter NRP1 expression in OE33R cells (Figure 3H).
Overweight and obese OAC patients demonstrate enhanced radiosensitivity compared to normal weight patients
Between 1990 and 2012, 201 consecutive OAC patients completed neoadjuvant chemoradiotherapy (NA CRT) as part of their curative therapy, and had a surgical resection. Clinical and pathological data for this cohort is summarised in supplementary table 4.
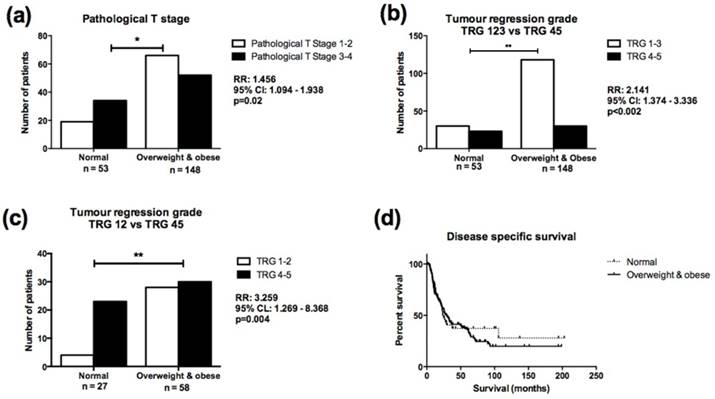
Overweight/obese patients were more likely to have a lower pathological T stage at surgery following NA CRT, when compared to normal weight patients, (Relative Risk (RR) 1.495, 95% Confidence Interval (CI) 1.094-1.938, p=0.02, Figure 4A), despite having similar clinical T stages prior to NA CRT. The number of lymph nodes analysed and lymph node positivity did not differ between normal and overweight/obese cohorts. Overweight/obese patients were more likely to achieve a good TRG response (TRG1-3) compared to normal weight patients (RR=2.141, 95% CI=1.374-3.336, p=0.002, Figure 4B). When patients with TRG 3 were excluded from the analysis, overweight/obese patients were still more likely to achieve a good (TRG 1-2) response following NA CRT (RR=3.259, 95% CI=1.269-8.368, p=0.004, Figure 4C). When classified according to the most recent TRG stratification(29), overweight/obese patients were still more likely to achieve a complete (TRG 1) or partial (TRG 2-3) response following NA CRT (p=0.0025), but the number of patients in each treatment response group was small (Supplementary figure 1). When classified into normal weight, overweight and obese categories, overweight patients were more likely to achieve a good (TRG 1-3) response following NA CRT compared to normal weight patients (RR=2.147, 95% CI=1.294-3.561, p=0.0041) (Supplementary figure 2A). Obese patients were more likely to achieve a good (TRG 1-3) response following NA CRT compared to normal weight patients (RR=2.130, 95% CI=1.157-3.923, p=0.01), (Supplementary figure 2B). There was no difference in TRG response in overweight compared to obese patients (data not shown).
Direct logistic regression was performed to assess the impact of a number of factors on the likelihood of a good TRG response. The model contained six variables (age, gender, smoking history, ASA grade, clinical T stage, BMI classification). Only BMI classification independently predicted TRG response. Overweight and obese patients were three times more likely to achieve a good TRG response after controlling for all other factors in the model (OR=3.376, 95% CI=1.68-6.784, p=0.002). Obesity status was not associated with risk of recurrence and did not affect survival (Figure 4D). Five-year survival was 21%, with overall median disease-specific survival of 27 months (median survival for normal weight patients was 23 months, overweight/obese median survival was 30 months).
Therefore, clinically we have shown that while there was no difference in preoperative clinical T stage between normal weight patients and overweight and obese patients, overweight and obese patients were more likely to have a lower pathological T stage at surgery and to achieve a good TRG response (TRG 1-3) to NA CRT. Obesity status did not influence rates of postoperative morbidity, recurrence or survival.
The metabolic profile is altered in ACM from non-cancer patients compared to ACM from surgery only OAC patients and NA CRT OAC patients. (A) Principal component analysis (PCA) plot of NMR spectra from non-cancer patients (red triangles, n=6), surgery only OAC patients (black triangles, n=6) and NA CRT OAC patients (blue triangles, n=6), showed separation of the three patient cohorts (R2=0.736). (B) A partial least-squares discriminant analysis (PLS-DA) of 1H NMR data from was constructed. Separation of the three cohorts was seen, but the model was weak, (R2=0.453, Q2=0.235). Therefore, pairwise PCA and PLS-DA plots were constructed. (C) PCA plot of 1H NMR ACM data for two patient cohorts (non cancer cohort versus surgery only OAC cohort), (R2=0.699). (D) PLS-DA of 1H NMR ACM data for non-cancer cohort versus surgery only OAC cohort, (R2=0.479, Q2=0.304). (E) PCA plot of non cancer patients versus NA CRT OAC patients (R2=0.547). (F) PLS-DA of 1H NMR plasma data for non-cancer cohort versus NA CRT OAC cohort, (R2=0.474, Q2=0.318). A representative PCA and PLS-DA model showing separation of the surgery only OAC and NA CRT OAC cohorts was constructed, and separation of the two patient cohorts was seen, but the Q2 value indicated that the model was weak (data not shown).
Discussion
Adenocarcinoma of the oesopahgus often presents late and confers a poor prognosis. Although response rates to chemotherapy and radiation therapy have improved, treatment resistance is a significant clinical challenge (1). Analysis of standard clinicopathological parameters does not predict response to NA CRT (30). This study demonstrates for the first time a role for obesity in modulating response to radiation. We show that radiosensitivity was increased in radioresistant OE33R cells treated with ACM, using ACM from three patient cohorts; non-cancer patients, radiation naïve OAC patients, and post NA CRT OAC patients. Therefore, increased radiosensitivity is not merely a bystander effect caused by previous exposure of the fat tissue to radiation, but a response induced by factors from the fat itself. However, radioresistance was lowest in cells treated with ACM from patients who had received NA CRT, suggesting that previous exposure to irradiation may have influenced the visceral fat in these patients, generating a more radioresponsive phenotype, mechanisms of which are unknown. As ACM from non-cancer patient and surgery only patients also decreased radioresistance in the radioresistant cells, this suggest that factors in the ACM driving this effect are not present as a consequence of malignancy, but may be driven by the inflammatory nature of the visceral fat tissue itself. Factors secreted into the tumour microenvironment such as cyclin D1, GDF-15, VEGF and MMP are known to modulate the radioresponse (34-37). Given the complexity of the cellular response to ionizing radiation, it is likely that multiple interacting processes can regulate sensitivity to radiation.
Radioresistance was significantly lower in OE33R cells treated with ACM from NA CRT patients, compared to ACM from the radiation naïve OAC cohort, suggesting the ACM from these two cohorts may have distinct metabolic actions: previous radiation may have stimulated the visceral fat to release metabolites which could further alter the radioresponse. Metabolomic profiling did not demonstrate any difference in metabolites between surgery only ACM and NA CRT OAC patient ACM which might account for the difference in radioresponse seen in our isogenic model. However, ACM from surgery only and NA CRT OAC patients was significantly altered compared to non-cancer patients.
Higher levels of threonine, lysine and valine, and lower levels of glucose were seen in the metabolome of both surgery only and NA CRT OAC patients compared to non-cancer patients. A serum metabolite signature including elevated levels of threonine and isoleucine predicted response to chemotherapy in breast cancer patients (38). Metabolic profiling of OAC patients demonstrated increased serum levels of lysine and glucose in OAC patients, when compared to healthy controls (39). Previous metabolomic analysis of tumour tissue, serum and urine in oesophageal cancer demonstrated variation in the metabolites of glycolysis, lactic acid fermentation and amino acid synthesis in oesophago-gastric cancer (40). We have previously shown that altered energy metabolism is associated with radioresistance in OAC (41). Future analysis may allow identification of the metabolic pathways in adipose tissue associated with modulation of cancer risk in obese individuals. Mass spectrometry- based metabolomics has demonstrated utility for identifying biomarkers of ionizing radiation exposure in cellular, mouse and rat in vivo radiation models (42). In addition, metabolomic mapping of ovarian, endometrial, lung, renal and colorectal cancer have demonstrated alterations in serum or urine profiles (43). Systemic alterations in the metabolomic profile of urine and serum may influence the radioresponse in obese individuals; however they cannot explain the local effect of ACM on radioresponse in OAC cells, indicating that other mechanisms must play a greater role, possibly differential expression of adipokine receptors.
Adipokine receptor expression is altered in radioresistant OAC cells. Expression of a panel of adipokine receptors was assessed in OE33P and OE33R cell lines at baseline and following treatment with ACM from OAC patients, using qPCR. (A) Expression of AR1 was significantly higher in OE33P compared to OE33R at baseline (p=0.008). (B) ACM induced a significant downregulation of AR1 expression in OE33P cells (p=0.019) but did not alter AR1 expression in OE33R. (C) Basal AR2 expression is significantly increased in OE33P cells, when compared to OE33R (p=0.015). (D) No significant difference in AR2 expression was demonstrated in OE33P or OE33R cells treated with ACM for 24 hours. (E) Basal LepR expression was significantly lower in OE33P, when compared to OE33R (p=0.033). (F) ACM treatment did not alter LepR expression in OE33P. LepR expression was significantly increased in OE33R cells following ACM treatment (p=0.006). LepR expression was significantly increased in OE33R compared to OE33P cells treated with ACM (p=0.0004) (G) NRP1 expression was significantly lower in OE33P compared to OE33R (p=0.038). (H) ACM significantly upregulated NRP1 expression in OE33P cells (p=0.047), however NRP1 expression in OE33R cells was not altered following ACM treatment. Data are expressed as mean ± SEM. Statistical analysis was performed using unpaired two-tailed student's t-test to compare expression in OE33P versus OE33R and paired two-tailed student's t-test to compare ACM treated cells versus control; *p<0.05, **p<0.001, ***p<0.0001.
Our study demonstrated that baseline adipokine receptor expression differs between OE33P and OE33R. AR1 and AR2 expression was higher in OE33P compared to OE33R, while LepR and NRP1 expression was lower in OE33P compared to OE33R. Furthermore, following ACM treatment, expression of LepR was higher in OE33R compared to OE33P.
Adiponectin is the most abundant adipokine (44), and over 90% of OACs express AR1 and AR2 (45). High expression of AR1 and AR2 is associated with prolonged survival in lung, thyroid and gastric cancer (46-49). These findings are consistent with our in vitro data demonstrating that AR1 and AR2 levels are higher in radioresponsive compared to radioresistant cancer. Adiponectin has been shown to inhibit tumour growth in animals (44), and recombinant adiponectin has antiproliferative and proapoptotic effects on oesophageal adenocarcinoma cell lines that express both AR1 and AR2 (50, 51), which may potentially contribute to delaying recovery from DNA damage following irradiation, enhancing radiosensitivity.
Expression of LepR and NRP1 correlates with aggressive tumour behaviour in OAC, and poor prognosis in a range of cancers (45,52-59), however, their association with radiosensitivity status has not been investigated. We showed that LepR and NRP1 are upregulated in radioresistant OAC. We and others have demonstrated that leptin promotes cell proliferation, angiogenesis and metalloproteinase expression in oesophageal and colonic cancer cell lines (45,60-63). The obese db/db mouse, which lacks a functional LepR, demonstrates increased susceptibility to radiation (64), and leptin upregulation is known to suppress therapy-induced apoptosis by inhibiting caspase activation (65).
Our in vitro results demonstrating that ACM influences radiosensitivity were further supported by clinical data indicating an association between increased adiposity and improved radioresponse. Only 15-45% of patients undergoing NA CRT achieve a complete pathologic response and subsequently, have improved outcomes (66). It is not understood why tumours of identical pre-treatment stage, undergoing identical neo-adjuvant regimens, respond differently to NA CRT (66-70). Our study suggests that BMI status influences tumour regression in OAC. We have shown that patients who were overweight or obese were more likely to have a lower pathological T stage than normal weight patients, despite having similar clinical T stages prior to treatment, and were more likely to achieve a good tumour regression grade than normal weight patients. Our results were consistent across a number of TRG classification systems. Shridhar et al. specifically examined oncological and survival outcomes in a cohort of OAC patients who received NA CRT; BMI was not associated with tumour response (13). In our study, obesity status was not associated with recurrence or survival. Four studies investigating outcomes in OAC patients in relation to BMI have included a cohort of patients who received NA CRT, none of which demonstrated a difference in survival between obese and non-obese patients (11-14). Improved TRG outcome indicates improved locoregional control- however the effect on survival in obese patients may be offset by associated morbidities, salvage systemic therapies, early metastic events or treatment toxicity. A limitation of this retrospective study is the use of BMI obtained at the time of diagnosis, which might not reflect changes in BMI that occurred before diagnosis, and visceral fat area measurement of obesity might have more closely mirrored the obesity status (71-73) and should be the focus of future studies.
Importantly, this study was strengthened by the focus on a homogeneous patient population of non-metastatic OAC patients that were all treated with NA CRT followed by resection, reducing the possibility of outcome differences due to stage or treatment differences. Our findings linking obesity and radiation response may translate into other cancer types and outcomes.
Overweight/obese patients demonstrate enhanced response to NA CRT compared to normal weight OAC patients. (A) Normal weight patients were more likely to have higher pathological T stage (T stage 3-4) at resection, following NA CRT, when compared to overweight/obese patients (RR=1.456, 95% CI=1.094-1.938, p=0.02). (B) Overweight/obese patients were twice as likely to achieve a good (TRG 1-3) response following NA CRT, when compared to normal weight patients (RR=2.141, 95% CI=1.374-3.336, p=0.002). (C) When patients with TRG 3 were excluded from the analysis, overweight/obese patients were three times as likely to achieve a good (TRG 1-2) response following NA CRT, when compared to normal weight patients (RR=3.259, 95% CI=1.269-8.368, p=0.004). (D) There was no statistically significant difference in survival in normal weight compared to overweight/obese patients. Median survival was 23 and 30 months respectively. Comparison of patient cohorts in terms of pathological T stage and TRG was performed using χ2 test. A p value of ≤0.05 was considered to be statistically significant. *p<0.05, **p<0.001; RR=relative risk; 95% CI=95% confidence interval. Survival was calculated from date of diagnosis to the first event (i.e. death or end of the follow-up period). Survival analysis was performed using Kaplan-Meier curves and log-rank test.
Conclusions
This study suggests a link between obesity status and response to radiation. Further work is warranted to determine functionally the connection between these two processes.
Supplementary Material
Supplementary figures and tables.
Acknowledgements
We would like to thank the members of the oesophageal surgical team at St. James's Hospital. We would also like to thank all the patients who gave their consent for sample procurement. This work was supported by funding from the Health Research Board (HPF/2011/59).
Competing Interests
The authors have declared that no competing interest exists.
References
1. Enzinger PC, Mayer RJ. Esophageal cancer. N Engl J Med. 2003Dec;349(23):2241-52
2. van Hagen P, Hulshof MC, van Lanschot JJ. et al. Preoperative chemoradiotherapy for esophageal or junctional cancer. N Engl J Med. 2012May31;366(22):2074-84
3. Oppedijk V, van der Gaast A, van Lanschot JJB. et al. Patterns of recurrence after surgery alone versus preoperative chemoradiotherapy and surgery in the CROSS trials. J Clin Oncol. 2014Feb;32(5):385-91
4. Sjoquist KM, Burmeister BH, Smithers BM. et al. Survival after neoadjuvant chemotherapy or chemoradiotherapy for resectable oesophageal carcinoma: an updated meta-analysis. Lancet Oncol. 2011Jul;12(7):681-92
5. Renehan AG, Tyson M, Egger M. et al. Body-mass index and incidence of cancer: a systematic review and meta-analysis of prospective observational studies. Lancet. 2008Feb16;371(9612):569-78
6. Calle EE, Kaaks R. Overweight, obesity and cancer: epidemiological evidence and proposed mechanisms. Nat Rev Cancer. 2004Aug;4(8):579-91
7. Lagergren J. Adenocarcinoma of oesophagus: what exactly is the size of the problem and who is at risk?. Gut. 2005Mar;54(Suppl 1):i1-5
8. Sinicrope F, Foster NR, Sargent DJ. et al. Obesity is an independent prognostic variable in colon cancer surviviors. Clin Cancer Res. 2010Mar15;16(6):1884-93
9. Palma D, Pickles T & Tyldesley S; Prostate Cohort Outcomes Initiative. Obesity as a predictor of biochemical recurrence and survival after radiation therapy for prostate cancer. BJU Int. 2007Aug;100(2):315-9
10. Meyerhardt JA, Tepper JE, Niedwiecki D. et al. Impact of body mass index on outcomes and treatment-relatedtoxicity in patients with stage II and III rectal cancer: findings from Intergroup Trial 0114. J Clin Oncol. 2004Feb15;22(4):648-57
11. Healy LA, Ryan AM, Gopinath B. et al. Impact of obesity on outcomes in the management of localized adenocarcinoma of the esophagus and esophagogastric junction. J Thorac Cardiovasc Surg. 2007Nov;134(5):1284-1291
12. Morgan MA, Lewis WG, Hopper AN. et al. Prognostic significance of body mass indices for patients undergoing esophagectomy for cancer. Dis Esophagus. 2007;20(1):29-35
13. Shridhar R, Hayman T, Hoffe SE. et al. Body mass index and survival in esophageal adenocarcinoma treated with chemoradiotherapy followed by esophagectomy. J Gastrointest Surg. 2012Jul;16(7):1296-302
14. Wang J, Myles B, Wei C. et al. Obesity and outcomes in patients treated with chemoradiotherapy for esophageal carcinoma. Dis Esophagus. 2014;27(2):168-75
15. Maity A, Kao GD, Muschel RJ. et al. Potential molecular targets for manipulating the radiation response. Int J Radiat Oncol Biol Phys. 1997Feb;37(3):639-53
16. Mcilrath J, Bouffler SD, Samper E. et al. Telomere Length Abnormalities in Mammalian Radiosensitive Cells. Cancer Res. 2001;61(3):912-5
17. Diehn M, Cho RW, Lobo NA. et al. Association of reactive oxygen species levels and radioresistance in cancer stem cells. Nature. 2009Apr9;458(7239):780-3
18. Furukawa S, Fujita T, Shimabukuro M. et al. Increased oxidative stress in obesity and its impact on metabolic syndrome. J Clin Invest. 2004Dec;114(12):1752-61
19. Fyhrquist F, Saijonmaa O. Telomere length and cardiovascular aging. Ann Med. 2012;44:S138-42
20. McCullough LE, Eng SM, Bradshaw PT. et al. Genetic polymorphisms in DNA repair and oxidative stress pathways may modify the association between body size and postmenopausal breast cancer. Ann Epidemiol. 2015Apr;25(4):263-9
21. Lynam-Lennon N, Reynolds J V, Pidgeon GP. et al. Alterations in DNA repair efficiency are involved in the radioresistance of esophageal adenocarcinoma. Radiat Res. 2010Dec;174(6):703-11
22. Donohoe CL, Doyle SL, Reynolds J V. Visceral adiposity, insulin resistance and cancer risk. Diabetol Metab Syndr. 2011Jan;3(1):12
23. Allott EH, Morine MJ, Lysaght J. et al. Elevated Tumor Expression of PAI-1 and SNAI2 in Obese Esophageal Adenocarcinoma Patients and Impact on Prognosis. Clin Transl Gastroenterol. 2012Jan;3:e12
24. Lysaght J, van der Stok EP, Allott EH. et al. Pro-inflammatory and tumour proliferative properties of excess visceral adipose tissue. Cancer Lett. 2011Dec15;312(1):62-72
25. Lynam-Lennon N, Connaughton R, Carr E. et al. Excess visceral adiposity induces alterations in mitochondrial function and energy metabolism in esophageal adenocarcinoma. BMC Cancer. 2014Jan;14:907
26. Doyle SL, Bennett AM, Donohoe CL. et al. Establishing computed tomography-defined visceral fat area thresholds for use in obesity-related cancer research. Nutr Res. 2013Mar;33(3):171-9
27. Miller KD, Jones E, Yanovski JA. et al. Visceral abdominal-fat accumulation associated with use of indinavir. Lancet. 1998Mar21;351(9106):871-5
28. Baumgartner RN, Heymsfield SB, Roche AF. et al. Abdominal composition quantified by computed tomography. Am J Clin Nutr. 1988Oct;48(4):936-45
29. Ennis DP, Pidgeon GP, Millar N. et al. Building a bioresource for esophageal research: lessons from the early experience of an academic medical center. Dis Esophagus. 2010Jan;23(1):1-7
30. Sobin LH, Gospodarowicz M, Wittekind C, editors. Wiley: TNM Classification of Malignant Tumours, 7th Edition - Leslie H. Sobin, Mary K. Gospodarowicz, Christian Wittekind. 7th Edition. Oxford. 2009
31. Mandard AM, Dalibard F, Mandard JC, Marnay J, Henry-Amar M, Petiot JF. et al. Pathologic assessment of tumor regression after preoperative chemoradiotherapy of esophageal carcinoma. Clinicopathologic correlations. Cancer. 1994Jun1;73(11):2680-6
32. Donohoe CL, O'Farrell NJ, Grant T. et al. Classification of pathologic response to neoadjuvant therapy in esophageal and junctional cancer: assessment of existing measures and proposal of a novel 3-point standard. Ann Surg. 2013Nov;258(5):784-92
33. Chirieac LR, Swisher SG, Ajani JA. et al. Posttherapy pathologic stage predicts survival in patients with esophageal carcinoma receiving preoperative chemoradiation. Cancer. 2005Apr1;103(7):1347-55
34. Zhang L, Ge W, Hu K. et al. Endostar down-regulates HIF-1 and VEGF expression and enhances the radioresponse to human lung adenocarcinoma cancer cells. Mol Biol Rep. 2012;39(1):89-95
35. Hinz M, Krappmann D, Eichten A. et al. NF-kappaB function in growth control: regulation of cyclin D1 expression and G0/G1-to-S-phase transition. Mol Cell Biol. 1999Apr;19(4):2690-8
36. Wen QL, Meng MB, Yang B. et al. Endostar, a recombined humanized endostatin, enhances the radioresponse for human nasopharyngeal carcinoma and human lung adenocarcinoma xenografts in mice. Cancer Sci. 2009Aug;100(8):1510-9
37. Sándor N, Schilling-Tóth B, Kis E. et al. Growth Differentiation Factor-15 (GDF-15) is a potential marker of radiation response and radiation sensitivity. Mutat Res Genet Toxicol Environ Mutagen. 2015Nov;793:142-9
38. Wei S, Liu L, Zhang J. et al. Metabolomics approach for predicting response to neoadjuvant chemotherapy for breast cancer. Mol Oncol. 2013Jun6;7(3):297-307
39. Zhang J, Liu L, Wei S. et al. Metabolomics study of esophageal adenocarcinoma. J Thorac Cardiovasc Surg. 2011Feb;141(2):469-75 475-4
40. Abbassi-Ghadi N, Kumar S, Huang J. et al. Metabolomic profiling of oesophago-gastric cancer: a systematic review. Eur J Cancer. 2013;49(17):3625-37
41. Lynam-Lennon N, Maher SG, Maguire A. et al. Altered mitochondrial function and energy metabolism is associated with a radioresistant phenotype in oesophageal adenocarcinoma. PLoS One. 2014Jan;9(6):e100738
42. Johnson CH, Patterson AD, Krausz KW. et al. Radiation metabolomics. 5. Identification of urinary biomarkers of ionizing radiation exposure in nonhuman primates by mass spectrometry-based metabolomics. Radiat Res. 2012Oct;178(4):328-40
43. Nicholson JK, Holmes E, Kinross JM. et al. Metabolic phenotyping in clinical and surgical environments. Nature. 2012Nov15;491(7424):384-92
44. Rose DP, Komninou D, Stephenson GD. Obesity, adipocytokines, and insulin resistance in breast cancer. Obes Rev. 2004Aug;5(3):153-65
45. Howard JM, Beddy P, Ennis D. et al. Associations between leptin and adiponectin receptor upregulation, visceral obesity and tumour stage in oesophageal and junctional adenocarcinoma. Br J Surg. 2010Jul;97(7):1020-7
46. Abdul-Ghafar J, Park S, Wairagu P. Expression of Adiponectin Receptor 1 Is Indicative of Favorable Prognosis in Non-small Cell Lung Carcinoma. Tohoku J Exp Med. 2012:153-62
47. Barresi V, Grosso M, Giuffrè G. et al. The expression of adiponectin receptors Adipo-R1 and Adipo-R2 is associated with an intestinal histotype and longer survival in gastric carcinoma. J Clin Pathol. 2009Aug;62(8):705-9
48. Tsukada T, Fushida S, Harada S. et al. Adiponectin receptor-1 expression is associated with good prognosis in gastric cancer. J Exp Clin Cancer Res. 2011Jan;30:107
49. Cheng S-P, Liu C-L, Hsu Y-C. et al. Expression and biologic significance of adiponectin receptors in papillary thyroid carcinoma. Cell Biochem Biophys. 2013Mar;65(2):203-10
50. Konturek PC, Burnat G, Rau T. et al. Effect of adiponectin and ghrelin on apoptosis of Barrett adenocarcinoma cell line. Dig Dis Sci. 2008Mar;53(3):597-605
51. Ogunwobi OO, Beales ILP. Globular adiponectin, acting via adiponectin receptor-1, inhibits leptin-stimulated oesophageal adenocarcinoma cell proliferation. Mol Cell Endocrinol. 2008Mar26;285(1-2):43-50
52. Escudero-Esparza A, Martin TA, Douglas-Jones A. et al. PGF isoforms, PLGF-1 and PGF-2 and the PGF receptor, neuropilin, in human breast cancer: prognostic significance. Oncol Rep. 2010Feb;23(2):537-44
53. Ghosh S, Sullivan CAW, Zerkowski MP. et al. High levels of vascular endothelial growth factor and its receptors (VEGFR-1, VEGFR-2, neuropilin-1) are associated with worse outcome in breast cancer. Hum Pathol. 2008Dec;39(12):1835-43
54. Broholm H, Laursen H. Vascular endothelial growth factor (VEGF) receptor neuropilin-1's distribution in astrocytic tumors. APMIS. 2004;112(4-5):257-63
55. Stephenson JM, Banerjee S, Saxena NK. et al. Neuropilin-1 is differentially expressed in myoepithelial cells and vascular smooth muscle cells in preneoplastic and neoplastic human breast: a possible marker for the progression of breast cancer. Int J Cancer. 2002Oct10;101(5):409-14
56. Hansel DE, Wilentz RE, Yeo CJ. et al. Expression of neuropilin-1 in high-grade dysplasia, invasive cancer, and metastases of the human gastrointestinal tract. Am J Surg Pathol. 2004Mar;28(3):347-56
57. Lantuéjoul S, Constantin B, Drabkin H. et al. Expression of VEGF, semaphorin SEMA3F, and their common receptors neuropilins NP1 and NP2 in preinvasive bronchial lesions, lung tumours, and cell lines. J Pathol. 2003Jul;200(3):336-47
58. Latil A, Bièche I, Pesche S. et al. VEGF overexpression in clinically localized prostate tumors and neuropilin-1 overexpression in metastatic forms. Int J Cancer. 2000Mar20;89(2):167-71
59. Parikh AA, Fan F, Liu WB. et al. Neuropilin-1 in human colon cancer: expression, regulation, and role in induction of angiogenesis. Am J Pathol. 2004Jun;164(6):2139-51
60. Somasundar P, McFadden DW, Hileman SM. et al. Leptin is a growth factor in cancer. J Surg Res. 2004Mar;116(2):337-49
61. Park HY, Kwon HM, Lim HJ. et al. Potential role of leptin in angiogenesis: leptin induces endothelial cell proliferation and expression of matrix metalloproteinases in vivo and in vitro. Exp Mol Med. 2001Jun30;33(2):95-102
62. Ogunwobi OO, Beales ILP. Leptin stimulates the proliferation of human oesophageal adenocarcinoma cells via HB-EGF and Tgfalpha mediated transactivation of the epidermal growth factor receptor. Br J Biomed Sci. 2008Jan;65(3):121-7
63. Healy LA, Howard JM, Ryan AM. et al. Metabolic syndrome and leptin are associated with adverse pathological features in male colorectal cancer patients. Colorectal Dis. 2012Feb;14(2):157-65
64. Gove ME, Sherry CL, Pini M. et al. Generation of leptin receptor bone marrow chimeras: recovery from irradiation, immune cellularity, cytokine expression, and metabolic parameters. Obesity (Silver Spring). 2010Dec;18(12):2274-81
65. Jiang H, Yu J, Guo H. et al. Upregulation of survivin by leptin/STAT3 signaling in MCF-7 cells. Biochem Biophys Res Commun. 2008Mar28;368(1):1-5
66. Gebski V, Burmeister B, Smithers BM. et al. Survival benefits from neoadjuvant chemoradiotherapy or chemotherapy in oesophageal carcinoma: a meta-analysis. Lancet Oncol. 2007Mar;8(3):226-34
67. Geh JI, Bond SJ, Bentzen SM. et al. Systematic overview of preoperative (neoadjuvant) chemoradiotherapy trials in oesophageal cancer: evidence of a radiation and chemotherapy dose response. Radiother Oncol. 2006Mar;78(3):236-44
68. Cheedella NKS, Suzuki A, Xiao L. et al. Association between clinical complete response and pathological complete response after preoperative chemoradiation in patients with gastroesophageal cancer: analysis in a large cohort. Ann Oncol. 2013May;24(5):1262-6
69. Walsh TN, Noonan N, Hollywood D. et al. A comparison of multimodal therapy and surgery for esophageal adenocarcinoma. N Engl J Med. 1996Aug15;335(7):462-7
70. Luu TD, Gaur P, Force SD. et al. Neoadjuvant chemoradiation versus chemotherapy for patients undergoing esophagectomy for esophageal cancer. Ann Thorac Surg. 2008Apr;85(4):1217-23 -4
71. Balentine CJ, Marshall C, Robinson C, Wilks J, Anaya D, Albo D. et al. Validating quantitative obesity measurements in colorectal cancer patients. J Surg Res. 2010Nov;164(1):18-22
72. Rössner S, Bo WJ, Hiltbrandt E, Hinson W, Karstaedt N, Santago P. et al. Adipose tissue determinations in cadavers-a comparison between cross-sectional planimetry and computed tomography. Int J Obes. 1990Oct;14(10):893-902
73. Klopfenstein BJ, Kim MS, Krisky CM, Szumowski J, Rooney WD, Purnell JQ. Comparison of 3 T MRI and CT for the measurement of visceral and subcutaneous adipose tissue in humans. Br J Radiol. 2012Oct;85(1018):e826-30
Author contact
![]() Corresponding author: Prof. Jacintha O'Sullivan, Professor in Translational Oncology; Telephone: +353 18962149; Email: osullij4ie; Address: Trinity Translational Medicine Institute, Department of Surgery, Trinity College Dublin, St. James's Hospital, Dublin 8, Ireland.
Corresponding author: Prof. Jacintha O'Sullivan, Professor in Translational Oncology; Telephone: +353 18962149; Email: osullij4ie; Address: Trinity Translational Medicine Institute, Department of Surgery, Trinity College Dublin, St. James's Hospital, Dublin 8, Ireland.
Received 2018-8-16
Accepted 2018-10-13
Published 2019-4-5