ISSN: 1449-1907International Journal of Medical Sciences

Int J Med Sci 2015; 12(7):530-537. doi:10.7150/ijms.12164 This issue Cite
Research Paper
Compliance Index, a Marker of Peripheral Arterial Stiffness, may Predict Renal Function Decline in Patients with Chronic Kidney Disease
Te-Hui Kuo1*, Deng-Chi Yang2*, Wei-Hung Lin3,4, Chin-Chung Tseng1, Ju-Yi Chen5, Chin-Shan Ho6, Meng-Fu Cheng1, Wei-Chuan Tsai5 ![]() , Ming-Cheng Wang1,7
, Ming-Cheng Wang1,7 ![]()
1. Division of Nephrology, Department of Internal Medicine, National Cheng Kung University Hospital, College of Medicine, National Cheng Kung University, Tainan, Taiwan
2. Division of Geriatrics and Gerontology, Department of Internal Medicine, National Cheng Kung University Hospital, College of Medicine, National Cheng Kung University, Tainan, Taiwan
3. Department of Internal Medicine, National Cheng Kung University Hospital, College of Medicine, National Cheng Kung University, Tainan, Taiwan
4. Institute of Clinical Medicine, College of Medicine, National Cheng Kung University, Tainan, Taiwan
5. Division of Cardiology, Department of Internal Medicine, National Cheng Kung University Hospital, College of Medicine, National Cheng Kung University, Tainan, Taiwan
6. Graduate Institute of Sports Science, National Taiwan Sport University, Taoyuan, Taiwan
7. Institute of Clinical Pharmacy and Pharmaceutical Sciences, College of Medicine, National Cheng Kung University, Tainan, Taiwan
* Dr. Te-Hui Kuo and Deng-Chi Yang contributed equally to this work.
Abstract
Background: Compliance index derived from digital volume pulse (CI-DVP), measuring the relationship between volume and pressure changes in fingertip, is a surrogate marker of peripheral arterial stiffness. This study investigated if CI-DVP can predict renal function deterioration, cardiovascular events and mortality in patients with chronic kidney disease (CKD).
Methods: In this prospective observational study, 149 CKD patients were included for final analysis. CI-DVP and brachial-ankle pulse wave velocity (baPWV) were measured, decline in renal function was assessed by the estimated glomerular filtration rate (eGFR) slope. Composite renal and cardiovascular outcomes were evaluated, including ≥50% eGFR decline, start of renal replacement therapy, and major adverse events.
Results: Patients in CKD stages 3b to 5 had higher baPWV and lower CI-DVP values than those in patients with CKD stages 1 to 3a. Stepwise multivariate linear regression analysis showed that lower CI-DVP (p =0.0001) and greater proteinuria (p =0.0023) were independent determinants of higher eGFR decline rate. Multivariate Cox regression analysis revealed that CI-DVP (HR 0.68, 95% CI 0.46-1.00), baseline eGFR (HR 0.96, 95% CI 0.94-0.98) and serum albumin (HR 0.17, 95% CI 0.07-0.42) were independent predictors for composite renal and cardiovascular outcomes.
Conclusions: Compliance index, CI-DVP, was significantly associated with renal function decline in patients with CKD. A higher CI-DVP may have independent prognostic value in slower renal function decline and better composite renal and cardiovascular outcomes in CKD patients.
Keywords: Arterial stiffness, Chronic kidney disease, Compliance index, Glomerular filtration rate, Major adverse event
Introduction
Cardiovascular disease is a leading cause of morbidity and mortality in patients with chronic kidney disease (CKD) or end-stage renal disease (ESRD). Previous studies have shown that impaired renal function may predispose to increased arterial stiffness via multiple pathogenic mechanisms, and associated with increased cardiovascular morbidity and mortality [1-3]. Conversely, there is also evidence that increased central or peripheral arterial stiffness, as measured by brachial-ankle pulse wave velocity (baPWV) or ankle-brachial index (ABI), corresponds with renal function and proteinuria and may contribute to renal function deterioration [1, 2-7].
Compliance index derived from digital volume pulse (CI-DVP), measuring the relationship between volume and pressure changes in fingertip, is a surrogate marker of local and peripheral arterial stiffness. Previous studies have shown that there were significant associations among arterial compliance, cardiovascular risk factors and renal function in CKD patients, among CI-DVP, insulin resistance and inflammatory marker in pre-diabetes patients, and between CI-DVP and waist circumference in patients with nonalcoholic fatty liver disease [8-11].
In the current study, renal function was assessed by estimated glomerular filtration rate (eGFR), and CI-DVP as a marker of peripheral arterial stiffness was measured. We investigated if CI-DVP can predict the risk of renal function progression, cardiovascular events and mortality in CKD patients.
Materials and Methods
Study design and population
In this prospective observational study, 174 consecutive CKD patients treated in nephrology clinic at National Cheng Kung University Hospital from July 2008 to June 2009 were evaluated. All patients were followed until start of renal replacement therapy (end stage renal disease, ESRD), death or December 2013, whichever occurred first. The diagnosis and classification of CKD were established according to the criteria of the National Kidney Foundation K/DOQI Clinical Practice Guidelines for Chronic Kidney Disease [12]. The eGFR was determined according to the abbreviated Modification of Diet in Renal Disease (MDRD) and Chronic Kidney Disease Epidemiology Collaboration (CKD-EPI) equations [12, 13]. This study was conducted in accordance with the Declaration of Helsinki and approved by the Institutional Review Board of National Cheng Kung University Hospital. All subjects provided written informed consent for this study.
Demographic data, co-morbidities and cardiovascular medications were reviewed from the medical records and data were analyzed. Diagnosis of diabetes mellitus was made if the fasting plasma glucose concentration is ≥126 mg/dL, hemoglobin A1C ≥6.5% on two separate occasions, or if the patient is receiving insulin or oral antidiabetic agents. Hypertension was diagnosed if blood pressure was ≥140/90 mm Hg on three occasions or if the patient was taking antihypertensive medication. Coronary artery disease was defined by the history of myocardial infarction, angina pectoris, or positive treadmill exercise test. Hyperlipidemia was diagnosed if total serum cholesterol ≥200 mg/dL, triglyceride ≥150 mg/dL, or treatment with lipid-lowering agents. Estimation of daily proteinuria was derived from morning spot urinary protein/creatinine ratio (PCR). Participants were excluded if chronic use of non-steroid anti-inflammatory drugs or the data of interest were insufficient.
Measurements of compliance index and pulse wave velocity
Measurements were performed in an environment kept at 26 ± 1ºC. Brachial arterial BP was measured with sphygmomanometer (HP78354C; Hewlett-Packard Company, Andover, MA) after the patient had been recumbent for at least 10 minutes. BP was the average of 2 readings at 1- to 2- minute intervals. The method to measure compliance index from DVP (CI-DVP) using photoplethysmography and inter- and intra-individual coefficient of variation for CI-DVP were described in our previous studies [14]. The pulse wave analysis software used a Visual Basic (Microsoft Corporation, Redmond, Washington, USA) interface able to analyze the DVPs from right index finger, and to calculate the area under the curve of each DVP automatically. The values of CI-DVP (Unit) were derived by dividing the average area under the curve of the finger DVP in 5 s by the brachial pulse pressure [14]. Patients with arrhythmia, including chronic atrial fibrillation, a pacemaker and frequent premature ventricular contractions, were excluded. baPWV was measured by using a ABI-form device (VP1000, Colin Co. Ltd, Komaki, Japan), which automatically and simultaneously recorded the pulse waves and blood pressure of the brachial and posterior tibial arteries [1, 2].
Outcome evaluations
Three composite outcomes were evaluated: (1) renal outcomes, ≥50% eGFR (CKD-EPI) decline, start of renal replacement therapy (RRT), or all-cause mortality; (2) cardiovascular outcomes, major adverse events (MAEs); (3) composite renal and cardiovascular outcomes, ≥50% eGFR (CKD-EPI) decline, start of RRT, or MAEs. MAEs were defined as all-cause mortality, cardiovascular death, cardiac hospitalization (due to cardiovascular events [i.e. decompensated heart failure with pulmonary congestion, coronary artery disease, fatal or non-fatal myocardial infarction, or electrocardiographically documented arrhythmia requiring hospitalization], and scheduled coronary revascularization [i.e. percutaneous transluminal coronary angioplasty and/or coronary artery bypass surgery]), thromboembolic or hemorrhagic stroke, and newly diagnosed peripheral artery disease [15].
Assessment of decline in renal function
Renal function (serum creatinine and eGFR) was evaluated every 3 to 6 months. Decline rate of renal function was assessed by the eGFR slope, defined as the regression coefficient between eGFR and time in unit of mL/min/1.73 m2/year. At least 3 eGFR measurements were required to evaluate the eGFR slope. We put all the data of eGFR measured for each CKD patient into the calculation of eGFR slope (after excluding the data of acute kidney injury from any cause) to get the best estimate of eGFR slope. A higher decline rate of eGFR was defined as a decline rate ≥2.34 mL/min/1.73 m2/year (a median value of eGFR decline rate). In patients reaching the outcome evaluation, renal function data were censored at development of ≥50% eGFR decline, MAEs, or the start of renal replacement therapy. Renal function was censored at patients' last visit to an outpatient renal clinic or at the end of follow-up.
Statistical analyses
All values are expressed as mean ± SD or frequency (percent) unless otherwise stated. Univariate and stepwise multivariate linear regression analysis was performed to identify the independent factor associated with decline rate of eGFR. Multicollinearity among the independent variables was examined by assessing variance inflation factors (VIF). VIF values above 2.5 were considered to have potential multicollinearity. Kaplan-Meier survival analysis was used with a log-rank test to compare event-free survival between groups. Univariate and multivariate Cox regression analyses were performed to evaluate risk factors predicting the adverse outcomes (ESRD, MAEs, and all-cause mortality). All statistical tests were two-tailed, and P <0.05 was considered statistically significant. Data analysis was performed using the JMP software program (SAS Institute Inc., Cary, NC, USA).
Results
A total of 149 CKD patients were included for final analysis. Their clinical characteristics are shown in Table 1. The baseline serum creatinine and eGFR (CKD-EPI) were 1.5 ± 1.1 mg/dL and 60 ± 28 mL/min/1.73m2, respectively. The mean decline rate of eGFR (CKD-EPI) and duration of follow up were 2.63 ± 2.50 mL/min/1.73m2/year and 51 ± 12 months, respectively. Overall, there were 24 patients having ≥50% eGFR decline, 10 patients entering dialysis (8 hemodialysis and 2 peritoneal dialysis), and 11 cardiovascular events or cardiac deaths during the follow-up period.
The characteristics of CKD patients in relation to early and advanced stages [stages 1 to 3a (n = 93) and stages 3b to 5 (n = 56), respectively] according to the CKD-EPI equation are shown in Table 2. Patients in CKD stages 3b to 5 had a higher prevalence of older age, male gender, hypertension, coronary artery disease, stroke, use of α-adrenergic blockers and antiplatelets, higher values of pulse pressure, baPWV, serum creatinine and proteinuria, and lower values of serum albumin and CI-DVP than those in patients with CKD stages 1 to 3a. The decline rate of eGFR was higher in the advanced CKD group than that in the early CKD group (3.24 ± 2.16 versus 2.28 ± 2.64 mL/min/1.73m2/year, p =0.03). CKD patients with higher decline rate of eGFR had a higher prevalence of diabetes mellitus, hypertension, hyperlipidemia, diabetic nephropathy and statins use, higher values of systolic blood pressure, pulse pressure, baPWV, proteinuria and serum triglyceride, and lower values of serum albumin and CI-DVP.
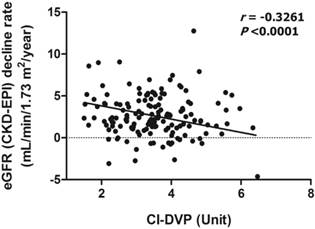
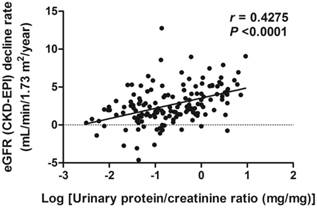
The scatter plots of relations between CI-DVP and decline rate of eGFR as well as between proteinuria and decline rate of eGFR are shown in Figures 1 and 2, respectively. To determine whether CI-DVP is a factor related to the decline of renal function, we performed stepwise multivariate linear regression analysis to determine independent predictors of eGFR decline rate. Lower CI-DVP (p =0.0001) and greater proteinuria (p =0.0023) were independent determinants of higher eGFR decline rate (Table 3).
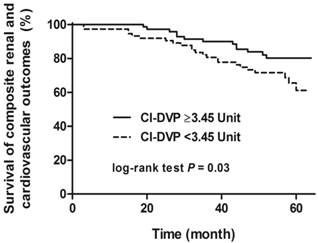
There was no statistically significant difference in event-free survival regarding to the composite renal outcomes or composite cardiovascular outcomes, whereas there was statistically significant difference in event-free survival (log-rank test p =0.03) regarding to the composite renal and cardiovascular outcomes grouped by CI-DVP ≥3.45 Unit (a median value of CI-DVP) (Figure 3). Univariate and multivariate Cox regression models were performed to analyze the factors predicting the composite renal and cardiovascular outcomes. Significant variables in univariate analysis including gender, CI-DVP, eGFR, diabetic nephropathy, serum albumin and hemoglobin were selected for multivariate analysis. The mean arterial pressure, pulse pressure, baPWV and proteinuria were not put into the multivariate model for analysis to avoid potential multicollinearity. CI-DVP was not an independent predictor of composite renal outcomes or composite cardiovascular outcomes. CI-DVP (HR 0.68, 95% CI 0.46-1.00), baseline eGFR (HR 0.96, 95% CI 0.94-0.98) and serum albumin (HR 0.17, 95% CI 0.07-0.42) were independent predictors of composite renal and cardiovascular outcomes.
Correlation between CI-DVP and decline rate of eGFR (CKD-EPI). CI-DVP, compliance index measured by digital volume pulse; eGFR (CKD-EPI), estimated glomerular filtration rate determined according to the Chronic Kidney Disease Epidemiology Collaboration equation.
Correlation between Log (proteinuria) and decline rate of eGFR (CKD-EPI). eGFR (CKD-EPI), estimated glomerular filtration rate determined according to the Chronic Kidney Disease Epidemiology Collaboration equation.
Survival curve for composite renal and cardiovascular outcomes (≥50% eGFR decline, start of renal replacement therapy, or major adverse events) grouped by CI-DVP ≥3.45 Unit (log-rank test P = 0.03). eGFR, estimated glomerular filtration rate; CI-DVP, compliance index derived from digital volume pulse.
Clinical characteristics of 149 patients with chronic kidney disease
| Characteristic | Total n = 149 | |||
|---|---|---|---|---|
| Age (year) | 62 ± 10 | |||
| Gender (male) | 96 (64) | |||
| Body mass index (kg/m2) | 26.2 ± 3.9 | |||
| Background | ||||
| Diabetes mellitus | 58 (39) | |||
| Hypertension | 27 (18) | |||
| Hyperlipidemia | 21 (14) | |||
| Current smoking | 11 (7) | |||
| Coronary artery disease | 5 (3) | |||
| Stroke | 27 (18) | |||
| Peripheral artery disease | 8 (5) | |||
| Systolic blood pressure (mm Hg) | 151 ± 20 | |||
| Diastolic blood pressure (mm Hg) | 88 ± 11 | |||
| Mean arterial pressure (mm Hg) | 109 ± 13 | |||
| Pulse pressure (mm Hg) | 64 ± 15 | |||
| CI-DVP (Unit) | 3.5 ± 1.0 | |||
| baPWV (m/s) | 15.6 ± 2.8 | |||
| Serum creatinine (mg/dL), baseline | 1.5 ± 1.1 | |||
| Serum creatinine (mg/dL), final | 2.5 ± 3.0 | |||
| eGFR (mL/min/1.73 m2) abbreviated MDRD, baseline | 62 ± 30 | |||
| eGFR (mL/min/1.73 m2) abbreviated MDRD, final | 51 ± 30 | |||
| eGFR (mL/min/1.73 m2) CKD-EPI, baseline | 60 ± 28 | |||
| eGFR (mL/min/1.73 m2) CKD-EPI, final | 49 ± 30 | |||
| Decline rate of eGFR (mL/min/1.73 m2/year) CKD-EPI | 2.63 ± 2.50 | |||
| Decline rate of eGFR ≥1.0 mL/min/1.73 m2/year (CKD-EPI ) | 117 (79) | |||
| Urinary protein-creatinine ratio (mg/mg), baseline | 0.862 ± 1.503 | |||
| Chronic kidney disease (abbreviated MDRD vs. CKD-EPI) | ||||
| Stage 1 | 28 (18.8) vs. 29 (19.4) | |||
| Stage 2 | 47 (31.5) vs. 45 (30.2) | |||
| Stage 3 | 3a | 22 (14.8) vs. 19 (12.8) | ||
| 3b | 28 (18.8) vs. 30 (20.1) | |||
| Stage 4 | 19 (12.8) vs. 21 (14.1) | |||
| Stage 5 | 5 (3.4) vs. 5 (3.4) | |||
| Underlying renal disease | ||||
| Diabetic nephropathy | 58 (39) | |||
| Chronic glomerulonephritis | 27 (18) | |||
| Hypertensive nephrosclerosis | 21 (14) | |||
| Urinary tract abnormality | 11 (7) | |||
| Autosomal dominant polycystic kidney disease | 5 (3) | |||
| Others | 27 (18) | |||
| Albumin (g/dL) | 4.3 ± 0.3 | |||
| Cholesterol (mg/dL) | 192 ± 44 | |||
| Triglyceride (mg/dL) | 145 ± 100 | |||
| Low density lipoprotein cholesterol (mg/dL) | 112 ± 31 | |||
| Hemoglobin (g/dL) | 13.2 ± 1.9 | |||
| Medication | ||||
| ACEI/ARB | 93 (62) | |||
| Calcium channel blockers | 101 (68) | |||
| β-Adrenergic blockers | 43 (29) | |||
| α-Adrenergic blockers | 33 (22) | |||
| Diuretics | 57 (38) | |||
| Statins | 61 (41) | |||
| Antiplatelets | 55 (37) | |||
Data are expressed as mean ± SD or number (percentage).
CI-DVP = compliance index derived from digital volume pulse; baPWV = brachial-ankle pulse wave velocity; eGFR = estimated glomerular filtration rate; MDRD = Modification of Diet in Renal Disease; CKD-EPI = Chronic Kidney Disease Epidemiology Collaboration; ACEI = angiotensin-converting enzyme inhibitors; and ARB = angiotensin II receptor blockers.
Clinical Characteristics of 149 CKD Patients in Relation to Early and Advanced Stages
| Characteristic | CKD stages 1-3a (n = 93) | CKD stages 3b-5 (n = 56) | P value | ||
|---|---|---|---|---|---|
| Age (year) | 61 ± 10 | 64 ± 10 | 0.05 | ||
| Gender (male) | 52 (56) | 44 (79) | 0.008 | ||
| Body mass index (kg/m2) | 26.6 ± 4.2 | 25.6 ± 3.3 | 0.15 | ||
| Background | |||||
| Diabetes mellitus | 40 (43) | 27 (48) | 0.61 | ||
| Hypertension | 78 (84) | 54 (96) | 0.03 | ||
| Hyperlipidemia | 84 (90) | 45 (80) | 0.13 | ||
| Current smoking | 9 (10) | 8 (14) | 0.43 | ||
| Coronary artery disease | 4 (4) | 10 (18) | 0.009 | ||
| Stroke | 7 (8) | 11 (20) | 0.04 | ||
| Peripheral artery disease | 4 (4) | 4 (7) | 0.47 | ||
| Systolic blood pressure (mm Hg) | 149 ± 20 | 154 ± 21 | 0.15 | ||
| Diastolic blood pressure (mm Hg) | 88 ± 11 | 88 ± 12 | 0.96 | ||
| Mean arterial pressure (mm Hg) | 108 ± 12 | 110 ± 14 | 0.47 | ||
| Pulse pressure (mm Hg) | 61 ± 15 | 67 ± 15 | 0.05 | ||
| CI-DVP (Unit) | 3.6 ± 1.1 | 3.3 ± 0.9 | 0.04 | ||
| baPWV (m/s) | 15.3 ± 2.8 | 16.2 ± 2.7 | 0.04 | ||
| Serum creatinine (mg/dL), baseline | 1.0 ± 0.3 | 2.4 ± 1.3 | <0.001 | ||
| Serum creatinine (mg/dL), final | 1.1 ± 0.4 | 4.9 ± 3.8 | <0.001 | ||
| eGFR (mL/min/1.73 m2) CKD-EPI, baseline | 78 ± 19 | 30 ± 10 | <0.001 | ||
| eGFR (mL/min/1.73 m2) CKD-EPI, final | 68 ± 21 | 19 ± 11 | <0.001 | ||
| Decline rate of eGFR (mL/min/1.73 m2/year) CKD-EPI | 2.28 ± 2.64 | 3.24 ± 2.16 | 0.03 | ||
| Decline rate of eGFR (mL/min/1.73 m2/year) CKD-EPI, median (interquartile range) | 1.92 (0.84, 3.72) | 3.00 (1.68, 5.04) | 0.009 | ||
| Decline rate of eGFR ≥1.0 mL/min/1.73 m2/year (CKD-EPI) | 68 (73) | 49 (88) | 0.04 | ||
| Urinary protein-creatinine ratio (mg/mg), baseline | 0.353 ± 0.637 | 1.722 ± 2.064 | <0.001 | ||
| Underlying renal disease | 0.26 | ||||
| Diabetic nephropathy | 31 (33) | 27 (48) | |||
| Chronic glomerulonephritis | 16 (17) | 11 (20) | |||
| Hypertensive nephrosclerosis | 15 (16) | 6 (11) | |||
| Urinary tract abnormality | 6 (6) | 5 (9) | |||
| Polycystic kidney disease | 4 (4) | 1 (2) | |||
| Others | 21 (23) | 6 (11) | |||
| Albumin (g/dL) | 4.4 ± 0.4 | 4.3 ± 0.3 | 0.05 | ||
| Cholesterol (mg/dL) | 192 ± 42 | 192 ± 47 | 0.98 | ||
| Triglyceride (mg/dL) | 138 ± 85 | 157 ± 121 | 0.28 | ||
| Low density lipoprotein cholesterol (mg/dL) | 113 ± 30 | 110 ± 33 | 0.63 | ||
| Hemoglobin (g/dL) | 13.8 ± 1.7 | 12.2 ± 1.9 | <0.001 | ||
| Medication | |||||
| ACEI/ARB | 64 (69) | 29 (52) | 0.05 | ||
| Calcium channel blockers | 61 (66) | 40 (71) | 0.48 | ||
| β-Adrenergic blockers | 27 (29) | 16 (29) | 1.00 | ||
| α-Adrenergic blockers | 14 (15) | 19 (34) | 0.009 | ||
| Diuretics | 31 (33) | 26 (46) | 0.12 | ||
| Statins | 36 (39) | 25 (45) | 0.50 | ||
| Antiplatelets | 22 (24) | 33 (59) | <0.001 | ||
Data are expressed as mean ± SD or number (percentage).
Early stages: stages 1 to 3a; advanced stages: stages 3b to 5.
CKD = chronic kidney disease; CKD-EPI = Chronic Kidney Disease Epidemiology Collaboration; CI-DVP = compliance index derived from digital volume pulse; baPWV = brachial-ankle pulse wave velocity; eGFR = estimated glomerular filtration rate; ACEI = angiotensin-converting enzyme inhibitors; and ARB = angiotensin II receptor blockers.
Univariate and Stepwise Multivariate Regression Analyses for Associations of eGFR Decline Rate in 149 CKD Patients
| Univariate analysis | Multivariate analysis | ||||
|---|---|---|---|---|---|
| r | P value | β | P value | ||
| Age (year) | 0.0341 | 0.76 | |||
| Gender (male) | 0.0112 | 0.89 | |||
| Body mass index (kg/m2) | 0.0233 | 0.78 | |||
| Diabetes mellitus | 0.0683 | 0.41 | |||
| Hypertension | 0.2007 | 0.01 | |||
| Hyperlipidemia | 0.1410 | 0.09 | |||
| Current smoking | 0.0621 | 0.45 | |||
| Coronary artery disease | 0.0324 | 0.70 | |||
| Stroke | 0.0164 | 0.84 | |||
| Peripheral artery disease | 0.0873 | 0.29 | |||
| Systolic blood pressure (mm Hg) | 0.2764 | <0.001 | |||
| Diastolic blood pressure (mm Hg) | 0.1676 | 0.04 | |||
| Mean arterial pressure (mm Hg) | 0.2390 | 0.003 | |||
| Pulse pressure (mm Hg) | 0.2456 | 0.003 | |||
| CI-DVP (Unit) | -0.3281 | <0.001 | -0.5248 | 0.0001 | |
| baPWV (m/s) | 0.2613 | 0.001 | |||
| Chronic kidney disease stages 3b-5 | 0.1806 | 0.03 | |||
| Diabetic nephropathy | 0.1531 | 0.06 | |||
| Urinary protein-creatinine ratio (mg/mg), baseline | 0.4018 | <0.001 | 0.3331 | 0.0023 | |
| Albumin (g/dL) | -0.2514 | 0.002 | |||
| Cholesterol (mg/dL) | 0.1058 | 0.20 | |||
| Triglyceride (mg/dL) | 0.1187 | 0.15 | |||
| Low density lipoprotein cholesterol (mg/dL) | -0.0387 | 0.64 | |||
| Hemoglobin (g/dL) | -0.1655 | 0.04 | |||
| ACEI/ARB | 0.1118 | 0.17 | |||
| Calcium channel blockers | 0.1025 | 0.21 | |||
| β-Adrenergic blockers | 0.1030 | 0.21 | |||
| α-Adrenergic blockers | 0.0787 | 0.34 | |||
| Diuretics | 0.0431 | 0.60 | |||
| Statins | 0.1754 | 0.03 | |||
| Antiplatelets | 0.0693 | 0.40 | |||
eGFR = estimated glomerular filtration rate; CKD = chronic kidney disease; CI-DVP = compliance index derived from digital volume pulse; baPWV = brachial-ankle pulse wave velocity; ACEI = angiotensin-converting enzyme inhibitors; and ARB = angiotensin II receptor blockers.
Discussion
The present study evaluated the associations of CI-DVP, a surrogate marker of small peripheral arterial stiffness derived from volume/pressure change in fingertip, with the progression of renal function and cardiovascular outcomes in patients with CKD stages 1 to 5. In this observational cohort study we demonstrated that higher CI-DVP, in addition to lower proteinuria, was an independent predictor of slower eGFR decline rate. CI-DVP was also an independent predictor for composite renal and cardiovascular outcomes.
CKD is associated with increased arterial stiffness, and there is progressive arterial stiffening and increased PWV corresponding with the advance of CKD stage [3, 6]. Kimoto et al. reported that CKD is associated with increased regional arterial stiffness in type 2 diabetes [16]. Longitudinal studies have shown that there is independent association between arterial stiffness and decline of renal function and mortality [1, 2, 17]. Most of these studies measured the arterial stiffness by using an ABI device, which records the pulse wave transmission to the brachial and posterior tibial arteries. The baPWV obtained actually is a summation of both central and peripheral arterial stiffness. Sheen et al. reported that marker of peripheral arterial occlusive disease, ABI, is independently associated with a decline in eGFR [5]. ABI is calculated by dividing the posterior tibial systolic pressure by the brachial systolic pressure. ABI is a simple and useful tool for detecting peripheral arterial disease, and may improve the accuracy of cardiovascular risk prediction beyond the Framingham risk score [18, 19]. Increased arterial stiffness is associated with reduction in the cushioning function of the aorta to buffer cardiac pulsations, may induce high blood pressure, lead to transmission of systemic hypertension to the renal microvasculature, and result in glomerular hypertension and renal damage [1, 20, 21]. Besides, risk factors for arterial stiffening, atherosclerosis and cardiovascular diseases such as hypertension, diabetes mellitus and dyslipidemia have also been considered as risk factors for progression of CKD [22]. This study showed that patients in early CKD stage or with lower decline rate of eGFR had lower baPWV and higher CI-DVP values. It means that these early CKD patients had lower central and peripheral arterial stiffness. Schillaci et al. reported that there was an inverse relationship exists between GFR and stiffness of both central and peripheral arteries in hypertensive patients with normal renal function [23]. Our previous work showed that decrease of CI-DVP was associated with the increase in number of cardiovascular risk factors and CI-DVP was independently associated with eGFR [11]. Tian et al. suggested that peripheral artery disease, defined as ABI <0.9, was a marker to predict the loss of residual renal function in patients receiving peritoneal dialysis [7]. Assessment of small arterial stiffness serves as an earlier marker for vascular disease, rather than PWV, which is pressure-dependent and influenced by long-term structural changes [24]. This study further showed that the surrogate marker of small peripheral arterial stiffness, CI-DVP, was an independent predictor of renal function deterioration in CKD patients. To the best of our knowledge, the present study is the first to demonstrate the association between small peripheral arterial stiffness and decline of renal function in CKD patients. We also demonstrated that higher CI-DVP and baseline eGFR values were independent predictors for better composite renal and cardiovascular outcomes.
Proteinuria indicates the presence of kidney damage from diabetic nephropathy, glomerulonephritis, nephrosclerosis, and other renal or non-renal disorders. Patients with higher level of proteinuria were associated with doubling of serum creatinine and development of ESRD in different CKD stages, in addition to myocardial infarction and all-cause mortality [25]. Higher proteinuria is associated with a faster rate of renal decline, regardless of baseline eGFR in patients with CKD [26]. Proteinuria may cause inflammatory cell infiltration and fibrosis in the interstitium and contribute to progressive renal damage by multiple pathways. The pathogenesis includes upregulation of inflammatory and fibrogenic pathways, induction of tubular cytokines and chemotactants, activation of complement cascade, and tubular cell apoptosis [27-29]. In this study, significant relationships were identified among higher proteinuria and lower CI-DVP and advanced stages of CKD. Higher proteinuria was independently associated with faster eGFR decline.
Previous studies have shown that increased arterial stiffness (baPWV) is associated with higher proteinuria [6, 30]. Higher pulse pressure and ABI were associated with increased proteinuria in subjects with prediabetes, diabetes, or in general population in Japanese cohorts [31, 32]. Our previous report showed that arterial stiffness (stiffness index) is increased in association with proteinuria in non-diabetic patients with essential hypertension [33]. There are several probable mechanisms, including hypertension, dyslipidemia, inflammation and endothelial dysfunction, that link proteinuria with arterial stiffening and increased cardiovascular risk. Proteinuria was a predictor for future development of hypertension in normotensive subjects [34], and the degree of proteinuria was a determinant of the presence of hypertension in CKD patients [35]. Patients with CKD had a higher prevalence of dyslipidemia than the general population, and were at an increased risk for cardiovascular disease [36]. Proteinuric patients had higher levels of serum high-sensitivity C-reactive protein and asymmetric dimethyl-arginine (ADMA), and ADMA level correlated with lower flow-mediated dilatation measurement [37]. ADMA and the L-arginine/ADMA ratio were associated with aortic PWV, and might have a mechanistic role in the aortic stiffening [38]. These may explain part of the mechanism of that proteinuria increases arterial stiffness and cardiovascular morbidity and mortality. Proteinuria might not only reflect renal injury but also associated with a systemic increase in vascular permeability and endothelial dysfunction [39]. The increased transvascular leakage could allow entry of lipoproteins into the vessel wall and contributes to atherogenesis [40, 41]. This study demonstrated that proteinuria is significantly correlated with both central and peripheral arterial stiffness (i.e., baPWV and CI-DVP) in CKD patients.
There are several limitations to our study. Not all important cardiovascular risk factors or medications were included for analysis. Our analysis did not include calcium, phosphate and intact parathyroid hormone because these data were insufficient in certain CKD patients, in particular those in early CKD stage. The enrolled population might have caused a selection bias and lost the association of certain recognized cardiovascular risk factors with arterial stiffness assessed by CI-DVP and baPWV. The relatively small sample size, patient recruitment with CKD stages 1 to 5, and low incidence of ESRD and MAEs may have been underpowered to detect important associations and differences in examined variables, it should be careful to apply our results to patients with similar CKD stage at baseline.
In conclusion, the present study demonstrated that CI-DVP, a surrogate marker of small peripheral arterial stiffness, was significantly associated with renal function decline in patients with CKD. CI-DVP may have independent prognostic value in renal function decline and composite renal and cardiovascular outcomes in CKD patients.
Competing Interests
The authors have declared that no competing interest exists.
References
1. Chen SC, Chang JM, Liu WC. et al. Brachial-ankle pulse wave velocity and rate of renal function decline and mortality in chronic kidney disease. Clin J Am Soc Nephrol. 2011;6:724-32
2. Yoon HE, Shin DI, Kim SJ. et al. Brachial-ankle pulse wave velocity predicts decline in renal function and cardiovascular events in early stages of chronic kidney disease. Int J Med Sci. 2013;10:1430-6
3. Wang MC, Tsai WC, Chen JY, Huang JJ. Stepwise increase in arterial stiffness corresponding with the stages of chronic kidney disease. Am J Kidney Dis. 2005;45:494-501
4. Su HM, Lin TH, Hsu PC. et al. Brachial-ankle pulse wave velocity and systolic time intervals in risk stratification for progression of renal function decline. Am J Hypertens. 2012;25:1002-10
5. Sheen YJ, Lin JL, Li TC, Bau CT, Sheu WH. Peripheral arterial stiffness is independently associated with a rapid decline in estimated glomerular filtration rate in patients with type 2 diabetes. Biomed Res Int. 2013;2013:309294
6. Ohya Y, Iseki K, Iseki C, Miyagi T, Kinjo K, Takishita S. Increased pulse wave velocity is associated with low creatinine clearance and proteinuria in a screened cohort. Am J Kidney Dis. 2006;47:790-7
7. Tian SL, Tian XK, Han QF, Axelsson J, Wang T. Presence of peripheral arterial disease predicts loss of residual renal function in incident CAPD patients. Perit Dial Int. 2012;32:67-72
8. DeLoach SS, Townsend RR. Vascular stiffness: its measurement and significance for epidemiologic and outcome studies. Clin J Am Soc Nephrol. 2008;3:184-92
9. Chou CH, Tsai WC, Wang MC. et al. Effects of deranged glucose homeostasis on peripheral arterial stiffness index in patients with pre-diabetes mellitus. Int Heart J. 2013;54:27-32
10. Chen JY, Chou CH, Tsai WC. et al. Effects of increased systemic inflammation and central obesity on arterial stiffness in patients with nonalcoholic fatty liver disease. J Am Soc Hypertens. 2012;6:253-60
11. Wang MC, Wu AB, Cheng MF, Chen JY, Ho CS, Tsai WC. Association of arterial stiffness indexes, determined from digital volume pulse measurement and cardiovascular risk factors in chronic kidney disease. Am J Hypertens. 2011;24:544-9
12. National Kidney Foundation. K/DOQI Clinical Practice Guidelines for Chronic Kidney Disease: Evaluation, classification, and stratification. Am J Kidney Dis. 2002;39(2 Suppl 1):S1-S266
13. Levey AS, Stevens LA, Schmid CH. et al. A new equation to estimate glomerular filtration rate. Ann Intern Med. 2009;150:604-12
14. Chen JY, Tsai WC, Wu MS. et al. Novel Compliance Index derived from digital volume pulse associated with risk factors and exercise capacity in patients undergoing treadmill exercise tests. J Hypertens. 2007;25:1894-9
15. Dangas GD, Kini AS, Sharma SK. et al. Impact of hemodynamic support with Impella 2.5 versus intra-aortic balloon pump on prognostically important clinical outcomes in patients undergoing high-risk percutaneous coronary intervention (from the PROTECT II randomized trial). Am J Cardiol. 2014;113:222-8
16. Kimoto E, Shoji T, Shinohara K. et al. Regional arterial stiffness in patients with type 2 diabetes and chronic kidney disease. J Am Soc Nephrol. 2006;17:2245-52
17. Elias MF, Davey A, Dore GA, Gillespie A, Abhayaratna WP, Robbins MA. Deterioration in renal function is associated with increased arterial stiffness. Am J Hypertens. 2014;27:207-14
18. Lin JS, Olson CM, Johnson ES, Whitlock EP. The ankle-brachial index for peripheral artery disease screening and cardiovascular disease prediction among asymptomatic adults: a systematic evidence review for the U.S. Preventive Services Task Force. Ann Intern Med. 2013;159:333-41
19. Ankle Brachial Index Collaboration, Fowkes FG, Murray GD. et al. Ankle brachial index combined with Framingham Risk Score to predict cardiovascular events and mortality: a meta-analysis. JAMA. 2008;300:197-208
20. O'Rourke MF, Safar ME. Relationship between aortic stiffening and microvascular disease in brain and kidney: cause and logic of therapy. Hypertension. 2005;46:200-4
21. Bidani AK, Griffin KA, Picken M, Lansky DM. Continuous telemetric blood pressure monitoring and glomerular injury in the rat remnant kidney model. Am J Physiol. 1993;265(3 Pt 2):F391-F398
22. Taal MW, Brenner BM. Predicting initiation and progression of chronic kidney disease: developing renal risk scores. Kidney Int. 2006;70:1694-705
23. Schillaci G, Pirro M, Mannarino MR. et al. Relation between renal function within the normal range and central and peripheral arterial stiffness in hypertension. Hypertension. 2006;48:616-21
24. Cohn JN. Arterial stiffness, vascular disease, and risk of cardiovascular events. Circulation. 2006;113:601-3
25. Hemmelgarn BR, Manns BJ, Lloyd A. et al. Relation between kidney function, proteinuria, and adverse outcomes. JAMA. 2010;303:423-9
26. Turin TC, James M, Ravani P. et al. Proteinuria and rate of change in kidney function in a community-based population. J Am Soc Nephrol. 2013;24:1661-7
27. Eddy AA. Proteinuria and interstitial injury. Nephrol Dial Transplant. 2004;19:277-81
28. Erkan E, Garcia CD, Patterson LT. et al. Induction of renal tubular cell apoptosis in focal segmental glomerulosclerosis: Roles of proteinuria and Fas-dependent pathways. J Am Soc Nephrol. 2005;16:398-407
29. Abbate M, Zoja C, Remuzzi G. How does proteinuria cause progressive renal damage?. J Am Soc Nephrol. 2006;17:2974-84
30. Smith A, Karalliedde J, De Angelis L, Goldsmith D, Viberti G. Aortic pulse wave velocity and albuminuria in patients with type 2 diabetes. J Am Soc Nephrol. 2005;16:1069-75
31. Yano Y, Sato Y, Fujimoto S. et al. Association of high pulse pressure with proteinuria in subjects with diabetes, prediabetes, or normal glucose tolerance in a large Japanese general population sample. Diabetes Care. 2012;35:1310-5
32. Ishida A, Nakachi-Miyagi M, Kinjo K, Iseki K, Ohya Y. A high normal ankle-brachial index is associated with proteinuria in a screened cohort of Japanese: the Okinawa Peripheral Arterial Disease Study. J Hypertens. 2014;32:1435-43
33. Tsai WC, Lin CC, Huang YY, Chen JY, Chen JH. Association of increased arterial stiffness and inflammation with proteinuria and left ventricular hypertrophy in non-diabetic hypertensive patients. Blood Press. 2007;16:270-5
34. Inoue T, Iseki K, Higashiuesato Y. et al. Proteinuria as a significant determinant of hypertension in a normotensive screened cohort in Okinawa, Japan. Hypertens Res. 2006;29:687-93
35. Ridao N, Luño J, García de Vinuesa S, Gómez F, Tejedor A, Valderrábano F. Prevalence of hypertension in renal disease. Nephrol Dial Transplant. 2001;16(Suppl 1):70-3
36. Culleton BF, Larson MG, Wilson PW, Evans JC, Parfrey PS, Levy D. Cardiovascular disease and mortality in a community-based cohort with mild renal insufficiency. Kidney Int. 1999;56:2214-9
37. Yilmaz MI, Sonmez A, Saglam M. et al. ADMA levels correlate with proteinuria, secondary amyloidosis, and endothelial dysfunction. J Am Soc Nephrol. 2008;19:388-95
38. Angel K, Provan SA, Mowinckel P, Seljeflot I, Kvien TK, Atar D. The L-arginine/asymmetric dimethylarginine ratio is improved by anti-tumor necrosis factor-α therapy in inflammatory arthropathies. Associations with aortic stiffness. Atherosclerosis. 2012;225:160-5
39. Paisley KE, Beaman M, Tooke JE, Mohamed-Ali V, Lowe GD, Shore AC. Endothelial dysfunction and inflammation in asymptomatic proteinuria. Kidney Int. 2003;63:624-33
40. Jensen JS, Borch-Johnsen K, Jensen G, Feldt-Rasmussen B. Microalbuminuria reflects a generalized transvascular albumin leakiness in clinically healthy subjects. Clin Sci (Lond). 1995;88:629-33
41. Tabas I, Williams KJ, Borén J. Subendothelial lipoprotein retention as the initiating process in atherosclerosis: update and therapeutic implications. Circulation. 2007;116:1832-44
Author contact
![]() Corresponding authors: Ming-Cheng Wang, M.D., Division of Nephrology, Department of Internal Medicine, National Cheng Kung University Hospital, College of Medicine, National Cheng Kung University, Tainan 70428, Taiwan. Tel: +886-6-2353535 ext. 2594; Fax: +886-6-3028036; E-mail: wangmcncku.edu.tw. Or Wei-Chuan Tsai, M.D., Division of Cardiology, Department of Internal Medicine, National Cheng Kung University Hospital, College of Medicine, National Cheng Kung University, Tainan 70428, Taiwan. Tel: +886-6-2353535 ext. 2392; Fax: +886-6-2753834. E-mail: wctsaiseed.net.tw.
Corresponding authors: Ming-Cheng Wang, M.D., Division of Nephrology, Department of Internal Medicine, National Cheng Kung University Hospital, College of Medicine, National Cheng Kung University, Tainan 70428, Taiwan. Tel: +886-6-2353535 ext. 2594; Fax: +886-6-3028036; E-mail: wangmcncku.edu.tw. Or Wei-Chuan Tsai, M.D., Division of Cardiology, Department of Internal Medicine, National Cheng Kung University Hospital, College of Medicine, National Cheng Kung University, Tainan 70428, Taiwan. Tel: +886-6-2353535 ext. 2392; Fax: +886-6-2753834. E-mail: wctsaiseed.net.tw.
Received 2015-3-18
Accepted 2015-5-18
Published 2015-6-12