ISSN: 1449-1907International Journal of Medical Sciences
- Current issue
- Volume 21; 2024
- Volume 20; 2023
- Volume 19; 2022
- Volume 18; 2021
- Volume 17; 2020
- Archive
- Cover images
- Index & coverage
- Cover suggestion
- Special issues
Introduction
Materials and Methods
Results
Discussion
Supplementary Material
Acknowledgements
Abbreviations
References
Author biography

Int J Med Sci 2014; 11(8):779-787. doi:10.7150/ijms.7405 This issue Cite
Research Paper
Prognostic CpG Methylation Biomarkers Identified by Methylation Array in Esophageal Squamous Cell Carcinoma Patients
I-Ying Kuo1, Jia-Ming Chang2,3, Shih-Sheng Jiang4, Chung-Hsin Chen4, I-Shou Chang4, Bor-Shyang Sheu5, Pei-Jung Lu2, Wei-Lun Chang5, Wu-Wei Lai6, Yi-Ching Wang1,2,7 ![]()
1. Institute of Basic Medical Sciences, National Cheng Kung University, Tainan, Taiwan;
2. Institute of Clinical Medicine, National Cheng Kung University, Tainan, Taiwan;
3. Department of Surgery, Chia-Yi Christian Hospital, Chiayi, Taiwan;
4. National Institute of Cancer Research, National Health Research Institutes, Miaoli, Taiwan;
5. Department of Internal Medicine, National Cheng Kung University Hospital, Tainan, Taiwan;
6. Department of Surgery, National Cheng Kung University Hospital, Tainan, Taiwan;
7. Department of Pharmacology, National Cheng Kung University, Tainan, Taiwan.
Abstract
Background: Esophageal squamous cell carcinoma (ESCC) is an aggressive cancer with poor prognosis. We aimed to identify a panel of CpG methylation biomarkers for prognosis prediction of ESCC patients.
Methods: Illumina's GoldenGate methylation array, supervised principal components, Kaplan-Meier survival analyses and Cox regression model were conducted on dissected tumor tissues from a training cohort of 40 ESCC patients to identify potential CpG methylation biomarkers. Pyrosequencing quantitative methylation assay were performed to validate prognostic CpG methylation biomarkers in 61 ESCC patients. The correlation between DNA methylation and RNA expression of a validated marker, SOX17, was examined in a validation cohort of 61 ESCC patients.
Results: We identified a panel of nine CpG methylation probes located at promoter or exon1 region of eight genes including DDIT3, FES, FLT3, NTRK3, SEPT5, SEPT9, SOX1, and SOX17, for prognosis prediction in ESCC patients. Risk score calculated using the eight-gene panel statistically predicted poor outcome for patients with high risk score. These eight-gene also showed a significantly higher methylation level in tumor tissues than their corresponding normal samples in all patients analyzed. In addition, we also detected an inverse correlation between CpG hypermethylation and the mRNA expression level of SOX17 gene in ESCC patients, indicating that DNA hypermethylation was responsible for decreased expression of SOX17.
Conclusions: This study established a proof-of-concept CpG methylation biomarker panel for ESCC prognosis that can be further validated by multiple cohort studies. Functional characterization of the eight prognostic methylation genes in our biomarker panel could help to dissect the mechanism of ESCC tumorigenesis.
Keywords: esophageal squamous cell carcinoma, CpG methylation, DNA methylation array, pyrosequencing, prognosis.
Introduction
Esophageal cancer is one of the most aggressive cancers with an increasing incidence worldwide. Clinical outcome depends on the disease stage [1]. Most patients with esophageal cancer are diagnosed at advanced stage frequently [2]. There are two predominant subtypes of esophageal cancer, squamous cell carcinoma and adenocarcinoma, which differ both pathologically and epidemiologically. Esophageal squamous cell carcinoma (ESCC) preferentially affects males and exhibits a marked geographical variation in incidence. For example, the regions of highest occurrence are localized in the so-called Asian Esophageal Cancer Belt [3,4], which extends from northern China to northwestern Iran, including Japan and India. In spite of the advances in diagnostic and therapeutic approaches, the prognosis of ESCC remains poor. Therefore, development of sensitive and specific molecular biomarkers for predicting survival outcome is immensely important.
Previous studies have reported that DNA methylation, which usually occurs in CpG dinucleotides, is a major epigenetic modification in mammalian genome. Hypermethylation of CpG islands is an important mechanism to inactivate tumor suppressor genes [5,6]. In addition, DNA methylation is frequently not restricted to a single CpG island but affects multiple independent loci, which is reflective of a widespread deregulation of DNA methylation pattern in different types of tumors [7,8]. However, only a few hypermethylated genes have been identified in ESCC and characterized for their role in ESCC tumorigenesis [9-11] and there is a limited number of studies focusing on prognostic methylation biomarker by genome-wide methylation assay in ESCC [12,13].
In this study, we identified nine CpG methylation biomarkers located at eight different genes for prognosis prediction of ESCC by genome-wide methylation analysis of a screen cohort of ESCC patients and validated the methylation array results by pyrosequencing quantitative methylation assay in a new cohort of ESCC patients. In addition, we confirmed that this panel of eight-gene methylation biomarkers showed significantly increased methylation levels in tumor tissues compared to their corresponding normal samples. A risk score defined using the eight-gene panel could predict poor prognosis of a subset of ESCC patients.
Materials and Methods
Clinical samples of ESCC patients
A total of 61 surgically resected ESCC patients were recruited from the Cancer center, National Cheng Kung University Hospital, Tainan, Taiwan after obtaining appropriate institutional review board permission and informed consent from the patients. Among them, 40 patients were analyzed for genome-wide methylation and candidate genes selection as a training cohort. A validation cohort of 61 patients, including the original 40 patients and the additional 21 patients, was analyzed using pyrosequencing quantitative methylation assay for further prognostic analyses. These 61 patients were also included in the analysis of SOX17 methylation and mRNA expression. Overall survival was calculated from the day of surgery to the date of death or the last follow-up. The end of the follow-up period was defined as October 2012. The mean follow-up period for all patients was 19.6 months (range 1.5-68.0 months). Tumor typing and disease staging were performed according to the World Health Organization classification and the TNM classification system, respectively. Information on the sex, age, and smoking history of the patients were obtained from hospital records. Surgically resected tumor tissue and corresponding normal tissue samples were collected for DNA methylation and mRNA expression analyses.
Genomic DNA extraction and sodium bisulfite conversion
Genomic DNA from primary esophageal tissue samples were extracted using proteinase K digestion and phenol-chloroform extraction. For methylation analyses, 1 µg genomic DNA was used for bisulfite conversion using the EpiTect Bisulfite kit (Qiagen, Duesseldorf, Germany) according to the protocols provided by the manufacturer. All unmethylated cytosines were converted to uracil, then to thymidine during the subsequent PCR step.
The genome-wide methylation analysis platform
Illumina's GoldenGate Genotyping Assay (1505 CpG dinucleotides for 807 genes; Illumina, San Diego, CA, USA) was adapted for DNA methylation detection. Using a four-probe design, the assay is able to differentiate between methylated and unmethylated sequences based on Bead Array technology. DNA targets were generated using a pair of allele-specific and locus-specific oligonucleotides followed by allele-specific extension and ligation. Universal primers were then used for amplification and the resulting products were hybridized to a bead array at sites bearing complementary sequences. The hybridized targets contained a fluorescent label denoting methylated or unmethylated state for a given locus. This value, also known as the β-value, ranges from 0 (unmethylated) to 1 (fully methylated) [14].
Pyrosequencing assay
To quantify cytosine methylation in individual CpG sites of candidate methylation probes identified by methylation array, bisulfite-converted DNA was analyzed using a pyrosequencing system (PyroMark Q24, Qiagen). Pyrosequencing treats each individual CpG site as a C/T polymorphism and generates quantitative data for relative proportion of methylated versus unmethylated allele. Specific pyrosequencing primer and PCR primer were designed for ''target'' CpG sites in the probes to be analyzed. Bisulfite-modified DNA was dissolved in 20 μl H2O, and 1 µl of DNA template was used for PCR amplification. Hot-start PCR was performed using the PyroMark PCR Kit (Qiagen), and pyrosequencing was carried out in accordance with the manufacturer's protocol (Qiagen). The target CpG sites were evaluated by converting the resulting pyrograms to numerical values for peak heights. Primer sequences are listed in Table 1. The percentage of methylation was calculated as the mean of all CpG analyzed [15]. Methylation levels below and above the mean level of all tumor tissues analyzed were defined as low methylation and high methylation, respectively.
Calculation of risk score by multivariate Cox regression
A stepwise multivariate Cox regression analysis, in which the regression coefficients were obtained for eight genes showing significant correlation with patient survival in the training cohort. The risk score of each patient was derived by a summation of methylation level of all eight genes each multiplied by the corresponding coefficient. The equations used are as follows: Risk score = (DDIT3 methylation value × coefficients) + (FES methylation value × coefficients) + (FLT3 methylation value × coefficients) + (NTRK3 methylation value × coefficients) + (SEPT5 methylation value × coefficients) + (SEPT9 methylation value × coefficients) + (SOX1 methylation value × coefficients) + (SOX17 methylation value × coefficients). The SOX17 methylation value was the average methylation level of two CpG probes in the gene. The risk score was then used to classify patients into high risk group or low risk group using the mean of the overall risk scores as the cutoff value.
The Primers Used for Pyrosequencing Analysisa.
| Gene | Primer name | Sequence ( 5'→3' ) | PCR size (bp) |
|---|---|---|---|
| DDIT3 | Biotin-Forward | GGGACACCGCTGATCGTTTAGGTAAGATTTTTTGGTAAGTGATGG | 197 |
| Reverse | ACCAAACAACAAATCCTATAACTCC | ||
| Sequencing | AACCAAATCTCATCC | ||
| FES | Biotin-Forward | GGGACACCGCTGATCGTTTAGTTTAGGGGTTTGGGTTAATTGAAAT | 223 |
| Reverse | ACCCCCACCTAAATAAATCTCTA | ||
| Sequencing | CCCCCACCAACAACTACTCCTAAA | ||
| FLT3 | Forward | GGAGAGGTTGGGTAGAGT | 295 |
| Biotin-Reverse | GGGACACCGCTGATCGTTTATCAACCCCTTTCTCAAAACCTCAAAAATCC | ||
| Sequencing | GGTTTAGTAGGAGAAGTTGTAT | ||
| NTRK3 | Biotin-Forward | GGGACACCGCTGATCGTTTAAGGGGGGGAAGGAAATAA | 288 |
| Reverse | CCACCCTCTATTACAACCCTACAAAATCT | ||
| Sequencing | TCAAACCCTAAAAAATTTTACATCT | ||
| SEPT5 | Biotin-Forward | GGGACACCGCTGATCGTTTAGGTTGGTTAGTGTTTAGTATTGTT | 330 |
| Reverse | TACAAACCCTAACCCTACCTT | ||
| Sequencing | CCTACAACCTACCAAAT | ||
| SEPT9 | Forward | GGTTGGGGTTAGTTTAGGATAGAG | 154 |
| Biotin-Reverse | GGGACACCGCTGATCGTTTAAAAAACCAACTCACAAAATCAAATT | ||
| Sequencing | GGTTAGTTTAGGATAGAGGA | ||
| SOX1 | Forward | GGGGTGGAGGTAAAGATAATAAAAAAAGGT | 393 |
| Biotin-Reverse | GGGACACCGCTGATCGTTTATCCCCCCAACACCTAAAACCAACACATA | ||
| Sequencing | GTGTAGTAGTGGTTAAGTTGTA | ||
| SOX17 (1) | Forward | GTTTGGGAGGGTTGATTGTA | 147 |
| Biotin-Reverse | GGGACACCGCTGATCGTTTAAAATAAACTAAATCACCCACCACTA | ||
| Sequencing | GGTTGATTGTATTTTGGAAT | ||
| SOX17 (2) | Forward | GGGGTTTTTTTTGTATAGATGTGG | 379 |
| Biotin-Reverse | GGGACACCGCTGATCGTTTAAAACTAAATCACCCACCACTAA | ||
| Sequencing | TTT TGTATAGATGTGGTTAATG |
a Pyrosequencing was performed for the nine methylation probes identified by methylation array. Pyrosequencing-PCR was amplified by forward and reverse primers with one labeled with biotin to facilitate further purification. Pyrosequencing-sequencing primer was used to generate the quantitative methylation level of fragment generated by Pyrosequencing-PCR.
RNA extraction and quantitative reverse transcription-PCR (qRT-PCR)
Total RNA was extracted from 61 tissue samples and all cell lines using TRIzol reagent (Invitrogen, Carlsbad, CA, USA). A total of 4 µg RNA was reverse-transcribed into cDNA using High Capacity cDNA Reverse Transcription Kit (Applied Biosystems, Carlsbad, CA, USA) according to the manufacturer's protocols. qRT-PCR was performed to detect SOX17 gene mRNA expression level using the Corbett Rotor-Gene 3000 (Qiagen) with β-actin as an internal control. The primers used for SOX17 are sense 5' ACGCTTTCATGGTGTGGGCTAAG 3' and antisense 5' GTCAGCGCCTTCCACGACTTG 3'; for β-actin are 5' GGCGGCACCACCATGTACCCT 3' and antisense 5' AGGGGCCGGACTCGTCATACT 3'. cDNA was amplified using the QuantiFast SYBR Green PCR Kit (Qiagen) and thermal cycling conditions comprised of 95°C for 5 minutes followed by 45 cycles at 95°C for 10 seconds and 60°C for 30 seconds. Cycle threshold (Ct), the fractional cycle number at which the amount of amplified target reached a fixed threshold, was determined. The concentration ratios of SOX17 were calculated using 2-⊿Ct (⊿Ct = Ct-SOX17 - Ct-β-actin). Data were presented as fold differences relative to SOX17 expression in tumor versus corresponding normal tissues based on calculations of 2-⊿⊿Ct (⊿⊿Ct = ⊿Ct-tumor - ⊿Ct-normal) [16]. The low expression of SOX17 mRNA was defined as 2-⊿⊿Ct value lower than mean of all patients.
Data processing and Statistical analysis
Type III censoring was performed on subjects who were still alive at the end of the study. Overall survival curves were calculated according to the Kaplan-Meier method after the log-rank test. Hazard ratio for survival risk was determined using the Cox regression analysis. The statistical analyses of promoter methylation and RNA expression were performed using Statistical Package for the Social Sciences version 17.0 (SPSS Inc., Headquarters Chicago, IL, USA). Paired t-test was used to compare the relationship between DNA methylation and mRNA level in tumor and corresponding normal tissues from ESCC patients. P<0.05 was considered statistically significant.
Results
Selection of Prognostic CpG Methylation Biomarkers from Methylation Microarray
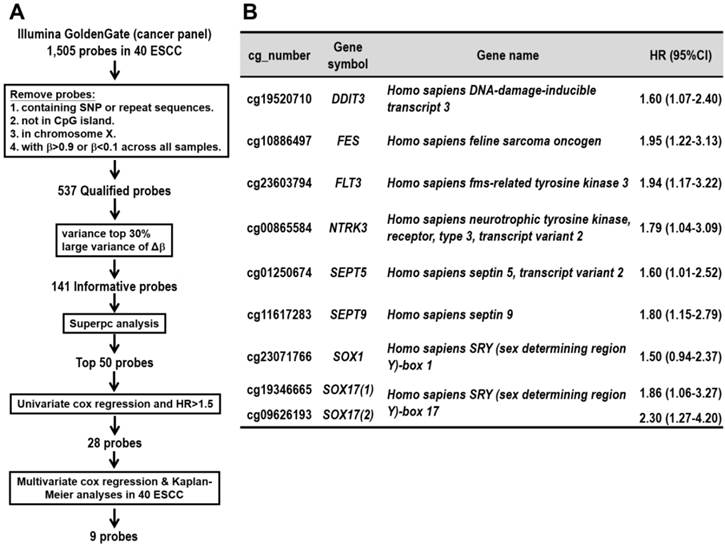
We collected surgically dissected tumor and corresponding normal tissues from 40 ESCC patients for genome-wide methylation array analysis. Illumina's GoldenGate Genotyping Assay was adapted for methylation detection in DNA isolated from these tissue specimens as a screen cohort. To obtain DNA methylation markers that can be used as predictor of ESCC patients' survival, several procedures were performed as described below. First, we followed the protocol of Byun and associates [17] to screen for qualified probes by removing probes containing single nucleotide polymorphism (SNP), repeat sequence, probes not in CpG island, or probes in X chromosome or non-differential probes having minimum of β>0.9 and maximum of β<0.1 in all samples. The β-value represents the methylation level of each CpG probes on array, ranging from 0 (unmethylated) to 1 (fully methylated). Second, we selected 141 informative probes with large variance of βTumor (top-30% ranked), or probes with larger mean of (Δβ) (Δβ=βTumor-βNormal of the same patient) among the patients. Third, for each probe, a supervised principal components (Superpc) analysis [18] was applied to compare the survival distributions between patients with methylation levels above and below the mean level of all tumor tissues analyzed; 50 probes were chosen based on these tests. Fourth, the hazard ratio was obtained from the univariate Cox regression analyses of 50 probes in 40 patients analyzed in methylation array. Furthermore, among them 28 probes were chosen according to the hazard ratio >1.5 (Additional file 1: supplementary Table 1). Fifth, multivariate Cox regression and Kaplan-Meier survival analyses were performed for the 28 selected probes in 40 patients (Figure 1A). Finally, we obtained nine DNA methylation probes which were significantly associated with poor prognosis of patients (Figure 1B). These CpG methylation probe biomarkers were located in eight genes including DDIT3, FES, FLT3, NTRK3, SEPT5, SEPT9, SOX1, SOX17(1), and SOX17(2), in which SOX17 gene with two CpG sites showed significance.
Pyrosequencing Validation of Prognostic CpG Methylation Biomarkers in ESCC Patients
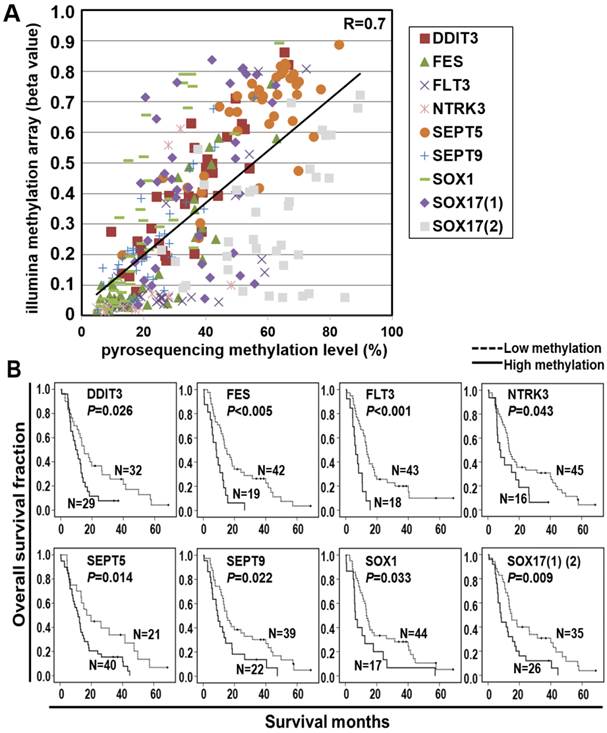
Pyrosequencing is a highly reliable, quantitative, and high-throughput method for the analysis of DNA methylation for further clinical application [15]. We thus validated the methylation array results by pyrosequencing quantitative methylation assay for the nine selected probes. A high concordance of the methylation level between microarray and pyrosequencing platforms was found in the screen cohort (Figure 2A and Additional file 1: supplementary Figure 1). Therefore, we performed pyrosequencing of the nine selected probes in a total of 61 ESCC patients including those analyzed in methylation array for a more intuitive comparison of the biomarkers. The Kaplan-Meier survival curves in Figure 2B showed the prognostic significance of nine probes of eight genes in the validation cohort of 61 ESCC patients classified by the mean of methylation level of all tumor tissues (P<0.001~P=0.033, log-rank test). Note that the survival curves of SOX17 were shown by the average of methylation level from two probes.
CpG hypermethylation of all eight genes showed an association with poor survival outcome, suggesting that these eight genes may function as tumor suppressor-like genes in ESCC tumorigenesis. Therefore, we performed pyrosequencing of the selected genes in the paired tumor and normal tissues of 61 ESCC patients. A significantly higher methylation level in tumor tissues compared to their corresponding normal samples was found in all genes analyzed (P<0.0001~P=0.026, Additional file 1: supplementary Figure 2), suggesting that these prognosis markers involved in ESCC tumorigenesis.
The Risk Score Calculation and Prognostic Prediction Based on the Eight-Gene Panel
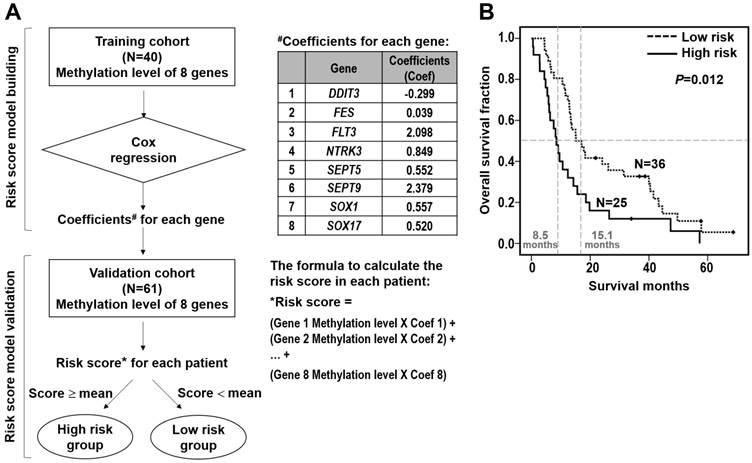
Furthermore, we performed the stepwise logistic regression to verify the multi-genes panel with high discrimination accuracy by obtaining the regression coefficients from the Cox model in the training cohort of 40 patients (Figure 3A). The regression coefficients for each gene were: DDIT3, -0.299; FES, 0.039; FLT3, 2.098; NTRK3, 0.849; SEPT5, 0.552; SEPT9, 2.379; SOX1, 0.557; SOX17, 0.520. The risk score of each patient was derived by a summation of methylation value multiplied by the corresponding coefficient of each gene. The equations used are as follows: Risk score = DDIT3 methylation value × (-0.299) + FES methylation value × 0.039 + FLT3 methylation value × 2.098 + NTRK3 methylation value × 0.849 + SEPT5 methylation value × 0.552 + SEPT9 methylation value × 2.379 + SOX1 methylation value × 0.557 + SOX17 methylation value × 0.520. Moreover, we applied the risk score calculation to prognosis prediction in the validation cohort of 61 patients. Mean of the overall risk scores was chosen as the cutoff value to classify patients into two groups whereby patients below and above the mean of the overall risk scores were defined as better survivors and poorer survivors, respectively. Such a calculation significantly predicted a subset of patient with a high risk score showing poorer survival (P=0.012, Figure 3B).
Discovery of prognostic CpG methylation probes by array analyses of the training cohort of 40 ESCC patients. (A) Flowchart of the probe selection procedures. (B) The nine CpG probes with prognostic potential in ESCC. cg_number is the CpG number of designated probe used in Illumina's GoldenGate Genotyping Array. Two CpG sites of SOX17 gene showing significance are listed in parentheses. Full gene names are listed. Hazard ratio (HR) and 95% confidence interval (CI) for each probe represents the hazard or chance of patients with hypermethylated probe as a ratio of the hazard of patients without hypermethylated probe.
Pyrosequencing validation of prognostic CpG methylation biomarkers. (A) Dot-plot analyses show a high concordance of methylation level between Illumina genome-wide methylation assay (Y-axis: β value) and pyrosequencing methylation validation (X-axis) of nine CpG probes. An average correlation coefficient of 0.7 (R=0.7) ranging from 0.4 to 0.9 among the probes is shown. (B) Kaplan-Meier analyses of overall survival in the validation cohort of 61 ESCC patients stratified by methylation of eight genes. Methylation levels below and above the mean level of all tumor tissues analyzed were defined as low methylation and high methylation, respectively. Numbers of patients in the low and high groups are shown. The survival curves of two probes in SOX17 gene, indicated as SOX17 (1) (2) are shown. P values were calculated by log-rank test and are shown as indicated.
In addition, we performed the multivariate Cox regression model to demonstrate that the power of prognostic discrimination with the eight-gene panel remained high in subgroups stratified according to other clinicopathological parameters of the ESCC patients. The Table 2 shows that the methylation level of eight-gene panel was an independent prognosis factor in ESCC patients even after adjusting for other variables including tumor stage, age and cancer recurrence status by the multivariate analysis (hazard ratio, HR, 1.996; 95% confidence interval, CI, 1.153-3.456; P=0.014).
Multivariate Cox regression assay of eight-gene panel and clinicopathological parameters of the validation cohort of 61 ESCC patients.
| Characteristics | N | HR (95%CI)a | P value |
|---|---|---|---|
| 8-genes panel (classification by mean) | |||
| Low risk score (<mean) | 36 | 1.00 | |
| High risk score (>mean) | 25 | 1.996 (1.153-3.456) | 0.014 |
| Tumor stage | |||
| Early (I/II) | 15 | 1.00 | |
| Late (III/IV) | 46 | 1.913 (0.968-3.781) | 0.062 |
| Age | |||
| <65 | 43 | 1.00 | |
| >65 | 18 | 0.747 (0.405-1.378) | 0.351 |
| Recurrence | |||
| No | 25 | 1.00 | |
| Yes | 36 | 1.695 (0.924-3.109) | 0.088 |
a HR: hazard ratio; CI: confidence interval.
Survival risk score prediction based on the eight-gene panel in ESCC patients. (A) Flowchart of the risk score calculation. A stepwise multivariate Cox regression analysis was performed to build the risk score model, in which the regression coefficients were obtained for eight genes showing significant correlation with patient survival in the training cohort (upper). The coefficient for each gene and the formulation to calculate the risk score of each patient are shown (right). The risk score model was validated in the validation cohort. Mean of the overall risk scores was chosen as the cutoff value to classify patients into two groups whereby patients below and above the mean of the overall risk scores were defined as high risk group and low risk group, respectively (lower). (B) Kaplan-Meier analysis of overall survival in the validation cohort of 61 ESCC patients stratified by mean of the risk score of eight-gene panel. The overall survival curves and median survival months for low risk score (dotted line; median survival time, 15.1 months) and high risk score (solid line; median survival time, 8.5 months) are shown. Numbers of patients in the low and high groups are shown.
Promoter Methylation is the Predominant Mechanism of SOX17 Gene Low mRNA Expression in ESCC Patients
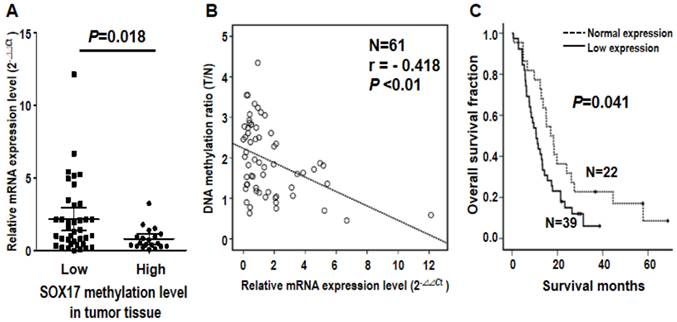
Note that SOX17 gene was verified by two probes using both microarray and pyrosequencing assays, suggesting the biological importance of DNA methylation of SOX17 gene in ESCC tumorigenesis. Given that aberrant methylation can result in transcriptional silencing of the target gene [19], we further examined the mRNA expression level of SOX17 in 61 ESCC patients. The qRT-PCR results indicated that mRNA level of SOX17 was significantly lower in the high methylation group than the low methylation group of tumor tissues from ESCC patients (P=0.018, Figure 4A). Importantly, an inverse correlation between SOX17 DNA methylation and mRNA expression was observed (r= -0.418, P<0.01, Figure 4B), suggesting that DNA hypermethylation of SOX17 resulted in low mRNA expression in ESCC patients. In addition, patient with mRNA expression level was grouped by the mean of the mRNA expression ratio between tumor and corresponding normal tissues of all patients analyzed. Levels below and above the mean were defined as low and normal mRNA expression, respectively. The Kaplan-Meier analysis showed that patients with low mRNA expression group of SOX17 had significantly poorer overall survival compared with normal expression group (P=0.041, Figure 4C). The similar prognostic results of SOX17 mRNA expression were observed in another cohort of patients (P=0.042, Additional file 1: supplementary Figure 3), confirming that SOX17 DNA methylation and mRNA low expression are both potential prognostic biomarkers for ESCC patients.
Discussion
Despite the recent advancements in diagnostic techniques and multimodality treatments, ESCC still remains one of the most aggressive and lethal diseases. In this study, we collected a cohort of paired tumor and normal tissues of ESCC patients to conduct genome-wide DNA methylation array analyses. The array data were validated for the methylation level of candidate probes by pyrosequencing to obtain more quantitative results in more patients. We identified eight prognostic methylation genes in ESCC. These genes included DDIT3, FES, FLT3, NTRK3, SEPT5, SEPT9, SOX1, SOX17(1) and SOX17(2), in which SOX17 gene with two CpG sites showed significance. The risk score calculated using the eight-gene panel could serve as an independent prognosis biomarker by Cox regression model and the multivariate analysis. Among the eight-gene methylation biomarkers, we evaluated the inverse correlation between DNA methylation and mRNA expression of SOX17 gene. We provided novel prognostic methylation biomarkers in ESCC that can be further validated by multiple cohort studies.
Inverse correlation of DNA methylation and mRNA expression of SOX17 gene in the validation cohort of 61 ESCC patients. (A) Dot-plot illustration of mRNA expression levels of SOX17 in tumor tissues of 61 ESCC patients. DNA methylation levels in tumor tissue are indicated on the X-axis with the subgroups defined by lower or higher than the mean of the methylation level in the tumor tissue, while relative mRNA expression level (2-ΔΔCt) is plotted on the Y-axis. P value was calculated by two-tailed unpaired t test. (B) A significant inverse correlation between DNA methylation and mRNA expression was found in ESCC patients. DNA methylation ratio of tumor/normal is plotted on the Y-axis, while relative mRNA expression level (2-ΔΔCt) is plotted on the X-axis. (C) Kaplan-Meier curves show that ESCC patients with low SOX17 mRNA expression had significantly poorer overall survival than patients with normal SOX17 mRNA expression. Patient with mRNA expression level was grouped by the mean of the mRNA expression ratio of tumor /normal. P value was calculated by log-rank test and is shown as indicated.
Lima et al. had recently shown the use of Illumina's GoldenGate methylation array to establish methylation profiles of ESCC [20]. They identified a total of 37 CpG sites corresponding to 34 genes to be differentially methylated in tumors compared with surrounding tissues in ten ESCC patients. They further compared the methylation patterns of ESCC patients with esophageal mucosa from four healthy individuals and the TFF1 promoter methylation was speculated to represent an early event in the development of ESCC [20]. In our study, prognostic methylation biomarkers were derived from Illumina's GoldenGate methylation microarray, stepwise bioinformatics and statistics analyses of 40 ESCC patients. We found 9 CpG loci across eight different genes that could predict ESCC survival risk. The risk score of eight-gene panel was revealed as an independent prognostic marker even after adjusting for other clinicopathological parameters. Indeed, some of our selected prognostic methylation biomarkers had been individually shown to be methylated in other cancers. For example, SEPT9 is a frequently methylated tumor suppressor gene in head and neck squamous cell carcinoma [21,22] In addition, SEPT9 is a methylation biomarker in plasma for colorectal cancer [23]. The promoter of DDIT3 gene is frequently hypermethylated in chronic myeloid leukemia patients [24]. Note that SOX1 is a DNA methylation marker for cervical cancer and ovarian cancer [25,26]. We analyzed the alteration mechanisms of SOX17 at DNA and RNA levels in ESCC patients and found an inverse correlation between SOX17 DNA methylation and mRNA expression in clinical model. These results suggested that DNA hypermethylation is a predominant mechanism for SOX17 gene silencing, which is in agreement with previous reports of esophageal cancer patients determined by methylation-specific PCR method [27,28].
In conclusion, our study provided a proof-of-concept CpG methylation biomarker panel for ESCC prognosis prediction. The panel of eight-gene prognostic methylation biomarkers also showed a significantly higher methylation level in tumor tissues compared to their corresponding normal samples, supporting their role in ESCC tumorigenesis. Further characterization of novel genes validated in our methylation biomarker panel could help to dissect the mechanism of ESCC tumorigenesis and progression. In addition, the high concordance of methylation level between array and pyrosequencing platforms suggested that our selected panel of DNA methylation biomarkers validate for further clinical application by pyrosequencing, which is a highly reliable, quantitative, and high-throughput method for the analysis of DNA methylation at multiple CpG sites. We propose that the prognostic eight-gene panel may allow clinicians to risk‐stratify their ESCC patients for close monitoring of long‐term outcomes. The use of this set of methylation markers combined with endoscopic ultrasound features would identify patients in dire need of intensive surveillance and further adjuvant therapy to seek for possible improvement of their clinical outcome.
Supplementary Material
Additional File 1Supplementary Table and Supplementary Figures.
Acknowledgements
This work was supported in part by the Department of Health (DOH101-TD-PB-111-TM004 to BSS, DOH101-TD-PB-111-TM003 to PJL, DOH100-TD-C-111-003 to WWL, DOH101-TD-PB-111-TM001 to YCW), and the National Science Council (NSC101-2627-B-006-001 to YCW). The authors would like to thank the Tissue Bank, Research Center of Clinical Medicine, National Cheng Kung University Hospital for providing clinical specimens; Taiwan Bioinformatics Core at the National Cheng Kung University, supported by a National Science Council grant (NSC 97-3112-B-006-011) for assisting with MetaCore analyses; and Ms. Ching-Hsi Lin and Mr. Chi-Huei Hsiung for technical support.
Abbreviations
ESCC, Esophageal squamous cell carcinoma; qRT-PCR, quantitative reverse transcription-polymerase chain reaction; r, correlation coefficients; SOX17, sex determining region Y box 17; Superpc, supervised principal components.
Competing Interests
The authors have declared that no competing interest exists.
References
1. Enzinger PC, Mayer RJ. Esophageal cancer. N Engl J Med. 2003;349:2241-52
2. Chang X, Yamashita K, Sidransky D. et al. Promoter methylation of heat shock protein B2 in human esophageal squamous cell carcinoma. Int J Oncol. 2011;38:1129-35
3. Khuroo MS, Zargar SA, Mahajan R. et al. High incidence of oesophageal and gastric cancer in Kashmir in a population with special personal and dietary habits. Gut. 1992;33:11-5
4. Kmet J, Mahboubi E. Esophageal cancer in the Caspian littoral of Iran: initial studies. Science. 1972;175:846-53
5. Baylin SB, Esteller M, Rountree MR. et al. Aberrant patterns of DNA methylation, chromatin formation and gene expression in cancer. Hum Mol Genet. 2001;10:687-92
6. Herman JG, Baylin SB. Gene silencing in cancer in association with promoter hypermethylation. N Engl J Med. 2003;349:2042-54
7. Belinsky SA. Gene-promoter hypermethylation as a biomarker in lung cancer. Nat Rev Cancer. 2004;4:707-17
8. Costello JF, Fruhwald MC, Smiraglia DJ. et al. Aberrant CpG-island methylation has non-random and tumour-type-specific patterns. Nat Genet. 2000;24:132-8
9. Jin Z, Olaru A, Yang J. et al. Hypermethylation of tachykinin-1 is a potential biomarker in human esophageal cancer. Clin Cancer Res. 2007;13:6293-300
10. Kuroki T, Trapasso F, Yendamuri S. et al. Allele loss and promoter hypermethylation of VHL, RAR-beta, RASSF1A, and FHIT tumor suppressor genes on chromosome 3p in esophageal squamous cell carcinoma. Cancer Res. 2003;63:3724-8
11. Lee EJ, Lee BB, Han J. et al. CpG island hypermethylation of E-cadherin (CDH1) and integrin alpha4 is associated with recurrence of early stage esophageal squamous cell carcinoma. Int J Cancer. 2008;123:2073-9
12. Yang HH, Hu N, Wang C. et al. Influence of genetic background and tissue types on global DNA methylation patterns. PLoS One. 2010;5(2):e9355
13. Gyobu K, Yamashita S, Matsuda Y. et al. Identification and validation of DNA methylation markers to predict lymph node metastasis of esophageal squamous cell carcinomas. Ann Surg Oncol. 2011;18:1185-94
14. Bibikova M, Lin Z, Zhou L. et al. High-throughput DNA methylation profiling using universal bead arrays. Genome Res. 2006;16:383-93
15. Vaissiere T, Hung RJ, Zaridze D. et al. Quantitative analysis of DNA methylation profiles in lung cancer identifies aberrant DNA methylation of specific genes and its association with gender and cancer risk factors. Cancer Res. 2009;69:243-52
16. Sung CO, Han SY, Kim SH. Low expression of claudin-4 is associated with poor prognosis in esophageal squamous cell carcinoma. Ann Surg Oncol. 2011;18:273-81
17. Byun HM, Siegmund KD, Pan F. et al. Epigenetic profiling of somatic tissues from human autopsy specimens identifies tissue- and individual-specific DNA methylation patterns. Hum Mol Genet. 2009;18:4808-17
18. Shen K, Song N, Kim Y. et al. A systematic evaluation of multi-gene predictors for the pathological response of breast cancer patients to chemotherapy. PLoS One. 2012;7(11):e49529
19. Guo M, Ren J, House MG. et al. Accumulation of promoter methylation suggests epigenetic progression in squamous cell carcinoma of the esophagus. Clin Cancer Res. 2006;12:4515-22
20. Lima S.C, Hernandez-Vargas H, Simao T. et al. Identification of a DNA methylome signature of esophageal squamous cell carcinoma and potential epigenetic biomarkers. Epigenetics. 2011;6:1217-27
21. Bennett KL, Romigh T, Eng C. Disruption of transforming growth factor-beta signaling by five frequently methylated genes leads to head and neck squamous cell carcinoma pathogenesis. Cancer Res. 2009;69:9301-5
22. Bennett KL, Karpenko M, Lin MT. et al. Frequently methylated tumor suppressor genes in head and neck squamous cell carcinoma. Cancer Res. 2008;68:4494-9
23. deVos T, Tetzner R, Model F. et al. Circulating methylated SEPT9 DNA in plasma is a biomarker for colorectal cancer. Clin Chem. 2009;55:1337-46
24. Wang YL, Qian J, Lin J. et al. Methylation status of DDIT3 gene in chronic myeloid leukemia. J Exp Clin Cancer Res. 2010;29:54
25. Lai HC, Lin YW, Huang TH. et al. Identification of novel DNA methylation markers in cervical cancer. Int J Cancer. 2008;123:161-7
26. Su HY, Lai HC, Lin YW. et al. An epigenetic marker panel for screening and prognostic prediction of ovarian cancer. Int J Cancer. 2009;124:387-93
27. Zhang W, Glockner SC, Guo M. et al. Epigenetic inactivation of the canonical Wnt antagonist SRY-box containing gene 17 in colorectal cancer. Cancer Res. 2008;68:2764-72
28. Jia Y, Yang Y, Zhan Q. et al. Inhibition of SOX17 by microRNA 141 and methylation activates the WNT signaling pathway in esophageal cancer. Mol Diagn. 2012;14:577-85
Author biography
Dr. Yi-Ching Wang studies the molecular mechanisms involved in lung and esophageal tumorigenesis. Dr. Wang investigates the etiological association of alterations in several tumor suppressor genes, oncogenes, and DNA repair genes with lung tumorigenesis. The alteration analyses include the following aspects: gene mutation and polymorphism, gene loss, hypermethylation of promoter, chromatin structure alteration of gene locus, mRNA alteration, and protein expression alteration. More recently, Dr. Wang has continued to do research on cancer genomics and epigenomics such as genome-wide search of loss of heterozygosity, and genome-scanning approaches of DNA methylation and chromatin alteration profiles for identification of new genes critical to lung and esophageal tumorigenesis. In addition, several potential anti-cancer drugs are developing in her laboratory. Dr. Wang has published more than 70 SCI papers on lung cancer including prestigious journals such as J Clin Oncol, J Clin Invest, and Cancer Res. Dr. Wang is one of the recipients of the Excellent Research Award of Taiwan National Science Council.
![]() Corresponding author: Professor Yi-Ching Wang, Department of Pharmacology and Institute of Basic Medical Science, National Cheng Kung University, No.1, University Road, Tainan 701, Taiwan, R.O.C. Tel: +886-6-2353535 ext.5502, FAX: +886-6-2749296, e-mail: ycw5798ncku.edu.tw.
Corresponding author: Professor Yi-Ching Wang, Department of Pharmacology and Institute of Basic Medical Science, National Cheng Kung University, No.1, University Road, Tainan 701, Taiwan, R.O.C. Tel: +886-6-2353535 ext.5502, FAX: +886-6-2749296, e-mail: ycw5798ncku.edu.tw.
Received 2013-8-14
Accepted 2014-5-14
Published 2014-5-30