ISSN: 1449-1907International Journal of Medical Sciences

Int J Med Sci 2013; 10(8):974-980. doi:10.7150/ijms.5811 This issue Cite
Research Paper
Combination with Anthropometric Measurements and MQSGA to Assess Nutritional Status in Chinese Hemodialysis Population
Jie Chen1,3*, Hongquan Peng4*, Zhimin Yuan5, Kun Zhang1, 2, Long Xiao6, Jialian Huang7, Jingfeng Wang1, 2, Hui Huang1,2, ![]()
1. Guangdong Province Key Laboratory of Arrhythmia and Electrophysiology, Guangzhou, 510120 China
2. Department of Cardiology, Sun Yat-sen Memorial Hospital of Sun Yat-sen University, Guangzhou, 510120 China
3. Department of Radiation Oncology, Sun Yat-sen Memorial Hospital of Sun Yat-sen University, Guangzhou, 510120 China
4. Renal division, Kiang Wu Hospital, Macau SAR, China
5. Department of Nutrition, Sun Yat-sen Memorial Hospital of Sun Yat-sen University, Guangzhou, 510120 China
6. Department of blood purification, the Second Affiliated Hospital of Guangzhou Medical college, Guangzhou, 510260 China
7. Hemodialysis Center, the First Affiliated Hospital of Guangdong Hospital University of Pharmacy, Guangzhou, 510080 China
* Jie Chen and Hongquan Peng contributed equally to the development of this research study.
Abstract
Aims: To assess the nutritional status, combination with anthropometric measurements and modified quantitative subjective global assessment (MQSGA) was used in multi-center hemodialysis population in South China.
Methods: A cross-sectional, descriptive-analytic study was performed in 4 teaching hospitals in South China, dated from January 2010 to December 2011. Nutritional status was assessed with MQSGA and related anthropometric indexes. Serum albumin and transthyretin were also determined for nutritional assessment.
Results: Eighty-two randomly selected hemodialysis patients participated in the nutritional assessment, of which 75 hemodialysis patients completed all assessments. The average age was 62.70 ± 14.21 years. The mean duration of hemodialysis was 3.29 ± 1.08 years. Of the included patients, 32% patients were well nourished, 60% were mild to moderately malnourished, and 8% were severely malnourished. Along with the malnutrition severity, the serum transthyretin significantly decreased. However, no obvious changes were found in serum albumin. The mean value (Mean ± SD; 25.78 ± 4.09 cm) of mid arm circumference (MAC) was negatively correlated with MQSGA (r = -0.365; P = 0.002). Body mass index (BMI) (Mean ± SD; 21.6 ± 3.1 kg/m2) was also significantly negatively correlated with MQSGA (r = -0.392; P = 0.001). The areas under the receiver operating characteristic curve were 0.664 and 0.726, respectively.
Conclusions: Malnutrition is very common in South China hemodialysis population. Both BMI and MAC were effective markers for assessing nutritional status.
Keywords: Nutrition, modified quantitative subjective global assessment, anthropometric measurements, hemodialysis
Introduction
Malnutrition is a common concern in hemodialysis patients. The malnutrition status leads to susceptibility to fatigue, anemia, infection, and poor rehabilitation, increases risk for hospitalization, and eventually causes increased mortality in hemodialysis patients [1-4].
Traditional assessment of nutritional status can be attained by body weight, body mass index (BMI), biochemical parameters and subjective global assessment (SGA). SGA was firstly designed by Detsky et al. [5]. However, its semi-quantitative scale, comprising of three severity levels, restricts its reliability and precision [6]. Using the components of the conventional SGA, a fully quantitative scoring system known as modified quantitative subjective global assessment (MQSGA) was developed by Kalantar-Zadeh et al, suggesting that a modified malnutrition scoring system may be superior to the traditional SGA [6]. MQSGA assimilates the advantages of the SGA while it extends the reliability and accuracy, and provides a relatively well-validated method for assessing nutritional status. More elaborate and convenient methods, such as bioelectrical impedance, dual energy X-ray absorptiometry (DEXA) that produce reliable and accurate results are costly and their use is mainly confined to research [7].
With the development of Chinese economy and reforming health care policy, the living standard of the Chinese people is attaining to a higher level, especially in South China. However, there is still a high mortality in hemodialysis patients and currently we are not clear about the nutritional status of these patients. In addition, there is also a scarcity of data on the assessment and epidemiological survey of nutritional status in Chinese hemodialysis population. As is known to us all, hemodialysis patients require appropriate nutrition assessment in order to prevent malnutrition. And failure to diagnose malnutrition may lead to the poor prognosis [8]. However, nutritional status assessment is always overlooked in many hemodialysis centers. Although abundant methods and scoring systems are available to screen for malnutrition patients, most of these methods are not used conveniently in very busy centers and even some anthropometric measurements are also neglected.
Therefore, simple and effective methods of nutritional status evaluation may have favorable effects on patients' management. In this study, we assessed the nutritional status of hemodialysis patients by combination with anthropometric measurements and MQSGA in multicenter South China population. We aimed to screen out the relatively appropriate and convenient methods to assess the nutritional status, eventually targeted to improve the quality of the life and survival of hemodialysis patients.
Methods
Study population
This cross-sectional, descriptive-analytic study was performed in 4 teaching hospitals in South China, dated from January 2010 to December 2011. Inclusion criteria were as follows: all maintained hemodialysis patients were recruited into the study. And all patients had been hemodialyzed for at least 3 months before entering into the study and they agreed to complete all nutritional assessments. The patients with acute renal failure, major adverse cardiovascular events, cancer, severe gastrointestinal and hepatic diseases, and severe infections were excluded.
Eighty-two randomly selected hemodialysis patients participated in the nutritional assessment, of which 75 patients completed all data. 7 patients were excluded because of acute severe complications (e.g. heart failure, dialysis encephalopathy) or dead. Data including patients' demographics and duration of hemodialysis were obtained by a detailed history elucidation from the patients and their cases records. Informed consent was obtained from each patient and their medical records were studied by anonymous means. The study protocol conformed to the ethical guidelines of the 1975 Declaration of Helsinki as reflected in a priori approval by the Ethics Committee of Sun Yat-sen University.
Anthropometric measurements
Several anthropometric measurements were done after finishing of the hemodialysis session. Measurement of skin fold thickness at the biceps (BSF) or triceps (TSF) provided an estimate of body fat, while mid arm circumference (MAC) and mid arm muscle circumference (MAMC) were used to estimate muscle mass. TSF and BSF were measured using skin fold caliper. MAC was measured using an inch tape. MAMC was calculated using the formula: MAMC=MAC-(3.1415×TSF). Body dry weight was measured between 10 and 20 minutes after termination of the hemodialysis session for at least three time independent measurements. All other anthropometric measurements were performed three times on the non-access arms. The body mass index (BMI) was computed as the ratio between end-hemodialysis bodyweight in kg and the square of height in meters (kg/m2).
Nutritional status evaluation
Nutritional status was assessed by MQSGA in participating hemodialysis patients. MQSGA consists of seven components: weight change, gastrointestinal symptoms, dietary intake, functional capacity, co-morbidity, subcutaneous fat and signs of muscle wasting. Each component has a score from 1 (normal) to 5 (very severe). Thus the malnutrition score (sum of all components) is a number from 7 (normal) to 35 (severely malnourished). After completion of physical examinations, the patients were placed into one of three grades, normal nutrition (score of 7-10), mild to moderate malnutrition (score of 11-20) and severe malnutrition (score of 21-35). The nutritional status scoring for each patient was valued by two physicians separately. In addition, 3-month average value of serum albumin and transthyretin were tested to indirectly reflect nutritional status.
Statistical analysis
Descriptive statistics and regression analysis were carried out with the statistical software package (SPSS17.0). All data were expressed as mean ± SD. P-value based on ANOVA test and t-test or Mann-Whitney U test for parametric variables was used for comparison in different groups. Pearson's correlation was used to assess the strength of association between MQSGA scores and anthropometric parameters. Receiver operating characteristic curve (ROC) analysis was used to quantify the assessing value of independent parameters for nutritional status using MQSGA as the reference criteria. For all statistical tests, P-value of <0.05 was considered to be statistically significant.
Results
Demographic data
A total of 75 participating patients completed all data. The average age of the 75 patients were 62.70 ± 14.21 years old, and included 68% men. The duration of hemodialysis in these study patients ranged from 3 months to 6 years with a mean duration of 3.29 ± 1.08 years. The average post-hemodialysis dry weight was 58.13 ± 10.13 kg.
Anthropometric assessments and the relationship with MQSGA
The average height was 1.63 ± 0.06 m, and the mean value of BMI was 21.6 ± 3.1 kg/m2. The results of anthropometric assessments were showed in Table 1. And there were no significant differences between men and women (Table 1). Then we explored the relationship between anthropometric assessments with MQSGA (Table 2). The MAC reflected the thickness of subcutaneous fat and muscle, and the mean value was 25.78 ± 4.09 cm. There was a significantly negative correlation with MQSGA (r = -0.365; P = 0.002). MAMC measuring the protein status in the body was also negatively correlated with MQSGA (r = -0.232; P = 0.04). The other anthropometric parameters including BMI (r = -0.392, P = 0.001), TSF (r = -0.361; P = 0.002), BSF (r = -0.363; P = 0.002) and subscapular skinfold thickness (r = -0.298; P = 0.01) were all showed a negative correlation with MQSGA (Table 2).
Anthropometric assessment between men and women in hemodialysis patients
| Anthropometry | male(n=51) | female(n=24) | P value |
|---|---|---|---|
| TSF (mm) | 9.66±5.33 | 12.74±8.29 | 0.1 |
| BSF (mm) | 6.26±3.69 | 8.96±6.43 | 0.07 |
| Subscapular skinfold (mm) | 13.12±5.20 | 14.94±7.96 | 0.3 |
| MAC (cm) | 25.93±3.71 | 25.48±4.87 | 0.7 |
| MAMC (cm) | 22.89±3.04 | 21.48±3.58 | 0.08 |
| MQSGA | 13.16±4.59 | 13.08±4.11 | 0.8 |
All values are expressed as mean±SD. P-value based on t-test for continuous variable is for comparison between the two groups (male and female).
Abbreviations: BSF, biceps skin fold; MAC, mid arm circumference; MAMC, mid arm muscle circumference; MQSGA, modified quantitative subjective global assessment; TSF, triceps skinfold.
The correlation analysis of anthropometric assessments and modified quantitative subjective global assessment (MQSGA) in hemodialysis patients
| Variable | MQSGA | |
|---|---|---|
| r | P value | |
| BMI (g/m2) | -0.392 | 0.001* |
| TSF (mm) | -0.361 | 0.002* |
| BSF (mm) | -0.363 | 0.002* |
| Subscapular skinfold (mm) | -0.298. | 0.01* |
| MAC (cm) | -0.365 | 0.002* |
| MAMC (cm) | -0.232 | 0.04* |
r for Pearson correlation coefficients, (*P < 0.05).
Abbreviations: BMI, body mass index; BSF, biceps skin fold; MAC, mid arm circumference; MAMC, mid arm muscle circumference; TSF, triceps skinfold.
Nutritional status evaluation
Based on the MQSGA scoring system, three groups were classified: normal nutrition, mild to moderate malnutrition and severe malnutrition. In our study the patients with normal nutrition were 32% (score of 7-10), 60% patients were mildly to moderately malnourished (score of 11-20), and 8% had severe malnutrition (score of 20-35) (Table 3). And along with the malnutrition severity, the transthyretin were decreased (P=0.01). However, the levels of serum albumin among groups showed no significance (P = 0.6).
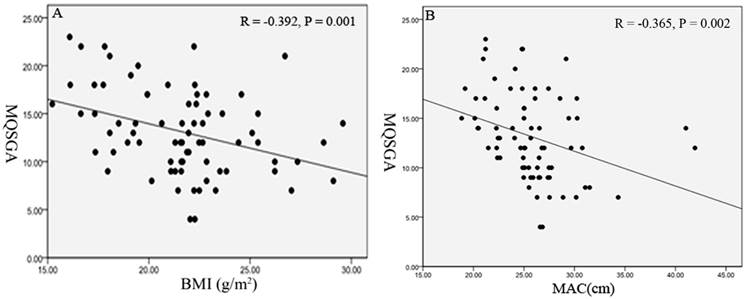
Subsequently, we aimed to confirm the anthropometric results further through the nutritional status hierarchical analysis, and showed some anthropometric measurements with differentiating value for nutrition evaluation (Table 3). Here we showed that BMI had a strong correlation with the nutritional status (P = 0.02) and followed by MAC (P = 0.049), which indicated that the lower BMI and MAC, the higher MQSGA score. Next we attempted to confirm the above data with scatter plots, regression line, as shown in Figure 1A, 1B.
Anthropometric markers for assessing nutritional status
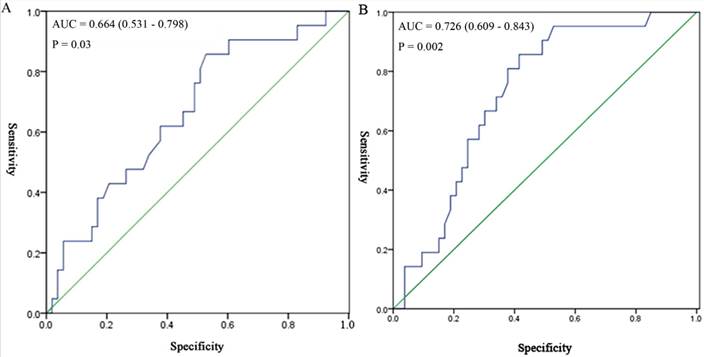
The above study had demonstrated that both BMI and MAC were relatively good markers for assessing nutritional status. Then the ROC curve analysis was used to analyze whether the two markers could be better predictors for nutritional status using MQSGA as the reference standard (Figure 2A, 2B). The area under the curve (AUC) was 0.664 (95% CI = 0.531 - 0.798) for BMI (Figure 2A), and 0.726 (95% CI = 0.609 - 0.843) for MAC (Figure 2B). High level of BMI and MAC were shown to be the appropriate predictors for better nutritional status (P < 0.05). BMI with a threshold value of 21.19 kg/m2 provided 85.7% sensitivity and 52.8% specificity for the prediction of malnutrition. MAC with a threshold value of 25.05 cm provided 85.7% sensitivity and 41.5% specificity for the prediction of malnutrition.
Demographic, anthropometric serum albumin and transthyretin values in hemodialysis patients and nutritional status were classified into 3 groups according to MQSGA scoring
| Variable | total | normal | mild to moderate | severe | P value |
|---|---|---|---|---|---|
| n=75 | n=24 | n=45 | n=6 | ||
| Age (year) | 62.70±14.21 | 63.43±12.86 | 62.22±15.14 | 63.5±14.13 | 0.4 |
| Albumin (g/L) | 39.01±5.01 | 41.13±4.08 | 38.27±49.0 | 38.12±54.2 | 0.6 |
| Transthyretin (mg/dL) | 17.9 ±1.7 | 21.4±2.1 | 15.6±1.2 | 7.8±2.3 | 0.01* |
| Height (m) | 1.63±0.06 | 1.64±0.06 | 1.63±0.67 | 1.65±0.05 | 0.5 |
| Weight (kg) | 58.13±10.13 | 61.93±8.42 | 56.79±10.42 | 53.66±11.13 | 0.07 |
| BMI (g/m2) | 21.6±3.1 | 23.00±2.59 | 21.18 ±3.06 | 19.59±4.10 | 0.02* |
| TSF ( mm) | 10.7±6.5 | 11.98±5.72 | 10.27±6.85 | 8.56±7.15 | 0.4 |
| BSF ( mm) | 7.14±4.88 | 8.51±4.97 | 6.66±4.73 | 5.49±5.26 | 0.2 |
| Subscapular skinfold(mm) | 13.7±6.081 | 15.79±5.50 | 13.07±5.99 | 10.49±7.35 | 0.09 |
| MAC (cm) | 25.78±2.09 | 27.39±2.37 | 25.24±4.65 | 23.70±3.23 | 0.049* |
| MAMC (cm ) | 22.43 ±3.26 | 23.63±2.39 | 22.02±3.64 | 21.01±1.60 | 0.08 |
| MQSGA | 13.13±4.41 | 8.26±1.73 | 14.46±2.49 | 21.83±0.7 | <0.001* |
All values are expressed as mean±SD. P-value based on ANOVA test for parametric continuous variable is used for comparison among the three groups: normal nutrition, mild to moderate malnutrition and severe malnutrition (*P <0.05).
Abbreviations: BMI, body mass index; BSF, biceps skin fold; MAC, mid arm circumference; MAMC, mid arm muscle circumference; MQSGA, modified quantitative subjective global assessment; TSF, triceps skinfold.
Scatter plots and regression line reflect the correlation between modified quantitative subjective global assessment (MQSGA) with body mass index (BMI) and mid arm circumference (MAC). Figure 1A Scatter plots, regression line for BMI, MQSGA. Figure 1B Scatter plots, regression line for MAC, MQSGA.
Receiver-operating characteristic (ROC) curve for different anthropometric assessments in assessing nutritional status using modified quantitative subjective global assessment (MQSGA) as the reference standard (*P < 0.05). For each screening test, sensitivity is plotted against 100-specificity. The ideal test would have 100% sensitivity and 100% specificity and reach the upper left corner of the graph; a test with no diagnosis value would lie along the diagonal between the lower left corner and the upper right corner. Figure 2A ROC curve for body mass index (BMI). Figure 2B ROC curve for mid arm circumference (MAC).
Discussion
Malnutrition is a common concern in hemodialysis patients. About 18% to 75% hemodialysis patients have malnutrition [9]. In our multiple-center study, the patients with malnutrition were 68%, and 8% had severe malnutrition in South China, even under the condition of rapid development of Chinese economy and reforming health care policy.
The global hemodialysis population grew over 9% in 1990-2010, reaching 2.029 million in 2010. And China made up around 7.4% of the global hemodialysis population in 2011 [10]. The annual mortality rate reported in Chinese hemodialysis patients was around 10% [11]. So, the high incidence rate of malnutrition might be involved in the high mortality of hemodialysis patients in China. This indicated the inadequate management and not enough input of hemodialysis patients should be concerned in China. However, the nutritional status evaluation is often ignored and the assessment standard is not definite in hemodialysis population in China. Some anthropometric measurements like body weight, bioelectrical impedance analysis and some biochemical indicators, such as serum albumin are practical in identifying the patients with high risks of malnutrition. However, they can be influenced by some non-nutritional factors, for example edema, iron deficiency anemia, liver disease, and chronic inflammation, etc. Therefore, more elaborate and convenient methods are particularly important.
Multiple methods of nutritional status evaluation are developed ranging from anthropometric measurements (e.g. MAC) to more intricate techniques (e.g. DEXA). MQSGA is a reproducible and practical method for assessing the nutritional status of hemodialysis patients. Kalantar-Zadeh et al. found that MQSGA was a relatively well validated method for assessing nutritional status and significantly correlated with anthropometric measurements [6]. In our study, we found TSF, BSF, subscapular skinfold thickness, etc significantly correlated with the MQSGA (Table 2). Specifically, we demonstrated that BMI and MAC indicated the strong relationship with nutritional status and they had better predictive value for nutritional status evaluation in comparison with the other anthropometric measurements from Table 3 and Figure 1A, 1B. We all know that BMI is a simple and objective measurement to determine the nutritional status, though may not be a sensitive marker of malnutrition [12]. However, in our study, BMI showed relatively higher sensitivity (85.7%). As to MAC, in our finding, it reflected the thickness of subcutaneous fat and muscle, and had a good compatibility with MQSGA. Moreover, ROC analysis indicated the diagnostic efficiency of BMI and MAC in malnutrition. Comparing with BMI, it seemed that MAC could be better predictor. This may attribute to BMI can be influenced by edema or serous cavity effusion. However, BMI should also be considered. Because the normal BMI standard of Chinese population is lower than that the World Health Organization (WHO) recommended standard [13, 14]. In our study, BMI with a threshold value of 21.19 kg/m 2 provided 85.7% sensitivity and 52.8% specificity for the prediction of malnutrition. And the specificity of BMI is higher than that of MAC. So combination of BMI and MAC may be as convenient as MQSGA for evaluation malnutrition of hemodialysis population. And they can be recommended serving as public health evaluation and clinical screening of nutritional status in hemodialysis population. Recently, Hou Y et al. compared different assessments for malnutrition in Chinese hemodialysis patients and found malnutrition-inflammation score (MIS) is a sensitive method [15]. MIS also uses the conventional SGA and 3 additional elements: BMI, serum albumin, and total-iron-binding capacity to represent serum transferrin [16]. However, in this study, MIS showed no significant relation with the percentage of body fat which is associated with increased mortality in hemodialysis patients [17]. In our study, we estimated the nutritional status of hemodialysis patients using MQSGA as a reference and we found MAC and BMI could be better predictor for nutritional status. However, whether combination with MAC, BMI and MQSGA are superior to MIS in hemodialysis estimating malnutrition is not known. More comparative, longitudinal and strenuous studies are needed to confirm the validity of malnutrition evaluation system in Chinese hemodialysis population.
Moreover, in this study, we measured serum albumin and transthyretin to indirectly assess malnutrition. Although we did not find malnutrition hemodialysis patients exhibited significantly low levels of albumin, there was an obvious decrease of transthyretin which indicated transthyretin may be a good marker of malnutrition. In fact, previous studies had found that transthyretin is like a mirror representing the true protein metabolic status under inflammatory conditions in hemodialysis [18]. Recently, the scientific work of Yves Ingenbleek team also demonstrated transthyretin as a useful tool for nutrition assessment [19] and this work also provides reference value for Chinese physicians. However, more studies are needed to explore the role of thransthyretin in assessing nutritional status of Chinese hemodialysis patients though it may not be.
Limitations
In this study, we evaluated the nutritional status of hemodialysis population through several anthropometric measurements, MQSGA, serum albumin and transthyretin. This may be attributed to BMI being influenced by total body water. In fact, there are a lot of methods to evaluate nutritional status of hemodialysis patients such as MIS. However, each method has its own drawbacks [20]. The biggest problem that affects the anthropometric measurements in the dialysis patient appears to be errors based on over hydration. Although we take several ways (e.g. strictly controlled the measure time, estimated different makers, etc) to avoid this shortcoming, it still cannot completely ignore this problem. Further studies are needed to find better markers for assessing malnutrition in hemodialysis patients. In addition, our study is limited by the underpowered dataset, especially the severe nutritional patients were small in quantity and both BMI and MAC had a low specificity to assess malnutrition. So, more large scale studies are needed to verify our findings.
In conclusion, malnutrition is very common in South China hemodialysis population. In addition to MQSGA, BMI and MAC may be relative appropriate and practical markers for assessing nutritional status in China. Especially MAC, a surrogate of MQSGA, may be a good potential predictor of nutritional status. Combination with multiple methods to assess nutritional status in future will be helpful to earlier find out the hemodialysis patients with malnutrition and physicians can provide intervention at early stage base on the nutrition assessment so as to increase the quality of life and decrease the morbidity and mortality of the hemodialysis patients.
Abbreviations
AUC, area under the curve; BMI, body mass index; BSF, biceps skinfold thickness; DEXA, dual energy X-ray absorptiometry; MAC, mid arm circumference; MAMC, Mid arm muscle circumference; MIS, malnutrition-inflammation score; MQSGA, modified quantitative subjective global assessment; SGA, subjective global assessment; TSF, triceps skinfold thickness.
Acknowledgements
This work was supported in part by National Natural Science Foundation of China [81170647, 91029742 and 30973207] and the Fok Ying-Tong Education Foundation for Young Teachers in the Higher Education Institutions of China (132030) to Hui Huang.
Competing Interests
The authors have declared that no competing interest exists.
References
1. Steiber AL, Handu DJ, Cataline DR. et al. The impact of nutrition intervention on a reliable morbidity and mortality indicator: the hemodialysis-prognostic nutrition index. J Ren Nutr. 2003;13:186-90
2. Lacson E Jr, Xu J, Lin SF. et al. A comparison of SF-36 and SF-12 composite scores and subsequent hospitalization and mortality risks in long-term dialysis patients. Clin J Am Soc Nephrol. 2010;5:252-60
3. Neumayer LA, Smout RJ, Horn HG. et al. Early and sufficient feeding reduces length of stay and charges in surgical patients. J Surg Res. 2001;95:73-7
4. Laws RA, Tapsell LC, Kelly J. Nutritional status and its relationship to quality of life in a sample of chronic hemodialysis patients. J Ren Nutr. 2000;10:139-47
5. Detsky AS, McLaughlin JR, Baker JP. et al. What is subjective global assessment of nutritional status?. JPEN J Parenter Enteral Nutr. 1987;11:8-13
6. Kalantar-Zadeh K, Kleiner M, Dunne E. et al. A modified quantitative subjective global assessment of nutrition for dialysis patients. Nephrol Dial Transplant. 1999;14:1732-8
7. Chertow GM, Lowrie EG, Wilmore DW. et al. Nutritional assessment with bioelectrical impedance analysis in maintenance hemodialysis patients. J Am Soc Nephrol. 1995;6:75-81
8. Heys SD, Walker LG, Smith I. et al. Enteral nutritional supplementation with key nutrients in patients with critical illness and cancer: a meta-analysis of randomized controlled clinical trials. Ann Surg. 1999;229:467-77
9. Mehrotra R, Kopple JD. Nutritional management of maintenance dialysis patients: why aren't we doing better?. Annu Rev Nutr. 2001;21:343-79
10. Pinto A, Juniper DT, Sanil M. et al. Supranutritional selenium induces alterations in molecular targets related to energy metabolism in skeletal muscle and visceral adipose tissue of pigs. J Inorg Biochem. 2012;114C:47-54
11. Cheng X, Nayyar S, Wang M. et al. Mortality rates among prevalent hemodialysis patients in Beijing: a comparison with USRDS data. Nephrol Dial Transplant. 2013;28:724-32
12. Mei Z, Grummer-Strawn LM, Pietrobelli A. et al. Validity of body mass index compared with other body-composition screening indexes for the assessment of body fatness in children and adolescents. Am J Clin Nutr. 2002;75:978-85
13. Lu Y, Lu J, Wang S. et al. Cognitive function with glucose tolerance status and obesity in Chinese middle-aged and aged adults. Aging Ment Health. 2012;16:911-4
14. Higuchi T, Matsukawa Y, Okada K. et al. Correction of copper deficiency improves erythropoietin unresponsiveness in hemodialysis patients with anemia. Intern Med. 2006;45:271-3
15. Hou Y, Li X, Hong D. et al. Comparison of different assessments for evaluating malnutrition in Chinese patients with end-stage renal disease with maintenance hemodialysis. Nutr Res. 2012;32:266-71
16. Stenvinkel P, Heimburger O, Paultre F. et al. Strong association between malnutrition, inflammation, and atherosclerosis in chronic renal failure. Kidney Int. 1999;55:1899-911
17. Huang CX, Tighiouart H, Beddhu S. et al. Both low muscle mass and low fat are associated with higher all-cause mortality in hemodialysis patients. Kidney Int. 2010;77:624-9
18. Ingenbleek Y, Young VR. Significance of transthyretin in protein metabolism. Clin Chem Lab Med. 2002;40:1281-91
19. Ingenbleek Y, McCully KS. Vegetarianism produces subclinical malnutrition, hyperhomocysteinemia and atherogenesis. Nutrition. 2012;28:148-53
20. Kovesdy CP, Kalantar-Zadeh K. Accuracy and limitations of the diagnosis of malnutrition in dialysis patients. Semin Dial. 2012;25:423-7
Author contact
![]() Corresponding author: Hui Huang, M.D., PhD. Department of Cardiology, Sun Yat-sen Memorial Hospital of Sun Yat-sen University, 107 West Yanjiang Road, Guangzhou 510120, China. Tel # 0086-20-81332475. Cell phone # 8613535074379. Fax# 0086-20-81332623. Email: huanghui765com
Corresponding author: Hui Huang, M.D., PhD. Department of Cardiology, Sun Yat-sen Memorial Hospital of Sun Yat-sen University, 107 West Yanjiang Road, Guangzhou 510120, China. Tel # 0086-20-81332475. Cell phone # 8613535074379. Fax# 0086-20-81332623. Email: huanghui765com
Received 2013-1-5
Accepted 2013-5-28
Published 2013-6-13