ISSN: 1449-1907International Journal of Medical Sciences

Int J Med Sci 2013; 10(6):751-757. doi:10.7150/ijms.6074 This issue Cite
Research Paper
Is Stroke Volume Variation a Useful Preload Index in Liver Transplant Recipients? A Retrospective Analysis
Sung-Hoon Kim1, Gyu-Sam Hwang1, Seon-Ok Kim2, Young-Kug Kim1 ![]()
1. Department of Anesthesiology and Pain Medicine, Asan Medical Center, University of Ulsan College of Medicine, Seoul, Korea;
2. Department of Clinical Epidemiology and Biostatistics, Asan Medical Center, University of Ulsan College of Medicine, Seoul, Korea.
Abstract
Background: The right ventricular end-diastolic volume index (RVEDVI) is a good indicator of preload in patients undergoing liver transplantation. Although dynamic indices, such as stroke volume variation (SVV), have been used as reliable indicators in predicting fluid responsiveness, the evaluation of the relationship between SVV and direct preload status is limited. We investigated the relationship between SVV and RVEDVI, and tested the cutoff value of SVV to predict RVEDVI during liver transplantation.
Methods: A total of 150 data pairs in 30 living donor liver transplant recipients were retrospectively investigated. Hemodynamic parameters, including SVV and RVEDVI were obtained from each patient at the 5 specific time points. Linear regression and receiver operating characteristic (ROC) curve analyses were performed.
Results: The SVV significantly correlated with the RVEDVI (r = -0.616, P < 0.001). Cutoff values for the upper and lower tertiles of RVEDVI were 157 mL/m2 and 128 mL/m2, respectively. Tertile analysis indicated that upper tertile of RVEDVI had a significantly lower SVV than the middle tertile (median; 5% vs 8%, P < 0.05), and middle tertile of RVEDVI had a significantly lower SVV than the lower tertile (median; 8% vs 11%, P < 0.05). A 6% cutoff value of SVV estimated the upper tertile RVEDVI (>157 mL/m2) with the area under the curve of ROC curve of 0.832. A 9% cutoff value of SVV estimated the lower tertile RVEDVI (<128 mL/m2) with the area under the curve of ROC curve of 0.792.
Conclusion: SVV may be a valuable estimator of RVEDVI in patients undergoing liver transplantation.
Keywords: liver transplantation, preload index, stroke volume variation, right ventricular end-diastolic volume index.
Introduction
Accurate estimation of the preload status and optimal intraoperative fluid management is a major concern in patients undergoing liver transplantation. The most direct clinical correlate of ventricular preload is the end-diastolic ventricular volume. Although traditional static preload indices, including central venous pressure (CVP) and pulmonary artery occluding pressure (PAOP), have been commonly used to guide volume management, such pressure-based measurements represent only an indirect estimate of preload, and thus may not appropriately reflect changes in cardiac preload.1,2 Instead, volumetric approaches, such as determination of the right ventricular end-diastolic volume index (RVEDVI) using the thermodilution technique, have been demonstrated to better reflect preload than other static indices in liver transplant recipients.3
Dynamic preload indices, such as stroke volume variation (SVV), have been used as reliable indicators in predicting fluid responsiveness.4 An elevated SVV greater than 12% to 15% suggests that a patient is on the steeper portion of the Frank-Starling curves, and can enable clinicians to discern between a possible responsiveness and non-responsiveness to a fluid challenge.5 However, the ability of SVV to predict fluid responsiveness is not actually binary but more typically linear, with a high SVV predicting a larger increase in stroke volume in response to fluid challenge than a small SVV.6 Moreover, the studies exploring the lower portion of SVV level or evaluating the relationship between SVV and direct preload status are limited. The objective of present study was to investigate the relationship between SVV and RVEDVI, and to test the cutoff value of SVV to predict RVEDVI during liver transplantation.
Materials and methods
After obtaining approval from our Institutional Ethics Committee, we retrospectively reviewed the electronic anesthesia records of 37 patients who underwent living donor liver transplantation surgery at the Asan Medical Center between April 2012 and June 2012. Seven patients were excluded from the analysis; four patients had cardiac arrhythmias and three patients had incomplete data with poor signal quality because of electrical noise.
All of the patients were subjected to our institutional standard anesthesia protocol for living donor liver transplantation.7-11 Briefly, anesthesia was induced with thiopental, fentanyl, midazolam and vecuronium, and was maintained using 1-2 vol% sevoflurane, 50% oxygen/air, and continuous infusion with vecuronium and fentanyl. Mechanical ventilation was performed without positive end-expiratory pressure, using a constant tidal volume of 8-10 mL/kg and a respiratory rate of 10-12 breaths/min to maintain a constant end tidal carbon dioxide tension of 30-35 mmHg.
Five-lead electrocardiography was applied and invasive radial arterial pressure was measured. The FloTrac/Vigileo device (software version 3.0, Edwards Lifescience, Irvine, CA) was used to analyze arterial pressure waveform data over 20-second intervals, using a recalibration interval of 1 minute. A 7.5 Fr pulmonary artery catheter (Swan-Ganz CCOmbo CCO/SvO2/CEDV, Edwards Lifescience), which was inserted via a 9-Fr introducer sheath into the internal jugular vein, was advanced to a wedged position under the guidance of a pressure curve. The pulmonary artery catheter was connected to a Vigilance device (Vigilance II, Edwards Lifescience), and STAT-mode RVEDVI was measured over 1-minute intervals to simultaneously obtain the corresponding SVV data. The Vigileo device computed SVV from its relationship to the difference between the maximal and minimal values of the stroke volume, divided by the mean value of stroke volume over a 20-second interval. We used a Multi-Data Logger (version 4.0, Edwards Lifescience) to capture and store patient data simultaneously from the Vigilance II and Vigileo devices.
Hemodynamic parameters, including blood pressure, heart rate, CVP, PAOP, SVV, and RVEDVI were obtained from each patient at the following time points: (1) 60 minutes after skin incision, (2) 30 minutes after extraction of the diseased liver, (3) 5 minutes after liver graft reperfusion, (4) 30 minutes after liver graft reperfusion, and (5) at the completion of hepatic artery reconstruction. The values of the hemodynamic measurements obtained at the five specific time points, which were obtained by determining the means of the measurements taken over 3-minute intervals, were used for statistical analysis. Measurement of the hemodynamic parameters investigated yielded a total of 150 data pairs.
The normality of distribution was assessed using the Shapiro-Wilk test. Normally distributed data were presented as the mean ± SD and skewed data were expressed as median values (interquartile range). Linear regressions among the RVEDVI, SVV, CVP, and PAOP values were assessed using the Pearson's or Spearman's rank order correlation coefficient, as appropriate. The differences in SVV divided by RVEDVI tertiles were compared using the one-way repeated measures analysis of variance on ranks with Dunn's test for pairwise multiple comparison. The area under the curve (AUC) values of receiver operating characteristic (ROC) curves that predict 100 mL/m2 (upper limit of RVEDVI in the normal population), 140 mL/m2 (approximate average value of the RVEDVI of liver transplant recipients from our previous publications),7-11 and the upper and lower tertiles of RVEDVI were calculated. Statistical analyses were performed using MedCalc 10.0.1.0 (MedCalc Software, Mariakerke, Belgium) and SPSS 20.0 for windows (SPSS Inc, Chicago, IL). Based on our preliminary data, the expected AUC was 0.8, thus at least 28 patients were required for ROC curve analysis compared to null hypothesis that SVV cannot discriminate RVEDVI (AUC of 0.5), with 0.05 of alpha and 0.8 of power. Because SVV and RVEDVI were measured 5 observations per patient (so-called cluster data), we used the block bootstrap, which tried to replicate the correlation by resampling instead of blocks of data. Specifically, standard errors and confidence intervals of the AUC are computed with block bootstrap resampling that accounted for clustering of same patient using R 2.14.0 (The R Foundation for Statistical Computing, Frederiksberg, Denmark). A P value of <0.05 was considered to denote a statistically significant difference.
Results
Thirty recipients (age: 52.9 ± 8.0 years, body mass index: 24.5 ± 3.4 kg/m2) were analyzed. The patient demographic data and the results of preoperative evaluation are presented in Table 1. During the overall operative period, the RVEDVI and SVV obtained at five predetermined time points were 143 (118-167) mL/m2 and 8% (5%-11%), respectively. The intraoperative values of mean arterial pressure, heart rate, CVP, and PAOP were 75 (64-85) mmHg, 77 (67-87) beats/min, 7 (5-10) mmHg, and 11 (8-15) mmHg, respectively. Table 2 shows hemodynamic data obtained at five predetermined time points during liver transplantation in 30 recipients.
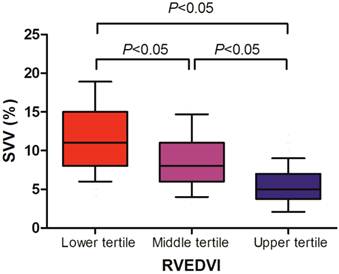
We found that the SVV well correlated with the RVEDVI (r = -0.616, P < 0.001), whereas the CVP (r = -0.107, P = 0.189) and PAOP (r = -0.184, P = 0.305) did not (Table 3). Cutoff values for the upper and lower tertiles of RVEDVI were 157 mL/m2 and 128 mL/m2, respectively. The relationships between RVEDVI tertiles and SVV are shown in Figure 1. We found that the upper tertile of RVEDVI had a significantly lower SVV than middle tertile (median; 5% vs 8%, P < 0.05), and middle tertile of RVEDVI had a significantly lower SVV than the lower tertile (median; 8% vs 11%, P < 0.05).
Table 4 indicates the cutoff values and their AUCs of the SVV measurements predicting different RVEDVI values. A 6% cutoff value for the SVV estimated the upper tertile of RVEDVI (>157 mL/m2) with a sensitivity 72% and a specificity 81%, and the AUC of the SVV was 0.832 (95% confidence interval 0.740-0.905). A 9% cutoff value for the SVV estimated the lower tertile of RVEDVI (<128 mL/m2) with a sensitivity 83% and a specificity 60%, and the AUC of the SVV was then 0.792 (95% confidence interval 0.709-0.871).
Stroke volume variation (SVV) according to right ventricular end-diastolic volume index (RVEDVI) tertile in liver transplant recipients. Data are shown in box-plot, with 10%-90% ranges (whiskers), interquartile ranges (boxes), and median (solid line).
Demographic Data and Preoperative Findings of 30 Liver Transplant Recipients.
| Characteristics | ||
|---|---|---|
| Sex (M/F) | 19/11 | |
| Age (yr) | 52.9 ± 8.0 | |
| Weight (kg) | 65.1 ± 11.9 | |
| Height (cm) | 162.8 ±10.6 | |
| Classification of liver transplant recipients | ||
| Hepatitis virus-related liver cirrhosis | 24 | |
| Secondary biliary cirrhosis | 1 | |
| Alcoholic cirrhosis | 1 | |
| Autoimmune or cryptogenic cirrhosis | 4 | |
| Child-Turcotte-Pugh score | 7.6 ± 2.0 | |
| Model for End-Stage Liver Disease score | 13.0 ± 5.6 | |
| Preoperative transthoracic echocardiographic findings | ||
| Ejection fraction (%) | 63.5 ± 4.0 | |
| End-diastolic volume (mL) | 109.0 ± 38.6 | |
| End-systolic volume (mL) | 40.1 ± 16.1 | |
| Left ventricular mass (g) | 146.9 ± 46.4 | |
| Preoperative hematologic profiles | ||
| Hemoglobin (g/dL) | 11.0 ± 2.0 | |
| Platelet count (* 103/mm3) | 62.5 ± 34.6 | |
| Prothrombin time (international normalized ratio) | 1.4 ± 0.3 | |
| Albumin (g/dL) | 3.2 ± 0.6 | |
| Creatinine (mg/dL) | 0.8 ± 0.2 | |
| Bilirubin (mg/dL) | 3.8 ± 7.1 | |
Values represent number of recipients or mean ± SD.
Hemodynamic Data Obtained at Five Predetermined Time Points During Liver Transplantation in 30 Recipients.
| Parameter | I+60 | A+30 | R+5 | R+30 | HA |
|---|---|---|---|---|---|
| MAP (mmHg) | 82.7 ± 14.7 | 80.0 ± 13.0 | 70.5 ± 22.2* | 74.3 ± 12.9* | 70.1 ± 11.7* |
| HR (beats/min) | 81.0 ± 16.5 | 82.5 ± 13.6 | 80.1 ± 13.8 | 77.0 ± 11.9 | 72.4 ± 13.9* |
| CVP (mmHg) | 8.5 ± 4.0 | 7.5 ± 4.8 | 6.7 ± 4.8 | 7.6 ± 4.9 | 6.7 ± 3.8* |
| PAOP (mmHg) | 11.0 ± 4.2 | 9.7 ± 3.1 | 10.4 ± 4.0 | 11.6 ± 3.8 | 11.3 ± 4.0 |
| BT (°C) | 36.0 ± 0.5 | 35.2 ± 0.8* | 34.5 ± 1.0* | 34.8 ± 0.9* | 35.3 ± 0.9* |
| Values derived from the PAC | |||||
| CO (L/min) | 6.6 ± 1.9 | 5.6 ± 1.8* | 6.5 ± 2.2 | 7.4 ± 1.8* | 6.8 ± 1.5 |
| SV (mL/beat) | 81.7 ± 23.1 | 67.0 ± 22.3* | 77.7 ± 25.4 | 97.4 ± 26.6* | 95.5 ± 24.9* |
| RVEDVI (mL/m2) | 153.1 ± 31.0 | 130.5 ± 35.6* | 137.1 ± 35.9* | 152.8 ± 34.8 | 154.4 ± 38.8 |
| SVR (dyne · s/cm5) RVEF (%) | 945.8 ± 365.3 32.1 ± 5.5 | 1077.2 ± 470.2 31.5 ± 6.3 | 884.2 ± 530.0 33.6 ± 5.2 | 721.4 ± 237.0* 37.5 ± 6.5* | 753.6 ± 253.5* 37.9 ± 8.2* |
| Values derived from the Vigileo | |||||
| CO (L/min) | 6.7 ± 2.2 | 5.8 ± 1.8* | 7.5 ± 3.1* | 7.1 ± 2.3 | 6.7 ± 2.2 |
| SV (mL/beat) | 90.6 ± 31.4 | 73.5 ± 24.7* | 90.3 ± 36.0 | 92.4 ± 33.1 | 95.0 ± 34.9 |
| SVV (%) | 8.4 ± 4.5 | 10.5 ± 5.5 | 9.3 ± 5.1 | 7.3 ± 3.2 | 7.2 ± 3.6 |
| SVR (dyne · s/cm5) | 888.8 ± 303.7 | 897.3 ± 322.9 | 677.8 ± 247.1* | 729.5 ± 261.6* | 780.7 ± 319.1* |
Data are presented as mean ± SD. MAP, mean arterial pressure; HR, heart rate; CVP, central venous pressure; PAOP, pulmonary arterial occlusion pressure; BT, body temperature; PAC, pulmonary arterial catheter; CO, cardiac output; SV, stroke volume; RVEDVI, right ventricular end-diastolic volume index; SVR, systemic vascular resistance; RVEF, right ventricular ejection fraction; SVV, stroke volume variation; I+60, 60 minutes after skin incision; A+30, 30 minutes after extraction of the diseased liver; R+5, 5 minutes after liver graft reperfusion; R+30, 30 minutes after liver graft reperfusion; HA, at the completion of hepatic artery reconstruction. *P<0.05 compared with hemodynamic values obtained at the I+60 time point.
Correlations Between RVEDVI and Preload Variables Obtained at Five Predetermined Time Points During Liver Transplantation in 30 Recipients.
| I+60 | A+30 | R+5 | R+30 | HA | ||
|---|---|---|---|---|---|---|
| SVV vs RVEDVI | r | -0.560 | -0.566 | -0.658 | -0.701 | -0.592 |
| P | 0.001 | 0.001 | <0.001 | <0.001 | <0.001 | |
| CVP vs RVEDVI | r | 0.037 | -0.304 | 0.048 | -0.070 | 0.014 |
| P | 0.845 | 0.103 | 0.803 | 0.971 | 0.942 | |
| PAOP vs RVEDVI | r | 0.351 | -0.107 | -0.061 | -0.081 | 0.002 |
| P | 0.057 | 0.575 | 0.751 | 0.669 | 0.990 | |
SVV, stroke volume variation; RVEDVI, right ventricular end-diastolic volume index; CVP, central venous pressure; PAOP, pulmonary arterial occlusion pressure; I+60, 60 minutes after the incision; A+30, 30 minutes after extraction of the diseased liver; R+5, 5 minutes after liver graft reperfusion; R+30, 30 minutes after liver graft reperfusion ; HA, at the completion of hepatic artery reconstruction.
Cutoff Values of SVV Predicting RVEDVI Level During Liver Transplantation.
| RVEDVI (mL/m2) | SVV cutoff value (%) | AUC | Standard error | Significance level (Comparison to AUC of 0.5) | Sensitivity (%) | Specificity (%) |
|---|---|---|---|---|---|---|
| 100a | 12 | 0.814 | 0.0558 | 0.0001 | 85.5 | 66.7 |
| (0.704-0.925) | (79.7-91.3) | (41.7-91.7) | ||||
| 128b | 9 | 0.792 | 0.0417 | 0.0001 | 83.0 | 60.0 |
| (0.709-0.871) | (75.0-90.0) | (46.0-72.0) | ||||
| 140c | 7 | 0.799 | 0.0395 | 0.0001 | 66.7 | 78.3 |
| (0.719-0.870) | (55.6-76.5) | (69.5-87.0) | ||||
| 157d | 6 | 0.832 | 0.0426 | 0.0001 | 72.0 | 81.0 |
| (0.740-0.905) | (60.0-84.0) | (73.0-89.0) |
Data are presented as number (95% confidence interval). RVEDVI, right ventricular end-diastolic volume index; SVV, stroke volume variation; AUC, area under the curve. a upper limit of RVEDVI in normal population, b lower tertile of RVEDVI in present dataset, c approximate mean value of RVEDVI in our previous studies,7-11 and d upper tertile of RVEDVI in present dataset.
Discussion
A major finding of our present study is that SVV may be a useful preload index in patients undergoing liver transplantation. We found that each tertiles of RVEDVI were significantly discriminated from each other by SVV values. We also found that the SVV has a superior correlation coefficient with RVEDVI compared with the CVP or PAOP, suggesting that it may be a better preload index than indicators of static filling pressure in liver transplant recipients.
Patients undergoing liver transplantation may develop significant hemodynamic instability. In such patients, monitoring of a reliable preload index would aid in the differential diagnosis of hypotension and optimal guidance for hemodynamic management. The RVEDVI, measured by thermodilution using a pulmonary artery catheter, is an accurate predictor of the intravascular volume status in critically ill surgical patients with open abdomens.12 Although a possible disadvantage is that the thermodilutional technique can overestimate the preload status compared to 3-dimensional echocardiography or magnetic resonance imaging,13-15 the availabilities of latter two modalities are relatively limited in the operating theater. The assessment of right ventricle by magnetic resonance imaging is still a very difficult task due to its geometric complexity, and the echocardiographic transgastric view is unavailable during most of liver transplant procedure because of posterior retraction of the stomach.3 Furthermore, the RVEDVI is still regarded as the best clinical estimator of a right ventricular preload in patients undergoing liver transplantation,3,16,17 and its use during liver transplantation is encouraged.18,19 In agreement with our previous studies,7-11 the RVEDVI obtained from patients undergoing liver transplantation in our present report typically showed a relatively high values (approximate average 140 mL/m2, range 76-264 mL/m2), compared with healthy individuals (60-100 mL/m2). Given that the high range of the RVEDVI observed in end-stage liver disease patients implies hyperdynamic circulation, caution is warranted when using this parameter to assess the volume status in such cases.
We found in our current analyses that the SVV significantly correlates with the RVEDVI over a wide range in recipients undergoing liver transplantation, and that lower SVV values are associated with higher RVEDVI values. This result indicates that an increase in ventricular preload during liver transplantation surgery may be estimated by simply identifying the decrease in SVV. Several sources of evidence support the proposal that SVV reflects the intravascular volume status and can serve as a valuable preload index. Reuter et al.20 showed in the earlier report that 500 mL of blood removal in patients undergoing coronary artery bypass surgery significantly increases the SVV (from 6.7% to 12.7%), whilst decreasing both the cardiac index determined by thermodilution (from 2.9 L/min/m2 to 2.3 L/min/m2) and the global EDVI determined by PiCCO pulse-contour analysis (from 650 mL/m2 to 565 mL/m2). Following blood removal, substitution of the volume with 500 mL of hydroxyethyl starch caused SVV to decrease significantly (from 12.7% to 6.8%), while significant increases were noted for both the cardiac index (from 2.3 to 3.3 L/min/m2) and global EDVI (from 565 to 663 mL/m2).20 However, a limitation of their study is that they did not evaluate the direct correlation between the SVV and RVEDVI.
An important implication of present study is that each tertiles of RVEDVI can be estimated by SVV in patients undergoing liver transplantation. We found that the upper tertile RVEDVI (>157 mL/m2) in our patient population can be discriminated by a 6% SVV cutoff value with good credibility (AUC = 0.832). Interestingly, we had previously shown that a low SVV (<6%) is associated with increased intraoperative hemorrhage (>700 mL) during hepatectomy in living liver donors.21 Our previous and present results indicate that the SVV is a significant predictor of increased donor hepatectomy-related blood loss, whilst also providing a valuable functional preload index. A possible mechanism underlying a low SVV value could involve an association with decreased respiratory variations of venous return and stroke volume, suggesting that low SVV values may be associated with increased intravascular volume status. In contrast, a high SVV was not found to be associated with increased intravascular volume status and hemorrhage during donor hepatectomy.21 In our present analysis, an RVEDVI of 128 mL/m2 (lower tertile) can be discriminated by an SVV cutoff value of 9%. In addition, an RVEDVI of 100 mL/m2, which is at approximately the upper limit of this parameter in healthy individuals,22 has an SVV cutoff value of 12%. A higher SVV may be seen in patients with hypovolemia, resulting from a steeper position of the Frank-Starling curve and collapsible vena cava.
In agreement with previous reports,23 we found in our present study that the SVV was better correlated with the RVEDVI than with the CVP or PAOP measures. Although CVP has been used to estimate preload in major surgery, recent studies have shown a lack of correlation between CVP and preload status.2 Moreover, CVP measurements may be uncertain, especially because it can be affected by factors such as patient position, liver manipulation by the surgeon, tricuspid-valve disease, positive end expiratory pressure, and intra-abdominal pressure.24 In addition, although CVP monitoring has been strongly advocated to reduce hepatic venous bleeding during parenchymal transaction,25,26 several recent studies have found no significant correlation between CVP and blood loss during hepatic resection.27-29 The PAOP, measured using a pulmonary artery catheter, has been considered to be a good index of left ventricular preload. However, changes in PAOP have also been shown to correlate poorly with changes in ventricular volume during liver transplantation.30 Furthermore, the lack of evidence for any improved outcomes with the pulmonary arterial catheter and the fear of development of fatal complications during insertion may account for the decreased use of PAOP as a preload index.18,31
The results of our present study need to be interpreted with some caution. Firstly, as mentioned above, thermodilutional technique has its own disadvantage which can overestimate RVEDVI. Although RVEDVI is clearly a better indicator of preload than other filling pressure and its serial measurements can be reliably used,3 the possible overestimation of RVEDVI may be considered in interpretation of the result of present study.13,14 Secondly, because our present study was performed at a single large volume center, the results may differ from those of multicenter studies or from the results of other centers. However, the characteristic of patient population in this study was comparable to that of our previous studies on elective living donor liver transplantation surgery,7-11 which suggests little probability of any selection bias in the population selected. Lastly, our study has the limitation in that retrospective analyses of results obtained from the computerized database were performed.
To our knowledge, this is the first report to investigate the correlation between the SVV and RVEDVI in liver transplant recipients, and provides the best SVV cutoff values to estimate the RVEDVI using ROC curve analysis. Our current results suggest that the SVV may be a better preload index than traditional static hemodynamic parameters, including CVP and PAOP. We thus propose that our current data offer valuable clinical insights into the use of the SVV as a useful preload index, especially when pulmonary arterial catheter is unavailable.
Acknowledgements
We thank Yong-Il Song (Department of Biomedical Engineering, Boston University) for his help in revising this manuscript.
Competing Interests
The authors have declared that no competing interest exists.
References
1. Bendjelid K, Romand JA. Fluid responsiveness in mechanically ventilated patients: a review of indices used in intensive care. Intensive Care Med. 2003;29:352-60
2. Kumar A, Anel R, Bunnell E, Habet K, Zanotti S, Marshall S, Neumann A, Ali A, Cheang M, Kavinsky C, Parrillo JE. Pulmonary artery occlusion pressure and central venous pressure fail to predict ventricular filling volume, cardiac performance, or the response to volume infusion in normal subjects. Crit Care Med. 2004;32:691-9
3. Rocca GD, Costa MG, Feltracco P, Biancofiore G, Begliomini B, Taddei S, Coccia C, Pompei L, Di Marco P, Pietropaoli P. Continuous right ventricular end diastolic volume and right ventricular ejection fraction during liver transplantation: a multicenter study. Liver Transpl. 2008;14:327-32
4. Nishiyama T. Recent advance in patient monitoring. Korean J Anesthesiol. 2010;59:144-59
5. Marik PE, Cavallazzi R, Vasu T, Hirani A. Dynamic changes in arterial waveform derived variables and fluid responsiveness in mechanically ventilated patients: a systematic review of the literature. Crit Care Med. 2009;37:2642-7
6. Benington S, Ferris P, Nirmalan M. Emerging trends in minimally invasive haemodynamic monitoring and optimization of fluid therapy. Eur J Anaesthesiol. 2009;26:893-905
7. Huh IY, Kim YK, Shin WJ, Park SE, Bang JY, Hwang GS. Increased B-type natriuretic peptide during liver transplantation: relationship to invasively measured hemodynamic parameters. Transplant Proc. 2012;44:1318-22
8. Kim YK, Shin WJ, Song JG, Jun IG, Kim HY, Seong SH, Huh IY, Hwang GS. Effect of right ventricular dysfunction on dynamic preload indices to predict a decrease in cardiac output after inferior vena cava clamping during liver transplantation. Transplant Proc. 2010;42:2585-9
9. Kim YK, Shin WJ, Song JG, Jun IG, Kim HY, Seong SH, Hwang GS. Comparison of stroke volume variations derived from radial and femoral arterial pressure waveforms during liver transplantation. Transplant Proc. 2009;41:4220-8
10. Chin JH, Kim YK, Choi WJ, Bang JY, Kim WJ, Kim SH, Song MH, Hwang GS. A retrospective case-control study of intraoperative cardiac dysfunction in elderly patients (≥60 years) undergoing live donor liver transplantation. Transplant Proc. 2011;43:1678-83
11. Kim YK, Shin WJ, Song JG, Kim Y, Kim WJ, Kim SH, Hwang GS. Evaluation of intraoperative brain natriuretic peptide as a predictor of 1-year mortality after liver transplantation. Transplant Proc. 2011;43:1684-90
12. Cheatham ML, Safcsak K, Block EF, Nelson LD. Preload assessment in patients with an open abdomen. J Trauma. 1999;46:16-22
13. De Simone R, Wolf I, Mottl-Link S, Bottiger BW, Rauch H, Meinzer HP, Hagl S. Intraoperative assessment of right ventricular volume and function. Eur J Cardiothorac Surg. 2005;27:988-93
14. Rosendal C, Almamat Uulu K, De Simone R, Wolf I, Deckert A, Martin EO, Bottiger BW, Rauch H. Right ventricular function during orthotopic liver transplantation: three-dimensional transesophageal echocardiography and thermodilution. Ann Transplant. 2012;17:21-30
15. Hoeper MM, Tongers J, Leppert A, Baus S, Maier R, Lotz J. Evaluation of right ventricular performance with a right ventricular ejection fraction thermodilution catheter and MRI in patients with pulmonary hypertension. Chest. 2001;120:502-7
16. Siniscalchi A, Pavesi M, Piraccini E, De Pietri L, Braglia V, Di Benedetto F, Lauro A, Spedicato S, Dante A, Pinna AD, Faenza S. Right ventricular end-diastolic volume index as a predictor of preload status in patients with low right ventricular ejection fraction during orthotopic liver transplantation. Transplant Proc. 2005;37:2541-3
17. De Wolf AM, Begliomini B, Gasior TA, Kang Y, Pinsky MR. Right ventricular function during orthotopic liver transplantation. Anesth Analg. 1993;76:562-8
18. De Wolf AM, Aggarwal S. Monitoring preload during liver transplantation. Liver Transpl. 2008;14:268-9
19. Della Rocca G, Costa MG, Coccia C, Pompei L, Salandin V, Pierangelo DM, Pietropaoli P. Continuous right ventricular end-diastolic volume in comparison with left ventricular end-diastolic area. Eur J Anaesthesiol. 2009;26:272-8
20. Reuter DA, Goepfert MS, Goresch T, Schmoeckel M, Kilger E, Goetz AE. Assessing fluid responsiveness during open chest conditions. Br J Anaesth. 2005;94:318-23
21. Kim YK, Shin WJ, Song JG, Jun IG, Hwang GS. Does stroke volume variation predict intraoperative blood loss in living right donor hepatectomy?. Transplant Proc. 2011;43:1407-11
22. Gopal AS, Chukwu EO, Iwuchukwu CJ, Katz AS, Toole RS, Schapiro W, Reichek N. Normal values of right ventricular size and function by real-time 3-dimensional echocardiography: comparison with cardiac magnetic resonance imaging. J Am Soc Echocardiogr. 2007;20:445-55
23. Su BC, Tsai YF, Cheng CW, Yu HP, Yang MW, Lee WC, Lin CC. Stroke volume variation derived by arterial pulse contour analysis is a good indicator for preload estimation during liver transplantation. Transplant Proc. 2012;44:429-32
24. Gelman S. Venous function and central venous pressure: a physiologic story. Anesthesiology. 2008;108:735-48
25. Cunningham JD, Fong Y, Shriver C, Melendez J, Marx WL, Blumgart LH. One hundred consecutive hepatic resections. Blood loss, transfusion, and operative technique. Arch Surg. 1994;129:1050-6
26. Melendez JA, Arslan V, Fischer ME, Wuest D, Jarnagin WR, Fong Y, Blumgart LH. Perioperative outcomes of major hepatic resections under low central venous pressure anesthesia: blood loss, blood transfusion, and the risk of postoperative renal dysfunction. J Am Coll Surg. 1998;187:620-5
27. Kim YK, Chin JH, Kang SJ, Jun IG, Song JG, Jeong SM, Park JY, Hwang GS. Association between central venous pressure and blood loss during hepatic resection in 984 living donors. Acta Anaesthesiol Scand. 2009;53:601-6
28. Chhibber A, Dziak J, Kolano J, Norton JR, Lustik S. Anesthesia care for adult live donor hepatectomy: our experiences with 100 cases. Liver Transpl. 2007;13:537-42
29. Niemann CU, Feiner J, Behrends M, Eilers H, Ascher NL, Roberts JP. Central venous pressure monitoring during living right donor hepatectomy. Liver Transpl. 2007;13:266-71
30. Della Rocca G, Costa MG, Coccia C, Pompei L, Pietropaoli P. Preload and haemodynamic assessment during liver transplantation: a comparison between the pulmonary artery catheter and transpulmonary indicator dilution techniques. Eur J Anaesthesiol. 2002;19:868-75
31. Krenn CG, De Wolf AM. Current approach to intraoperative monitoring in liver transplantation. Curr Opin Organ Transplant. 2008;13:285-90
32. Kim HK, Kim YJ, Park EA, Bae JS, Lee W, Kim KH, Kim KB, Sohn DW, Ahn H, Park JH, Park YB. Assessment of haemodynamic effects of surgical correction for severe functional tricuspid regurgitation: cardiac magnetic resonance imaging study. Eur Heart J. 2010;31:1520-8
33. Wyler von Ballmoos M, Takala J, Roeck M, Porta F, Tueller D, Ganter CC, Schroder R, Bracht H, Baenziger B, Jakob SM. Pulse-pressure variation and hemodynamic response in patients with elevated pulmonary artery pressure: a clinical study. Crit Care. 2010;14:R111
34. Daudel F, Tuller D, Krahenbuhl S, Jakob SM, Takala J. Pulse pressure variation and volume responsiveness during acutely increased pulmonary artery pressure: an experimental study. Crit Care. 2010;14:R122
Author contact
![]() Corresponding author: Young-Kug Kim, M.D., Ph.D., Associate Professor, Department of Anesthesiology and Pain Medicine, Asan Medical Center, University of Ulsan College of Medicine, 388-1 Pungnap-2dong, Songpa-gu, Seoul, 138-736, Korea. Phone: 82-2-3010-3868; Fax: 82-2-470-1363; E-mail: kykseoul.kr.
Corresponding author: Young-Kug Kim, M.D., Ph.D., Associate Professor, Department of Anesthesiology and Pain Medicine, Asan Medical Center, University of Ulsan College of Medicine, 388-1 Pungnap-2dong, Songpa-gu, Seoul, 138-736, Korea. Phone: 82-2-3010-3868; Fax: 82-2-470-1363; E-mail: kykseoul.kr.
Received 2013-2-14
Accepted 2013-4-10
Published 2013-4-18