ISSN: 1449-1907International Journal of Medical Sciences
- Current issue
- Volume 21; 2024
- Volume 20; 2023
- Volume 19; 2022
- Volume 18; 2021
- Volume 17; 2020
- Archive
- Cover images
- Index & coverage
- Cover suggestion
- Special issues
Introduction
Methods and materials
Results
Discussion
Conclusion
Abbreviations
Acknowledgements
References

Int J Med Sci 2013; 10(5):548-559. doi:10.7150/ijms.5191 This issue Cite
Research Paper
Expression of HGF and Met in Human Tissues of Colorectal Cancers: Biological and Clinical Implications for Synchronous Liver Metastasis
Yan-lai Sun1,2*, Wei-dong Liu3*, Guo-yuan Ma1, Dong-wei Gao1, Yuan-zhu Jiang1, Qi Liu1 ![]() , Jia-jun Du1
, Jia-jun Du1 ![]()
1. Institute of Oncology, Provincial Hospital Affiliated to Shandong University, Shandong University, 324 Jingwu Road, Jinan 250021, China;
2. Department of Gastrointestinal tumor surgery, Shandong cancer hospital, 440 Jiyan Road, Jinan, 250117, China;
3. Shandong Medical Imaging Research Institute, 324 Jingwu Road, Jinan 250021, China.
* These authors equally contributed to this work.
Abstract
Background and aims: Synchronous liver metastasis (SLM) remains a significant problem in newly diagnosed colorectal cancer (CRC). The system of hepatocyte growth factor (HGF) and Met plays an important role in cancer invasion and metastasis and is being developed to be targeted drugs. We aimed to investigate the role of HGF/Met in SLM based on a case-matched study and comparison between primary tumors and matched metastases.
Methods: A group of 30 patients with SLM and other two groups of patients without SLM in a hospital database were collected. They were matched into according to clinicopathological factors. 81 patients were included in the study. Their tissues of primary colorectal cancers, lymph nodes and liver metastases were collected to detect HGF and Met expression by immunohistochemistry and RT-PCR.
Results: Expression of HGF and Met at the protein level and the RNA level in primary CRCs with SLM were significantly higher than that in primary colorectal carcinomas without liver metastases (all P value<0.05). Their expression was only related to SLM when concurrent with regional lymph node metastasis (all P value<0.05) but had little influence on SLM without involvement of lymph node metastasis (all P value>0.05). Comparison their expression between primary tumors and matched metastases, major concordance and minor difference existed.
Conclusions: HGF and Met may exert functions in the development of SLM when concurrent with lymph node metastases but had little influence on SLM without lymph node metastasis, further indicating their roles and potential values for a subtype of colorectal cancer metastasis. Major concordance and minor difference exist between primary tumors and matched metastases, which further provides evidence for evaluating the response to their inhibitors based on primary tumors or metastases.
Keywords: colorectal carcinoma, synchronous liver metastasis, hepatocyte growth factor, Met.
Introduction
Colorectal cancer (CRC) is one of the most common human neoplasms. Synchronous liver metastases (SLM) account for approximately 15% of newly diagnosed CRC patients, which are often resistant to conventional therapies and lead to a poor prognosis[1]. Therefore, they need more effective treatments. A better understanding of the mechanism for SLM development will provide a biological foundation for the design of more effective specific drugs.
The system of hepatocyte growth factor (HGF) and its receptor of Met had been found to play a vital role in metastasis of CRCs[2-6]. Experimental studies have shown that the pathway was important for proliferation, invasion and migration of colorectal cancer cells, the prerequisites for cancer cell metastasis. When the antagonist Nk4 was used to inhibit the ability of HGF in colon cancer cells, metastasis decreased in animal models[7]. Inhibition of HGF and Met was reported to prevent distant metastasis for rectal cancer after preoperative chemoradiotherapy[8]. In clinical reports, Met amplification and overexpression at the levels of DNA, RNA and protein were observed in colonic adenomas, primary tumors and liver metastases while less expression existed in normal colonic tissues[2,3,9]. HGF was also detected in primary tumors and metastases of CRCs[9,10]. But HGF expression showed no significant differences between tumor and normal tissues[9], indicating that metastatic potential enhanced by HGF and Met was due to the overexpression of Met increasing sensitivity to HGF[11]. Their expression in primary tumors was associated with colorectal cancer metastasis and has been used to evaluate prognosis and metastasis of colorectal cancer[2-4,6,12-18]. At the treatment levels, the inhibitors of HGF/Met are being developed to be novel targeted drugs[19,20] for controlling colorectal cancer metastasis[8,21].
However, it seems that there are some limitations for these reports when considering the relationship between the pathway and SLM. Recent studies suggest that SLM is an independent entity in CRC[22,23] and is different from other metastases and even metachronous liver metastasis at the levels of biology and treatment[24]. Previous studies did not distinguish SLM from other metastases. For CRC patients with SLM, some are concurrent with regional lymph node metastases (RLNM), others directly develop into SLM without RLNM involving, which remains an unsolved issue. RLNM and other clinicopathological factors such as age in female patients and primary tumor site[25] have influence on SLM. Some of previous clinical studies didn't eliminate the influence of these factors when they investigated the relationship between the pathway and colorectal cancer metastasis. Moreover, the inhibitors of Met and HGF may be useful to treat metastatic tumors. Nevertheless, there are heterogeneity between primary CRCs and liver metastases[26], which will lead to different response to drugs[27,28]. Evaluation of the response to molecular targets is mainly based on their status in primary tumors[28]. EGFR inhibitors in clinical practice have raised a question whether metastatic sites need biopsies when they are used to treat advanced stage CRCs[29]. The same question also exists for the inhibitors of HGF/Met in treatment of CRC metastasis. Several studies have compared HGF and Met expression between primary CRCs and matched metastases but showed controversial results[2,3,9,15]. These questions will make puzzling on understanding of the biology of SLM and treatment of SLM using the inhibitors of HGF and Met.
To solve the puzzling, we designed a case-control study and detected expression of HGF and Met in primary CRCs with SLM versus primary CRC without SLM. For patients with metastases, the two molecules were also detected in their primary tumors and corresponding metastases. Based on comparison their expression in primary tumors with SLM versus without SLM, and comparison their expression between primary tumors and corresponding metastases, we aimed to investigate the role of the pathway in SLM and to explore whether their expression was concordant or different between primary CRCs and corresponding metastases.
Methods and materials
Patients and tissue samples
Between June 2001 and June 2010, 253 patients with SLM were found in 1557 newly diagnosed CRC patients from Shandong Cancer Hospital. Only 30 patients with SLM in the pathological database received radical resection and had complete clinical data, which were divided into two subgroups according to the presence of RLNM. One Subgroup included 21 patients with TxN1-2Mliver and the other subgroup included 9 patients with TxN0Mliver. In the subgroup with TxN1-2Mliver, each patient was matched to two patients of one with TxN1-2M0 and the other with TxN0M0. In the other subgroup, each patient with TxN0Mliver was matched to one patient with TxN0M0. Each pair had the same status at age, gender, depth of invasion, differentiation and tumor site so as to eliminate their influence on SLM. Finally, 81 patients in the total three matched groups were included in the study. The matched groups and their clinicopathological factors were shown in Table 1. 51 matched patients without liver metastases at initial diagnose were followed up for at least six months after surgery so as to exclude SLMs. They could provide available tissues including primary tumors and matched metastases. None of the cases received adjuvant therapy before surgery. Their formalin-fixed, paraffin-embedded (FFPE) tissues of primary tumors (81 specimens), matched lymph node metastases (42 specimens) and liver metastases (30 specimens) were collected to detect HGF and Met expression at the protein level and RNA level using the methods of immunohistochemistry(IHC) and real-time reverse transcription-polymerase chain reaction(RT-PCR). All patients in the study were consented according to the ethical standards of the Helsinki Declaration of 1975.
IHC
The method has been described in our previous report[30]. Briefly, formalin-fixed, paraffin-embedded tissue sections were routinely progressed according to Kit Instructions. The dilution for primary antibodies against HGF and Met (respective, H-145, C-12, Santa Cruz Biotechnology, Santa Cruz, CA, USA) was 1:100. Secondary anti-rabbit antibodies were applied on slides for 30min at 37°C, and then followed by Label Streptavidin/Peroxidase (S-A/HRP, Zymed Laboratories, South San Francisco, CA) for 30 min at 37°C. The slides were finally developed with diaminobenzidine and counterstained with hematoxylin. A known positive control section for each antibody was stained under equivalent conditions to ensure proper staining. PBS was used as a substitute for primary antibody as negative control in the same manner.
Immunohistochemistry evaluation
The specimens were evaluated independently by three of the authors in a blind fashion without previous knowledge of clinical data. The results for c-MET were classified into four scores dependent on the intensity of immunostaining 0, negative; 1, weak; 2, medium; and 3, strong[16]. The sample was classified as positive when the intensity of Met-stained tumor cells in a given specimen was greater than grade 1. HGF immunoreactivities were evaluated as either positive or negative, with a cut-off value of 50% of positively stained cancer cells, according to previous reports[31].
Clinicopathological Data.
| One subgroup | The other subgroup | Total three matched groups | |||||||
|---|---|---|---|---|---|---|---|---|---|
| T1-4N0M1 versus T1-4N0M0 (9 matches) | T1-4N1-2M1 versus T1-4N1-2M0 versus T1-4N0M0 (21 matches) | T1-4N0-2M1 versus T1-4N1-2M0 versus T1-4N0M0 | |||||||
| Total | SLM | PT | SLM | LN | PT | SLM | LN | PT | |
| cases | 81 | 9 | 9 | 21 | 21 | 21 | 30 | 21 | 30 |
| Gender | |||||||||
| M | 51 | 6 | 6 | 13 | 13 | 13 | 19 | 13 | 19 |
| F | 30 | 3 | 3 | 8 | 8 | 8 | 11 | 8 | 11 |
| Age (y) | 62 | 67 | 67 | 62 | 62 | 62 | 62.5 | 62 | 62.5 |
| Site | |||||||||
| Colon | 10 | 2 | 2 | 2 | 2 | 2 | 4 | 2 | 4 |
| Sigmoid | 16 | 5 | 5 | 2 | 2 | 2 | 7 | 2 | 7 |
| Rectum | 55 | 2 | 2 | 17 | 17 | 17 | 19 | 17 | 19 |
| Tumor differentiation | |||||||||
| Low | 13 | 2 | 2 | 3 | 3 | 3 | 5 | 3 | 5 |
| moderate | 62 | 7 | 7 | 16 | 16 | 16 | 23 | 16 | 23 |
| High | 6 | 2 | 2 | 2 | 2 | 2 | 2 | ||
| Depth of invasion | |||||||||
| T1 | 2 | 1 | 1 | 1 | 1 | ||||
| T3 | 51 | 17 | 17 | 17 | 17 | 17 | 17 | ||
| T4 | 28 | 8 | 8 | 4 | 4 | 4 | 12 | 4 | 12 |
| Lymph node stage | |||||||||
| N0 | 39 | 9 | 9 | 21 | 9 | 30 | |||
| N1 | 14 | 7 | 7 | 7 | 7 | ||||
| N2 | 28 | 14 | 14 | 14 | 14 | ||||
SLM: primary colorectal cancer with synchronous liver metastasis; LN: primary colorectal cancer with regional metastasis; PT: primary colorectal cancer without any metastasis.
RNA extraction from FFPE and RT-PCR
FFPE tissue sections were used to extract RNA. For all samples, at least 50% of the total cells analyzed should be tumor cells. For regional lymph node metastases, their FFPE sections have been used to conduct the analyses of routine pathological diagnosis and IHC and contain very few tumor cells. Thus, they were excluded to extract RNA. Only FFPE tissues sections from primary tumors and liver metastases were used to extract RNA. Twenty 3-μm FFPE tissue sections were used to extract RNA using RNeasy FFPE Kit under manufacturer's instructions (Qiagen, Santa Clarita, CA). RNA concentration and purity was determined by microspectrophotometer (OD260/230≥1.7, OD260/280=2.0±0.2). Total cellular RNA was isolated with overall yields ranging from 0 to 12.6μg with concentrations from 0 to over 420 ng/μL, which was used to detect expression of HGF and Met at the RNA level. For mRNA detection of target genes, cDNAs were synthesized from 1ug RNA using Easyscript first-strand cDNA synthesis supermix(Transgene, Beijing, China) with primer oligo-dT. In brief, genomic amplification primers and probes for HGF/Met and 18s rRNA were designed using the Primer Express software (Applied Biosystems, Foster City, CA). Primer and probe sequences for HGF, Met and 18s rRNA were respectively (5'-3') HGF: F-GGGTCTCCGCTGGTGGTCCTACCA, R-GGGGCTCCTCTTGTCATCAGTCCCA, FAM-CAGTGTTCAGAAGTTG; Met: F-GGAGCCAAAGTCCTTTCATCTGTAA, R-GCAATGGATGATCTGGG-AAATAAGAAGAAT, FAM-CCGGTTCATCAACTTC; 18srRNA: F-CCCTGTAATTGGAATG, R-GCTGGAATTACCGCGGCT and FAM-TGCTGGCACCAGACTTGCCCCT. Reactions were done on the TaqMan ABI 7700 instrument (Applied Biosystems) by using 10 ng of genomic RNA, primers at 500 nM, and probes at 200 nM. The conditions for the PCR reactions were 2 min at 50 °C, 10 min at 95 °C, followed by 40 cycles of denaturation (95 °C for 30 s) and annealing/extension at 60 °C for 1 min. The method to detect the levels of expression of HGF and Met mRNA was described in previous reports[18,32], which was reported as relative copies normalized against 18SrRNA expression. All samples were duplicately analyzed.
Statistical analysis
To investigate the association of HGF and Met expression and SLM and observe the concordance or difference between primary tumors and corresponding metastases, reasonable statistical methods were used. All P-values were based on two-tailed statistical analysis, and P-values of 0.05 were taken to indicate the statistical significance. Statistical analyses were performed using SPSS16.0 for Windows.
Results
HGF and Met Protein expression in primary tumors with liver metastasis versus without liver metastasis
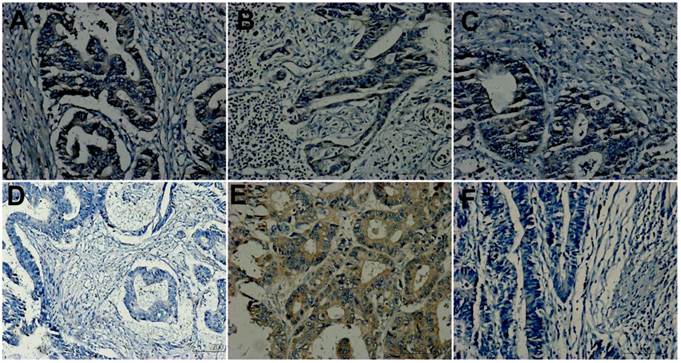
HGF expression was observed in membrane and cytoplasm of tumor cells. Statistical analyses showed that its expression had no relation with clinicopathological factors. Table 2 showed its expression in primary tumors. In the subgroup of TxN0M1 versus TxN0M0 (respectively 9 cases), 67% (6/9) versus 56%(5/9) showed positive in primary tumors with SLM compared with those without any metastases. It didn't reach significant statistics (P=0.734, line 6 of Table 2). In the other subgroup of 21 matches, HGF expression in primary tumors was different (p=0.003, line 6 of Table 2) among three matched groups. HGF expression in primary tumors with SLM showed stronger than that in those without SLM of the other two groups. In the total three matched groups, it exhibited positive in 70 %(21/30) of primary tumors of SLM group, 42.9%(9/21)of primary tumors with RLNM, and only 30%(9/30) of primary tumors without any metastases, which reached a significant statistical difference (P=0.007, line 6 of Table 2). Figure 1A, 1D and 1F were primary tumors from a matched pair of three patients, which respectively showed positive, negative and negative in expression of HGF.
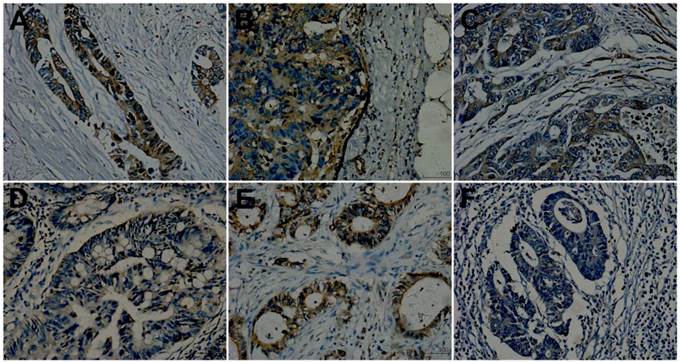
Met immunoreactivity was observed in the cytoplasm and plasma membrane of tumor cells. It had correlation with lymph node stage (r=0.381, P=0.000). The intensity of Met expression in primary tumors with N2 stage showed stronger than those with N1 and N0 stage. Its expression in primary tumors showed in Table 2. In the subgroup of TxN0M1 versus TxN0M0, Met expression showed positive in 89%(8/9) of primary tumors with SLM and 67%(6/9) of primary tumors without metastases. It didn't reached significant (p=0.436, table 2). In the other subgroup of 21 matches, Met expression (positive and negative) in primary tumors showed different (P=0.001, Table 2). The intensity of Met expression in primary tumors of TxN1-2M1 and TxN1-2M0 showed stronger than that in primary tumors without any metastases. There were no significant difference between primary tumors of TxN1-2M1 and TxN1-2M0. In the total three groups, it (identified to be positive and negative) showed positive in 90%(27/30)of primary tumors in SLM group, 86%(18/21) of primary tumors in LN group and 50%(15/30) of primary tumors in PT group. The results reached significance (p=0.004, line11 of Table 2). A, D and F of Figure 2 respectively showed strong, moderate and weak in a matched pairs of three patients.
Hepatocyte growth factor (HGF) and Met expression in primary tumors of CRCs.
| cases | One Subgroup TxN0M1 versus TxN0M0 (9 matches) | The other subgroup TxN1-2M1 versus TxN1-2M0 versus TxN0M0 (21 matches) | Total matched groups TxN0-2M1versus TxN1-2M0versus TxN0M0(x≥1) | ||||||
|---|---|---|---|---|---|---|---|---|---|
| total | SLM | PT | SLM | LN | PT | SLM | LN | PT | |
| cases | 81 | 9 | 9 | 21 | 21 | 21 | 30 | 21 | 30 |
| HGF expression in primary tumors | |||||||||
| Negative | 42 | 3 | 4 | 6 | 12 | 17 | 9 | 12 | 21 |
| (52%) | 33% | 44% | 29% | 57% | 81% | 30% | 57% | 70% | |
| Positive | 39 | 6 | 5 | 15 | 9 | 4 | 21 | 9 | 9 |
| (48%) | 67% | 56% | 71% | 43% | 19% | 70% | 43% | 30% | |
| P value | Mann-Whitney | Kruscal Wallis test | Kruscal Wallis test | ||||||
| Z=-0.470 | Chi-square=11.574 | Chi-square=9.808 | |||||||
| P=0.734 | P=0.003 | P=0.007 | |||||||
| Met expression in primary tumors of different groups | |||||||||
| Weak (Negative) | 21 | 1 | 3 | 2 | 3 | 12 | 3 | 3 | 15 |
| 26% | 11% | 33% | 10% | 14% | 57% | 10% | 14% | 50% | |
| Moderate (Positive) | 47 | 6 | 5 | 15 | 13 | 8 | 21 | 13 | 13 |
| 58% | 67% | 56% | 71% | 62% | 38% | 70% | 62% | 43% | |
| Strong (Positive) | 13 | 2 | 1 | 4 | 5 | 1 | 6 | 5 | 2 |
| 16% | 22% | 11% | 19% | 24% | 5% | 20% | 24% | 7% | |
| P value | Mann-Whitney | Kruscal Wallis test | Kruscal Wallis test | ||||||
| Z=-1.102 | Chi-square=14.430 | Chi-square=15.54 | |||||||
| P=0.436 | P=0.001 | P=0.004 | |||||||
SLM: primary colorectal cancer with synchronous liver metastasis; LN: primary colorectal cancer with regional metastasis; PT: primary colorectal cancer without any metastasis.
Hepatocyte growth factor (HGF) expression. A, D and F were primary tumors from a matched group. A showing positive; D and F exhibiting negative. A, B and C from the same patient of T3N2M1 were respectively primary tumor, lymph node metastasis and liver metastasis and showed concordance. D and E from the same patient of T3N2M0 were respectively primary tumor and lymph node metastasis and showed discordance, D showing negative and E showing positive. (Original magnification 200×).
Met expression. A, D and F were primary tumors from a matched group. A: showing mediate positive (2+); D and F exhibiting weak staining (1+). A, B and C from the same patient of T3N2M1 were respectively primary tumor, lymph node metastasis and liver metastasis and showed concordance (all positive, A and C showing 2+ while B showing 3+). D and E from the same patient of T3N2M0 were respectively primary tumor and lymph node metastasis and showed discordance, D showing weak expression(1+, negative) and E showing strong staining (3+, positive). (Original magnification 200×).
Expression of HGF and Met between primary tumors and matched metastasis
Table 3 and Table 4 showed HGF and Met expression in primary tumors and matched metastasis, which showed major concordance. In 42 pairs of primary tumors and matched lymph node metastases, 35 patients (83%) for HGF and 37 cases (88%) for Met showed concordance. In 30 pairs of primary tumors and liver metastases, 25 cases (83%) for HGF and 24 cases (80%) for Met showed concordance. In 21 cases with primary tumors, corresponding lymph node metastases and liver metastases, 17 cases (81%) showed concordance for HGF and 16 cases (76%) for Met (Table 3). A, B and C of Fig 1 and Figure 2 came from the same patient of T3N2M1, which respectively primary tumor, lymph node metastasis and liver metastasis and showed concordance.
Minor difference also existed. For HGF, 4 cases (19%) showed discordant (Friedman Test, P=0.039) in 21 pairs of primary tumors, matched lymph node metastases and liver metastases (21 cases with TxN1-2 M1). Post hoc Test showed that lymph node metastasis was different from liver metastasis (Friedman, P=0.046, not illustrating in tables). Five cases showed discordance in 30 pairs of primary tumors and liver metastases. Statistics showed no significant (McNeMar Test, P=1.000). In 42 pairs of primary tumors and matched lymph node metastases, 7 cases showed discordance (McNemar test, P=0.016, Table 3). The cases with difference were shown in table 3 and table 4.
For Met expression, 5 cases showed disconcordant (Friedman Test,P=1.000) among three pairs of tumor tissues (21 cases). 2 cases exhibited positive in liver metastases but negative in primary tumors and regional metastases, the other 3 cases also showed discordance (Table 3). In 30 pairs of primary tumors and matched liver metastases, 6 cases showed disconcordant (McNeMar Test, P=0.687, Table 3). 4 cases (19%, Table 4) in the subgroup of TxNxM1(x≥1,21 cases) and 2 cases (22%)in the other subgroup of TxN0M1 showed different between primary tumors and matched liver metastases. In 42 pairs of primary tumors and lymph node metastases, five cases showed discordance (McNemar test, P=0.375, Table 3), of whom four cases showed increasing and one case decreased in lymph node metastasis. Two cases showed discordance in the group of TxNxM1 and three cases in the group of TxNxM0 (Table 4). Figure 1D, 1E for HGF and Figure 2D, 2E for Met from a same patient of T3N2M0 were respectively primary tumor and lymph node metastasis and showed discordance.
RT-PCR of HGF and Met mRNA expression in primary tumors and liver metastases
There was significant correlation between the levels of protein and RNA for HGF (r=0.600, P=0.003) and Met r(r=0.724, P=0.001) expression in primary tumors (81 tissues) and liver metastases(HGF: r=0.523 P=0.032; Met: r=0.439, p=0.037). Their expression in primary tumors with SLM and those without SLM were listed in table 5 and table 6.
In the subgroup of TxN0M1 and TxN0M0(9 matches expression of HGF and Met mRNA in primary tumors had no significance between TxN0M1and TxN0M0 (independent t test, HGF: p= 0.855, Met: p=0.646). In the other subgroup of TxN1-2M1, TxN1-2M0 and TxN0M0 (21 matches reached significance (One way ANOVA, HGF: p= 0.038, Met: p=0.0082) . In the total three matched groups, they also reached significance (One way ANOVA, HGF: p= 0.035, Met: p=0.0079).
When comparing HGF and Met mRNA expression between primary tumors and matched liver metastasis, they had no significant significance. Both the two subgroups also had no significance. However, there were significant differences for some pairs when viewing of HGF and Met expression in each pair. In one subgroup of TxN0M1 and TxN0M0(9 pairs), there were respective four cases for HGF and six cases for Met to have similar relative copies, and five and three cases to show significant differences for HGF and Met mRNA. For HGF, four cases had higher copies of HGF mRNA in liver metastases than that in matched primary tumors and one had lower copies in liver metastasis than that in matched primary tumor(≥or<20 relative copies). For Met mRNA, two cases showed higher relative copies in liver metastases than that in matched primary tumors and one case showed lower relative copies in liver metastasis than that in matched primary tumor(≥or<300 relative copies). In the other subgroup, their expression in lymph node metastases was not detected because the paucity of extraction RNA. In the 21 patients of paired primary tumors and liver metastases, 18 cases for HGF and 17 cases for Met had similar relative copies while 3 cases and 4 cases showed different. Totally, 22 cases had similar relative copies of HGF mRNA and 23 cases had similar relative copies of Met mRNA. The concordance rates between primary tumors and matched liver metastases were 73.3% for HGF and 76.7% for Met.
Expression of HGF and Met between primary tumors and corresponding Metastases (21 pairs with Primary, LN and liver; 30 pairs of primary tumor and liver, 42 pairs of PT and LN).
| T | RN | L | cases | T | L | cases | T | RN | cases | ||
|---|---|---|---|---|---|---|---|---|---|---|---|
| HGF expression between primary tumors and corresponding metastases | |||||||||||
| N | N | N | 3 | N | N | 7 | N | N | 11 | ||
| N | P | N | 3 | N | P | 2 | N | P | 7 | ||
| P | P | N | 1 | P | N | 3 | P | N | 0 | ||
| P | P | P | 14 | P | P | 18 | P | P | 24 | ||
| Concordance: 17cases | 17/21 | 25 cases | 25/30 | 35 cases | 35/42 | ||||||
| Rate: (both N and P) | 81% | 83% | 83% | ||||||||
| Discordance: 4 cases | 4/21 | 5 cases | 5/30 | 7cases | 7/42 | ||||||
| Rate (discordance) | 19% | 17% | 17% | ||||||||
| Friedman Test | total | McNemar | total | McNemar | total | ||||||
| P=0.039 | 21 cases | P=1.000 | 30cases | P=0.016 | 42 cases | ||||||
| Met expression (N and P) between primary tumors and matched metastases | |||||||||||
| N | N | N | 0 | N | N | 1 | N | N | 1 | ||
| P | P | P | 16 | N | P | 2 | N | P | 4 | ||
| P | P | N | 2 | P | N | 4 | P | N | 1 | ||
| N | P | P | 1 | P | P | 23 | P | P | 36 | ||
| N | N | P | 1 | ||||||||
| P | N | P | 1 | ||||||||
| Concordance: 16 cases | 16/21 | 24 cases | 24/30 | 37 cases | 37/42 | ||||||
| Rate: (both N and P) | 76% | 80% | 88% | ||||||||
| Discordance: 5 cases | 5/21 | 6 cases | 6/30 | 5 cases | 5/42 | ||||||
| Rate (discordance) | 24% | 20% | 12% | ||||||||
| Friedman Test | 21 cases | McNemar | 30cases | McNemar | 42 cases | ||||||
| P=1.000 | P=1.000 | P=0.375 | |||||||||
T: Primary tumor; RN: Regional lymph node metastasis; L: Synchronous liver metastasis; N: negative, P: positive.
Expression of HGF and Met between primary tumors and corresponding Metastases in SLM group and LN group.
| TxNxM1(21 cases) | TxN0M1(9 cases) | TxNxM0 (21cases) | TxNxM1(21cases) | ||||||||||||||||
|---|---|---|---|---|---|---|---|---|---|---|---|---|---|---|---|---|---|---|---|
| T | L | cases | T | L | cases | T | RN | cases | T | RN | cases | ||||||||
| HGF expression between primary tumors and corresponding metastases of subgroups | |||||||||||||||||||
| N | N | 6 | N | N | 1 | N | N | 8 | N | N | 3 | ||||||||
| N | P | 0 | P | N | 2 | N | P | 4 | N | P | 3 | ||||||||
| P | N | 1 | N | P | 2 | P | N | 0 | P | N | 0 | ||||||||
| P | P | 14 | P | P | 4 | P | P | 9 | P | P | 15 | ||||||||
| Concordance | 95% | 56% | 81% | 86% | |||||||||||||||
| discordance | 5% | 44% | 19% | 14% | |||||||||||||||
| McNeMar | 21 | McNeMar | 9 | McNeMar | 21 | McNeMar | 21 | ||||||||||||
| P=1.000 | cases | P=1.000 | cases | P=0.125 | cases | P=0.250 | cases | ||||||||||||
| MET expression between primary tumors and corresponding metastases of subgroups | |||||||||||||||||||
| N | N | 0 | N | N | 1 | N | N | 0 | N | N | 1 | ||||||||
| N | P | 2 | N | P | 0 | N | P | 3 | N | P | 1 | ||||||||
| P | N | 2 | P | N | 2 | P | N | 0 | P | N | 1 | ||||||||
| P | P | 17 | P | P | 6 | P | P | 18 | P | P | 18 | ||||||||
| Concordance | 81% | 78% | 86% | 89% | |||||||||||||||
| discordance | 19% | 22% | 14% | 11% | |||||||||||||||
| McNeMar | 21 | McNeMar | 9 | McNeMar | 21 | McNeMar | 21 | ||||||||||||
| P=1.000 | cases | P=0.500 | cases | P=0.250 | cases | P=1.000 | cases | ||||||||||||
T: Primary tumor; RN: Regional lymph node metastasis; L: Synchronous liver metastasis; N: negative, P: positive.
HGF expression at the RNA level.
| HGF | Mean copy numbers | 95% CI | Statistical method and P value | |
|---|---|---|---|---|
| HGF expression at the RNA level in one subgroup of TxN0M1 and TxN0M0 | ||||
| TxN0M1 | 9 | 138 relative copies | 78-216 | independent t test p= 0.589 |
| TxN0M0 | 9 | 125 relative copies | 67-209 | |
| HGF expression at the RNA level in the other subgroup of TxN1-2M1, TxN1-2M0 and TxN0M0 | ||||
| TxN1-2M1 | 21 | 245 relative copies | 134-337 | One way ANOVA p=0.007 TxN1-2M1vs TxN1-2M0 p=0.036 TxN1-2M1vs TxN0M0 p=0.008 TxN1-2M0vsTxN0M0 p=0.574 |
| TxN1-2M0 | 21 | 163 relative copies | 90-266 | |
| TxN0M0 | 21 | 158 relative copies | 89-210 | |
| HGF expression at the RNA level in the total three matched group | ||||
| TxN0-2M1 | 30 | 232 | 78-337 | One way ANOVA p=0.014 TxN1-2M1vs TxN1-2M0 p=0.048 TxN1-2M1vs TxN0M0 p=0.009 TxN1-2M0vsTxN0M0 p=0.452 |
| TxN1-2M1 | 21 | 163 | 90-266 | |
| TxN0M0 | 30 | 138 | 67-210 | |
| HGF expression at the RNA level in primary tumors and matched liver metastasis(TxN0M1) | ||||
| Primary | 9 | 138 relative copies | 78-216 | paired t test p=0.758 3 cases showed similar at the RNA level in five cases with concordance at the protein level and one case showed similar in the four cases with disconcordance |
| Liver | 9 | 146 relative copies | 96-232 | |
| HGF expression at the RNA level in primary tumors and matched liver metastasis(TxN1-2M1) | ||||
| Primary | 21 | 245 relative copies | 134-337 | paired t test p=0.617 17 cases showed similar at the RNA in 20 cases with concordance at the protein level and 1 case showed similar at the RNA level but different at the protein level |
| Liver | 21 | 269 relative copies | 122-385 | |
| HGF expression at the RNA level in primary tumors and matched liver metastasis(TxN0-2M1) | ||||
| Primary | 30 | 232 | 78-337 | paired t test p=0.605 22 cases showed similar Concordance rate:73.3% |
| Liver | 30 | 257 | 96-385 | |
CI: confidence interval.
Met expression at the RNA level.
| MET | Mean copy numbers | 95% CI | Statistical method and P value | ||
|---|---|---|---|---|---|
| MET expression at the RNA level in one subgroup of TxN0M1 and TxN0M0 | |||||
| TxN0M1 | 9 | 1400 relative copies | 990-2012 | independent t test | |
| TxN0M0 | 9 | 1298 relative copies | 787-1910 | p= 0.605 | |
| MET expression at the RNA level in the other subgroup of TxN1-2M1, TxN1-2M0 and TxN0M0 | |||||
| TxN1-2M1 | 21 | 1685 relative copies | 1340-2276 | One way ANOVA, P=0.031 TxN1-2M1vsTxN1-2M0,P=0.863 TxN1-2M1vsTxN0M0 P=0.018 TxN1-2M0vsTxN0M0 P=0.047 | |
| TxN1-2M0 | 21 | 1534 relative copies | 1100-2060 | ||
| TxN0M0 | 21 | 1310 relative copies | 830-1914 | ||
| MET expression at the RNA level in the total matched group | |||||
| TxN0-2M1 | 30 | 1602 | 990-2276 | One way ANOVA, P=0.047 TxN1-2M1vsTxN1-2M0,P=0.932 TxN1-2M1vsTxN0M0 P=0.038 TxN1-2M0vsTxN0M0 P=0.046 | |
| TxN1-2M0 | 21 | 1534 relative copies | 1100-2060 | ||
| TxN0M0 | 30 | 1301 | 787-1914 | ||
| MET expression at the RNA level in primary tumors and matched liver metastasis(TxN0M1) | |||||
| Primary | 9 | 1400 relative copies | 990-2012 | paired t test p=0.853 6 cases had similar relate copies. 5 cases in seven cases with concordance and 1 cases in 2 cases with disconcordance at the protein level | |
| Liver | 9 | 1498 relative copies | 869-2056 | ||
| MET expression at the RNA level in primary tumors and matched liver metastasis(TxN1-2M1) | |||||
| Primary | 21 | 1685 relative copies | 1340-2276 | paired t test p=0.853 17 cases showed similar at the RNA level. 14 cases in 17 cases with concordance and 3 cases in 4 cases with disconcordance at the protein level | |
| Liver | 21 | 1829 relative copies | 1227-2592 | ||
| MET expression at the RNA level in primary tumors and matched liver metastasis(TxN0-2M1) | |||||
| primary | 30 | 1602 relative copies | paired t test p=0.709 22 cases showed similar at the RNA level Concordance rate:76.7% | ||
| Liver | 30 | 1735 relative copies | |||
CI: confidence interval.
Discussion
In the report, there was no significance for HGF and Met expression at the protein and RNA levels between primary tumors with TxN0Mliver and those with TxN0M0 but significant difference among primary tumors with TxN1-2Mliver, those with TxN1-2M0 and those with TxN0M0. When considering HGF and Met expression between primary tumors and matched metastases, both major concordance and minor difference existed. The results represented important implications for understanding the biology of metastasis in CRC and provided evidence for further using the inhibitors of HGF and Met.
SLM is an important problem for CRC at initial diagnose. Based on a comparative study of protein expression in primary colorectal tumors and SLM, Kim[33] found that matrix metalloproteinase-1 expression in primary tumor was a predictor of SLM. The system of HGF and Met has been also identified to play a critical role in liver metastasis from CRCs in previous studies[2,6,9,11-13,16,18]. However, few of them compared HGF and Met expression in primary colorectal cancer with SLM and primary colorectal cancer without liver metastasis. Our results showed that expression of both HGF and Met in primary tumors was related to SLM when SLM is concurrent with RLNM, indicating that they contributed to the development of liver metastasis and testified previous studies. However, they had minor differences on SLM. In the subgroup of TxN1-2M1, TxN1-2M0 and TxN0M0, HGF expression in primary tumors with SLM was higher than those without SLM both at the protein level and RNA level. Although there were no significant difference between primary tumors with SLM and primary tumors with RLNM at the protein level(p=0.065), its RNA level reached significance(p=0.036, table 5)when comparing the two groups. This may suggest that HGF expression in primary tumors may only contribute to SLM. Met expression in primary tumors with SLM and primary tumors with RLNM was higher than those without any metastases. But there was no significance between Met expression in primary tumors with SLM and that in primary tumors with RLNM. Moreover, Met expression had correlation with lymph node stage. The results indicated that Met overexpression in primary tumors was not only related with not only RLNM but also SLM, which was consistent with Takeuchi et al[16] report. In the subgroup of TxN0M1 versus TxN0M0, their expression in primary tumors had no correlation with liver metastasis. The possible reason might be due to small size (9 pairs) or that the system had no effect on development of SLM when lymph node metastasis was absent. Therefore, it seemed that HGF and Met expression in primary tumors played the role in SLM when concurrent with RLNM and HGF had the sole role for SLM and Met was associated with not only SLM but also RLNM.
The regional lymph node and liver are common sites of metastasis in newly diagnosed patients with CRCs, which have been found to have different mechanism based on paired tissues of primary tumors and matched multiple sites of metastases[34,35]. For patients with SLM from CRCs, some are concurrent with RLNM and others directly develop to SLM without involving RLNM. Few studies focused on this issue. Comparison of distant metastasis and lymph node metastasis from the same patient may provide a tool to identify the difference[23,34]. In the report, HGF expression at the protein level showed difference between primary tumors and regional lymph node metastases (42 paired, p=0.016). Among the 21 paired tissues of primary tumors, matched lymph node metastases and liver metastasis, HGF expression also showed discordance (P=0.039, Table 3). Further analysis showed that its expression was discordant between regional lymph node metastases and liver metastases (P=0.046, not illustrated in Tables) while concordant between primary tumors and liver metastases or between primary tumors and lymph node metastases (Table 4). For Met expression, it showed concordance between primary tumors and lymph node metastases (42 pairs), between primary tumors and liver metastases (30 pairs) and even among primary tumors, regional lymph node metastasis and liver metastasis (21 pairs). HGF expression at the protein level between primary CRCs and SLM (21 pairs, 95%) showed higher concordance than that between primary CRCs and RLNM (21 pairs, 86% ) in the same group while Met expression at the protein level between CRCs and SLM(21 pairs, 81%) showed lower concordance than that between primary CRCs and RLNM(21 pairs, 89%). These results further testified the results based on comparison of their expression in primary tumors with SLM and those without SLM. HGF and Met might play different roles in development of SLM and RLNM. However, the concordance of HGF and Met expression between primary CRCs and SLM with RLNM(21 pairs, 95% and 81% at the protein level, 73.3% and 76.7 % at the RNA level) was higher than that between primary CRCs and SLM without RLNM(9 pairs, 56% and 78%, 44.4% and 66.7% at the RNA level). HGF and Met expression at the protein level between primary CRCs and RLNM with SLM(TxNxM1,21 pairs, 86% and 89%) also showed higher concordance than that between primary CRCs and RLNM without SLM( TxNxMo, 21 pairs, 81% and 86%, table 4). Although the sample size in SLM patients without RLNM was small (9 pairs), these comparisons suggested that they might have more influence on SLM when concurrent with RLNM than SLM without RLNM.
These results testified previous studies and provided evidence for further using the inhibitors of HGF and Met in SLM. However, previous reports showed that Met expression in liver metastasis increased or decreased[2-4,12,15], when comparing with its expression in primary CRC and few of them compared HGF expression in primary tumors and matched liver metastasis. Moreover, even in these studies with comparison of their expression in primary tumors and matched liver metastases, they didn't distinguish SLM from other metastases[15]. Thus, it will be puzzled when their inhibitors are used in treatment of SLM. Met was suggested to be an early event in CRCs[2]. According to the same gene model, its expression in primary tumors and corresponding metastasis should be concordance[36]. In the report, we showed that there were major similarities on HGF (concordance rate:83% at the protein level and 73.3% at the RNA level) and Met expression(concordance rate:80% at the protein level and 76.7% at the RNA level) between primary tumors and matched SLM, yet there were also minor differences. Concordance suggests that primary tumors and corresponding metastases had the same clone[35]. Thus, metastatic cells can express most of the genes existing in their progenitors including Met. The difference may be due to their expression being influenced by local microenvironments of liver and lymph node. In our study, HGF concordance at the RNA level was lower than that at the protein level, which may be due to its RNA expression based on tumor cells and stromal cells and protein expression only based on cancer cells. The methods might also contribute to the difference. For example, Fujita[3] showed Met expression in liver metastases was higher than that in primary CRCs using RT-PCR but Isaksson-Mettavainio[15] showed Met expression decreasing in metastases using the method of IHC. However, no matter how difference is produced, both of concordance and difference actually exist between primary CRCs and corresponding metastases when taking together with previous studies. Therefore, our study provides an evidence for the inhibitors of HGF and Met to be used in CRC with SLM.
This study also had some limitations. The sample size was small, which was due to the scarcity of surgical tissues and strict selection for matched patients. Previous studies showed that HGF was expressed by stromal cells. In our study, its expression was shown in cancer cells, which was consistent with Trovato et al[37] report who used the same antibody to detect HGF expression. He also explained why HGF expression was expressed on cancer cells not stromal cells. In fact, HGF expression in cancer cells has been also reported on other cancer tissues[38,39]. We couldn't further explore the potential reasons because this was a clinical report.
Conclusion
HGF and Met might play the role in development of SLM when concurrent with RLNM from CRC but have little influence on SLM without involvement of RLNM. Major concordance and minor difference exist between primary tumors and matched metastases, which provide evidence for further using inhibitors of HGF and Met in CRCs with SLM.
Abbreviations
SLM: Synchronous liver metastasis; CRCs: primary colorectal carcinomas; RLNM: regional lymph node metastases; HGF: Hepatocyte growth factor; UICC: Union for International Cancer Control; FFPE: paraffin-embedded tissue; IHC: Immunohistochemistry; RT-PCR: real-time reverse transcription-polymerase chain reaction; PBS: phosphate buffer saline.
Acknowledgements
This work was supported by Provincial science and technology foundation of Shandong [NO:2011GGH21819] and Medical and health science and technology development plan of Shandong[NO:2009QW014].
Competing Interests
There is no conflict of interests for all authors.
References
1. Manfredi S, Lepage C, Hatem C. et al. Epidemiology and management of liver metastases from colorectal cancer. Ann Surg. 2006;244:254-9
2. Di Renzo MF, Olivero M, Giacomini A. et al. Overexpression and amplification of the met/HGF receptor gene during the progression of colorectal cancer. Clin Cancer Res. 1995;1:147-54
3. Fujita S, Sugano K. Expression of c-met proto-oncogene in primary colorectal cancer and liver metastases. Jpn J Clin Oncol. 1997;27:378-83
4. Zeng Z, Weiser MR, Kuntz E. et al. c-Met gene amplification is associated with advanced stage colorectal cancer and liver metastases. Cancer Lett. 2008;265:258-69
5. Lesko E, Majka M. The biological role of HGF-MET axis in tumor growth and development of metastasis. Front Biosci. 2008;13:1271-80
6. Osada S, Matsui S, Komori S. et al. Effect of hepatocyte growth factor on progression of liver metastasis in colorectal cancer. Hepatogastroenterology. 2010;57:76-80
7. Wen J, Matsumoto K, Taniura N. et al. Hepatic gene expression of NK4, an HGF-antagonist/angiogenesis inhibitor, suppresses liver metastasis and invasive growth of colon cancer in mice. Cancer Gene Ther. 2004;11:419-30
8. Saigusa S, Toiyama Y, Tanaka K. et al. Inhibition of HGF/cMET expression prevents distant recurrence of rectal cancer after preoperative chemoradiotherapy. Int J Oncol. 2012;40:583-91
9. Otte JM, Schmitz F, Kiehne K. et al. Functional expression of HGF and its receptor in human colorectal cancer. Digestion. 2000;61:237-46
10. Kataoka H, Hamasuna R, Itoh H. et al. Activation of hepatocyte growth factor/scatter factor in colorectal carcinoma. Cancer Res. 2000;60:6148-59
11. Hiscox SE, Hallett MB, Puntis MC. et al. Expression of the HGF/SF receptor, c-met, and its ligand in human colorectal cancers. Cancer Invest. 1997;15:513-21
12. Matsui S, Osada S, Tomita H. et al. Clinical significance of aggressive hepatectomy for colorectal liver metastasis, evaluated from the HGF/c-Met pathway. Int J Oncol. 2010;37:289-97
13. De Oliveira AT, Matos D, Logullo AF. et al. MET Is highly expressed in advanced stages of colorectal cancer and indicates worse prognosis and mortality. Anticancer Res. 2009;29:4807-11
14. Toiyama Y, Miki C, Inoue Y. et al. Serum hepatocyte growth factor as a prognostic marker for stage II or III colorectal cancer patients. Int J Cancer. 2009;125:1657-62
15. Isaksson-Mettavainio M, Van Guelpen B, Oberg A. et al. c-Met expression in primary tumors and their corresponding distant metastases. Mol Med Report. 2008;1:787-90
16. Takeuchi H, Bilchik A, Saha S. et al. c-MET expression level in primary colon cancer: a predictor of tumor invasion and lymph node metastases. Clin Cancer Res. 2003;9:1480-8
17. Liu Y, Li Q, Zhu L. Expression of the hepatocyte growth factor and c-Met in colon cancer: correlation with clinicopathological features and overall survival. Tumori. 2012;98:105-12
18. Kammula US, Kuntz EJ, Francone TD. et al. Molecular co-expression of the c-Met oncogene and hepatocyte growth factor in primary colon cancer predicts tumor stage and clinical outcome. Cancer Lett. 2007;248:219-28
19. Yap TA, Sandhu SK, Alam SM. et al. HGF/c-MET Targeted Therapeutics: Novel Strategies for Cancer Medicine. Curr Drug Targets. 2011;12:2045-58
20. Steffan JJ, Coleman DT, Cardelli JA. et al. The HGF-met signaling axis: emerging themes and targets of inhibition. Curr Protein Pept Sci. 2011;12:12-22
21. Lemos C, Sack U, Schmid F. et al. Anti-metastatic Treatment in Colorectal Cancer: Targeting Signaling Pathways. Curr Pharm Des. 2012 [Epub ahead of print]
22. Pantaleo MA, Astolfi A, Nannini M. et al. Gene expression profiling of liver metastases from colorectal cancer as potential basis for treatment choice. Br J Cancer. 2008;99:1729-34
23. Al-Mulla F, Keith WN, Pickford IR. et al. Comparative genomic hybridization analysis of primary colorectal carcinomas and their synchronous metastases. Genes Chromosomes Cancer. 1999;24:306-14
24. Tan EK, Ooi LL. Colorectal cancer liver metastases-understanding the differences in the management of synchronous and metachronous disease. Ann Acad Med Singapore. 2010;39:715-19
25. Mantke R, Schmidt U, Wolff S. et al. Incidence of synchronous liver metastases in patients with colorectal cancer in relationship to clinico-pathologic characteristics. Results of a German prospective multicentre observational study. Eur J Surg Oncol. 2012;38:259-65
26. Albanese I, Scibetta AG, Migliavacca M. et al. Heterogeneity within and between primary colorectal carcinomas and matched metastases as revealed by analysis of Ki-ras and p53 mutations. Biochem Biophys Res Commun. 2004;325:784-91
27. Kuramochi H, Hayashi K, Uchida K. et al. 5-fluorouracil-related gene expression levels in primary colorectal cancer and corresponding liver metastasis. Int J Cancer. 2006;119:522-6
28. Italiano A, Saint-Paul MC, Caroli-Bosc FX. et al. Epidermal growth factor receptor (EGFR) status in primary colorectal tumors correlates with EGFR expression in related metastatic sites: biological and clinical implications. Ann Oncol. 2005;16:1503-7
29. Floriani I, Santini D, Torri V. et al. Do we need biopsies of metastases for colorectal cancer patients?. Br J Cancer. 2009;101:374-6
30. Wang G, Dong W, Shen H. et al. A comparison of Twist and E-cadherin protein expression in primary non-small-cell lung carcinoma and corresponding metastases. Eur J Cardiothorac Surg. 2011;39:1028-32
31. Masuya D, Huang C, Liu D. et al. The tumour-stromal interaction between intratumoral c-Met and stromal hepatocyte growth factor associated with tumour growth and prognosis in non-small-cell lung cancer patients. Br J Cancer. 2004;90:1555-62
32. Herrera LJ, El-Hefnawy T, Queiroz DOP. et al. The HGF receptor c-Met is overexpressed in esophageal adenocarcinoma. Neoplasia. 2005;7:75-84
33. Kim YW, Ko YT, Kim NK. et al. A comparative study of protein expression in primary colorectal cancer and synchronous hepatic metastases: the significance of matrix metalloproteinase-1 expression as a predictor of liver metastasis. Scand J Gastroenterol. 2010;45:217-25
34. Knosel T, Schluns K, Stein U. et al. Chromosomal alterations during lymphatic and liver metastasis formation of colorectal cancer. Neoplasia. 2004;6:23-8
35. Knosel T, Schluns K, Dietel M. et al. Chromosomal alterations in lung metastases of colorectal carcinomas: associations with tissue specific tumor dissemination. Clin Exp Metastasis. 2005;22:533-8
36. Khalique L, Ayhan A, Whittaker JC. et al. The clonal evolution of metastases from primary serous epithelial ovarian cancers. Int J Cancer. 2009;124:1579-86
37. Trovato M, Vitarelli E Grosso M. et al. Immunohistochemical expression of HGF, c-MET and transcription factor STAT3 in colorectal tumors. Eur J Histochem. 2004;48:291-7
38. Chen YS, Wang JT, Chang YF. et al. Expression of hepatocyte growth factor and c-met protein is significantly associated with the progression of oral squamous cell carcinoma in Taiwan. J Oral Pathol Med. 2004;33:209-17
39. Gumustekin M, Kargi A, Bulut G. et al. HGF/c-Met overexpressions, but not met mutation, correlates with progression of non-small cell lung cancer. Pathol Oncol Res. 2012;18:209-18
Author contact
![]() Corresponding author: Jiajun Du or Qi Liu, Institute of Oncology, Provincial Hospital Affiliated to Shandong University, Shandong University, 324 Jingwu Road, Jinan 250021, China. Tel: 86-531- 85187100 Fax: 86-531-85187100 Email: dujiajunedu.cn or liuqi66edu.cn.
Corresponding author: Jiajun Du or Qi Liu, Institute of Oncology, Provincial Hospital Affiliated to Shandong University, Shandong University, 324 Jingwu Road, Jinan 250021, China. Tel: 86-531- 85187100 Fax: 86-531-85187100 Email: dujiajunedu.cn or liuqi66edu.cn.
Received 2012-9-9
Accepted 2013-3-12
Published 2013-3-15