ISSN: 1449-1907International Journal of Medical Sciences

Int J Med Sci 2012; 9(7):545-554. doi:10.7150/ijms.4648 This issue Cite
Research Paper
Role of Mitochondrial Translocation of Telomerase in Hepatocellular Carcinoma Cells with Multidrug Resistance
Xianlong Ling# ![]() , Lei Wen#
, Lei Wen# ![]() , Yuan Zhou
, Yuan Zhou
Department of Gastroenterology, Xinqiao Hospital, Third Military Medical University, Chongqing 400037, China
# Xianlong Ling and Lei Wen contribute equally to this study.
Abstract
Multidrug resistance (MDR) is a major obstacle of cancer chemotherapy. This study aimed to investigate the role of mitochondrial translocation of telomerase (hTERT) in MDR of human hepatocellular carcinoma (HCC) cells. In this study, three HCC cell lines (SK-Hep1/CDDP1 cells, SK-Hep1/CDDP2 cells and SK-Hep1/CDDP3 cells) with differential resistance index (RI) to cisplatin (CDDP) were induced by pulse treatment of SK-Hep1 (human hepatocellular cell line) with CDDP in vitro. The RI of SK-Hep1/CDDP1 cells, SK-Hep1/CDDP2 cells and SK-Hep1/CDDP3 cells was 5.14, 8.66, and 14.25, respectively, and all the cell lines showed cross-resistance to Doxorubicin (DOX) and 5-Fuorouracil (5-FU). The apoptosis rates in drug-resistant cells were significantly reduced. Cell cycle analysis revealed the ratio of drug-resistant cells in G2/M and S phases increased, while that in G1 phase decreased. Immunofluorescence staining and Western blot assay demonstrated, with the gradual elevation in RI, increasing hTERT translocated from the nuclei to the mitochondria, while real-time PCR indicated the shortening of telomere length in drug-resistant cells under the chemotherapeutic stress and the reduction of damaged mtDNA with the increase in RI. Furthermore, JC-1 staining also indicated the reduction of mitochondrial membrane potential in drug-resistant cells. The mitochondrial translocation of hTERT increases in multidrug-resistant cells and exerts protective effect on mitochondrial function. Drug-resistant tumor cells escape from apoptosis through hTERT-mediated mitochondrial protection. Mitochondrial translocation of hTERT may serve as an underlying mechanism of MDR.
Keywords: Telomerase, Telomere, Mitochondria, Multidrug resistance
Introduction
Multidrug resistance (MDR) becomes a major cause of chemotherapy failure in cancers [1]. The mechanisms underlying the MDR of cancer cells are complex [2, 3], including increase of drug efflux, reduction of drug absorption, changes in the targets of anticancer drugs, decrease of drug activity, enhancement of DNA repair following damage, changes in anti-apoptosis pathways, etc.
hTERT is a ribonucleoprotein and its activity is relatively high in the germ cells, embryonic stem cells and cancer cells. hTERT mainly functions to maintain the length of telomeres [4]. Over-expression of hTERT is implicated in the initiation and progression of cancers. Furthermore, hTERT is also involved in the occurrence of MDR of cancer cells by antagonizing apoptosis. hTERT over-expression may convey the signal of resistance to chemotherapeutic drugs [5]. High hTERT activity and telomere elongation help to maintain or increase the drug resistance of cancer cells. Cancer cells with long telomere and high proliferation ability are more resistant to anti-cancer drugs and have better viability [6].
In addition to maintaining the length of telomere, hTERT has other physiological functions, such as promotion of DNA repair, antagonism of cell apoptosis, and alteration of chromatin structure and gene expressions. Studies have shown that hTERT can cause changes in the growth-promoting genes (EGFR and FGF), cell cycle regulation related genes (cyclins D1 and G2), as well as genes associated with metabolism and cell signaling. In cancer cells, knockout of hTERT gene may lead to changes in the expressions of genes related to the metastasis, differentiation and angiogenesis of cancers [7, 8].
Studies show that oxidative stress can lead to the translocation of hTERT from the nuclei to the mitochondria, where it protects the mitochondria leading to the resistance to apoptosis and performs the telomere-independent functions [9-11]. However, whether hTERT over-expression in the mitochondria of cancer cells is related to the generation of drug resistance remains elusive. In the present study, three MDR cell lines with different resistance indices (RIs) were prepared from hepatocellular carcinoma cells (HCC; SK-Hep1 cells) and the role of mitochondrial translocation of hTERT in the MDR of HCC was investigated.
Materials and methods
Materials
SK-Hep1 cells were provided by the Institute of Biochemistry and Cell Biology, Shanghai Institutes for Biological Sciences, Chinese Academy of Sciences. DMEM high glucose (Gibco BRL), fetal bovine serum (FBS, HyClone), cell counting kit-8 (CCK-8; Dojindo Laboratories), cisplatin (CDDP), doxorubicin (DOX) (Sigma) 5-fluorouracil (5-FU; Shanghai Xudong Haipu Pharmaceutical Co., Ltd), vincristine (VCR; Guangdong Lingnan Pharmaceutical Co., Ltd), flow cytometry apoptosis detection kit (Annexin VFITC/PI; Nanjing KeyGEN Biotech), DNA extraction kit (Tiangen Biotech [Beijing] Co., Ltd), real-time PCR kit (TaKaRa Bio Inc), rabbit anti-hTERT monoclonal antibody (Rockland Immunochemicals Inc), FITC-labeled secondary antibody and horseradish peroxidase-labeled secondary antibody (Zhongshan Goldenbridge Biotechnologies Co., Ltd) were used in the present study.
Culture and induction of SK-Hep1/CDDP cells
SK-Hep1 cells were maintained in DMEM high glucose containing 10% FBS, 100 U/mL penicillin and 100 μg/mL streptomycin in an atmosphere with 5% CO2 at 37 ℃. Cells were passaged by 0.25% trypsinization. The induction was done by pulse treatment with high dose CDDP as described previously [12]. Briefly, SK-Hep1 cells in logarithmic growth phase were pulse-treated with 5 μg/mL CDDP. The medium was removed 24 h later, and the cells were maintained in fresh medium after three washes with PBS. Suspended cells were removed one-two days later. Pulse treatment with 5 μg/mL CDDP was performed again for another five times. After every two treatments, a fraction of cells were collected and cryopreserved after another three passages in normal medium. Survived cells underwent through the next induction. The whole process lasted for 6 months, and 3 cell lines with different RIs to CDDP were obtained and designated as SK-Hep1/CDDP1 cells, SK-Hep1/CDDP2 cells, and SK-Hep1/CDDP3 cells, respectively, which were then maintained in complete medium containing 0.01 μg/mL CDDP. The medium was refreshed with medium without addition of CDDP at 3 weeks before the following experiments.
Cell growth curve and determination of doubling time
SK-Hep1 cells, SK-Hep1/CDDP1 cells, SK-Hep1/CDDP2 cells and SK-Hep1/CDDP3 cells in logarithmic growth phase were re-suspended, seeded into 24-well plates at a density of 5×10³cells/well followed by incubation in an environment with 5% CO2 at 37 ℃. Trypan blue staining was performed once daily since the 1st day of culture, and the viable cells in 3 wells of each group were counted for five consecutive days. The doubling time (Td) of each cell line was calculated according to the Patterson formula as follow: Td=T×lg2/(lgN2-lgN1), where N1 is cell number on the 1st day, and N2 is cell number at T h after culture; T (h) is the time from N1 to N2.
Detection of cell sensitivity to chemotherapeutic drugs by WST-8 assay
WST-8 assay was employed to determine the cytotoxic effect of chemotherapeutic drugs at different concentrations on SK-Hep1 cells, SK-Hep1/CDDP1 cells, SK-Hep1/CDDP2 cells and SK-Hep1/CDDP3 cells. Cells were seeded into 96-well plates at a density of 1×10⁵cells/mL (200 μL/well). After 24 h of culture, five 10-fold serial dilutions of CDDP, DOX, VCR, and 5-FU (the lowest concentrations were 0.05, 0.001, 0.001, and 0.025 μg/mL for CDDP, DOX, VCR and 5-FU, respectively) were added into the culture medium. Treatment was performed in quintuplicate. Cells in control group were treated with PBS of equal volume, and a blank control group was also included. Cells were maintained in an atmosphere with 5% CO2 at 37 ℃. After 24 h of culture, 20 μL of CCK-8 was added to each well followed by incubation for another 2 h. The absorbance (A) of each well was then measured on a microplate reader at 450 nm (reference wavelength: 650 nm). The relative growth-inhibitory rate was calculated as follow: relative inhibitory rate = (1-Aexperiment/Acontrol)×100%. The half maximal inhibitory concentration (IC50) was further determined, and the RI was calculated as follow: RI = IC50 of drug-resistant cells/IC50 of parental cells.
Detection of cell cycle
The cell cycle was detected by flow cytometry (FCM). Cells in logarithmic growth phase were maintained in serum-free medium to synchronize. After 24 h of culture, the medium was refreshed with medium containing 10% FBS. Cells were harvested when 90% confluence was achieved, centrifuged, re-suspended in 0.3 mL of PBS, and then transferred into a 1.5-mL Eppendorf tube. Cells were fixed in 0.7 mL of ice-cold ethanol, treated with RNase for 30 min at 37 ℃ and then stained with 100 mg/L PI(Propidium Iodide, PI) for 30 min in dark.
Detection of cell apoptosis by double staining with Annexin V and PI
Cell apoptosis was detected by double staining with FITC-Annexin V and PI and subsequent FCM. Cells were divided into 8 groups: 1) SK-Hep1 group: SK-Hep1 cells were not treated with CDDP treatment; 2) SK-Hep1+10 μg/mL CDDP group: SK-Hep1 cells were treated with 10 μg/mL CDDP for 24 h; 3) SK-Hep1/CDDP1 group: SK-Hep1/CDDP1 cells were not treated with CDDP; 4) SK-Hep1/CDDP1+10 μg/mL CDDP group: SK-Hep1/CDDP1 cells were treated with 10 μg/mL CDDP for 24 h; 5) SK-Hep1/CDDP2 group: SK-Hep1/CDDP2 cells were not treated with CDDP; 6) SK-Hep1/CDDP2+10 μg/mL CDDP group: SK-Hep1/CDDP2 cells treated with 10 μg/mL CDDP for 24 h; 7) SK-Hep1/CDDP3 group: SK-Hep1/CDDP3 cells were not treated with CDDP; 8) SK-Hep1/CDDP3+10 μg/mL CDDP group: SK-Hep1/CDDP3 cells were treated with 10 μg/mL CDDP for 24 h. The treatment was carried out as follows: cells were seeded into 6-well plates at a density of 1×10⁵cells/mL. Experiment was done in triplicates. Cells were harvested after 24 h of culture by centrifugation at 1500× g for 5 min. The supernatant was removed, and cells were re-suspended in 500 μL of PBS. AnnexinV (5 μL) and PI (5 μL) were added into cell suspension. Cells were then incubated for 15 min in dark and then analyzed by flow cytometry at 488 nm. Data from flow cytometry were analyzed using CellQuest software.
Analysis of hTERT in nuclei and mitochondria
Cells in logarithmic growth phase were seeded onto coverslips in 12-well plates at about 30% confluence and maintained in an atmosphere with 5% CO2 at 37 ℃ for 1~2 days until the cell confluence reached 50%. Cells were then washed thrice with PBS, incubated in 300-500 μL of MitoTracker Red solution in an atmosphere with 5% CO2 at 37 ℃ for 45 min, washed with PBS thrice, fixed in paraformaldehyde at room temperature for 15 min, washed in PBS thrice, permeabilized, washed thrice, blocked in goat anti-rabbit blocking buffer at room temperature for 30 min, washed in PBS thrice, incubated with rabbit anti-hTERT antibody (1:500) overnight at 4 ℃, washed with PBS thrice, incubated with FITC-labeled goat anti-rabbit secondary antibody (1:1000) at 37 ℃ for 1 h, washed in PBS thrice, incubated with DAPI at room temperature for 5 min and washed in PBS thrice. Each coverslip was carefully collected from the 12-well plates and mounted onto another clean coverslip with cells in the middle. The mounted coverslips with cells were stored at 4 ℃ in humidified chamber in dark and observed under the confocal laser scanning microscope (Leica Tcs SP2, Germany).
Extraction of proteins for cells and mitochondria
Cells were lysed in cell lysis buffer, and total protein in the supernatant was collected.
The mitochondrial proteins were extracted with a mitochondrial protein extraction kit according to the manufacturer's instructions. Briefly, SK-Hep1 and SK-Hep1/CDDP1, 2, and 3 cells were harvested separately. Protease inhibitors were added into reagents A and C before using and 2×10⁷ cells in 2-mL Eppendorf tube were centrifuged at 850× g for 2 min. The supernatant was removed and 800 μL of reagent A was added followed by vortexing for 5 s. After 2 min of incubation on ice, cells were transferred into a homogenizer followed by homogenization on ice. The homogenate was transferred into a 2-mL Eppendorf tube followed by addition of 800 μL of reagent C. Then, 200 μL of reagent A was used to wash the homogenizer and then added into the same Eppendorf tube followed by mixing via inversion for several times. The homogenate was centrifuged at 700× g at 4 ℃ for 10 min and the supernatant transferred into a 2-mL Eppendorf tube followed by centrifugation at 12000× g at 4 ℃ for 15 min. The supernatant (cytoplasmic portion) was transferred into another Eppendorf tube. The pellets on the bottom were the mitochondria and then re-suspended in 500 μL of reagent C followed by centrifugation at 12000× g for 5 min. The supernatant was removed, and the pellets were mixed in 50-100 μL of 20 g/L 3-[(3-cholamidopropyl)dimethylammonio]-1-propanesulfonate (CHAPS) by vortexing for 1 min followed by centrifugation at 12000× g for 2 min. The supernatant containing mitochondrial proteins was collected.
Detection of hTERT protein in cells and mitochondria by western blot assay
Protein concentrations of cell lysate and mitochondrial fraction were determined with BCA protein quantification kit. Then, 100 μg of denatured protein from each sample was loaded, separated on 6% polyacrylamide gel and transferred onto a PVDF membrane which was then blocked in 5% skim milk at room temperature for 1 h. The membrane was incubated with anti-hTERT primary antibody (1:500) in Tween 20-containing Tris-buffered saline solution (TBST) overnight at 4 ℃. The membrane was washed with TBST thrice, incubated with horseradish peroxidase-conjugated secondary antibody (1:12000) in TBST at 37 ℃ for 1 h, washed with TBST thrice and incubated with ECL substrate. The film was exposed and developed in 1 min, and the densitometry of each bands were determined and analyzed with Gel-Pro gel analysis software (Bio-Rad). The expression of target protein was normalized by β-actin as an internal reference and the protein expression was determined in 3 measurements followed by averaging.
Detection of mtDNA damage by real time PCR
It has been reported that damaged mtDNA is denatured after being heated at 94 ℃ for 2 min and can be amplified by PCR, whereas the undamaged mtDNA is still intact and can not be amplified [13]. However, after being heated at 94 ℃for 6 min, all intact and damaged mtDNAs are denatured and can be amplified. Therefore, the degree of the damage to mtDNAs can be determined by the amplification frequency.
Mitochondrial DNAs were extracted according to previously described by Santos et al. and Passos et al [14,15]. Real time PCR was carried out according to manufacturer's instructions. Primers were as follows: forward 5'-GATTTGGGTACCACCCAAGTA- TTG-3' (16042-16064); reverse 5'-AATATTCA TGGTGGCTGGCATGTA-3' (16125- 16102). The PCR conditions were as follows: 94 ℃ for 2 min; 94 ℃for 30 s, 60 ℃for 45 s, 72 ℃for 45 s, for total of 32 cycles to obtain the first Ct value (Ct1); 94 ℃for 6 min, 94 ℃for 30 s, 60 ℃for 45 s, 72℃for 45 s, for total of 32 cycles to obtain the second Ct value (Ct2). The ratio of Ct1 to Ct2 was used as the amplification frequency.
Real time PCR detection for the relative length of telomeres
The relative length of telomeres under either normal or chemotherapeutic stress condition was detected in SK-Hep1 cells, SK-Hep1/CDDP1 cells, SK-Hep1/CDDP2 cells and SK-Hep1/CDDP3 cells according to previously described by Cawthon et al [16]. The ratio of Ct value of telomere gene to that of 36B4 gene (a reference single copy gene) of each sample was designated as T/S ratio, which was used to reflect the relative length of telomeres. The primers for telomere gene were as follows: forward 5'-GGTTTTTGAGGGTGAGGGTGAGGGTGAGGGTGAGGGT-3' (270 nM); reverse 5'-TCCCGACTATCCCTATCCCTATCCCTATCCCTATCCCTA-3' (900 nM). The primers for 36B4 gene were as follows: forward 5'-CAGCAAGTGGGAAGGTGTAATCC-3' (300 nM); reverse 5'-CCCATTCTATCATCAACGGGTACAA-3' (500 nM). The PCR was carried out on Corbett Research Rotor-Gene 3000 Real time Thermal Cycler (Corbett Research, Cambridge, UK). The PCR conditions for telomere gene amplification was as follows: 35 cycles of 95 ℃ for 10 min; 95 ℃for 15 s, 54 ℃for 2 min. The PCR conditions for 36B4 gene were similar except for annealing and extension at 58 ℃ for 1 min. Since the T/S ratio can accurately reflect the relative length of telomere gene only if 36B4 can be equally amplified from each sample, the equal copy number of 36B4 in each sample was further confirmed by the ratio of copy numbers of 36B4 gene to that of β-globin gene. Primers for β-globin gene were as follows: forward 5'-GCTTCTGACACAACTGTGTTCACTAGC-3' (400 nM); reverse 5'-CACCAACTTCATCCACGTTCACC-3' (400 nM). The specific amplification of each gene was confirmed by melt curve.
Detection of mitochondrial membrane potential
According the manufacturer's instructions, cells were maintained on coverslips in presence of 10 μg/mL CDDP at an atmosphere with 5% CO2 at 37 ℃ for 24 h, washed in PBS twice, incubated with diluted JC-1 solution for another 15-20 min and then washed with incubation solution for once or twice. Cells on the coverslip were observed under a confocal laser microscope. In normal cells, JC-1 molecules form polymers in the mitochondria, emitting bright red fluorescence. In the presence of damaged mitochondrial membrane potential, JC-1 was released from the mitochondria into the cytoplasm as monomers emitting green fluorescence.
Statistical analysis
Statistical analysis was performed by using SPSS version 13.0 with analysis of variance (ANOVA). A value of P<0.05 was considered statistically significant.
Results
Induction of SK-Hep1/CDDP cell lines with different RIs
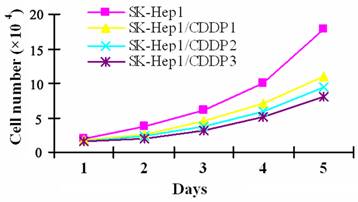
To induce CDDP resistance, SK-Hep1 cells were pulse-treated in vitro with high dose CDDP, which resulted in cell enlargement, cytoplasmic vacuolar degeneration, faintness of the cell membrane, or even cell death. Only a few cells survived from the treatment and gradually resumed the logarithmic growth after the withdrawal of drugs. SK-Hep1/CDDP1 cells, SK-Hep1/CDDP2 cells and SK-Hep1/CDDP3 cells, three cell lines with different RIs, are obtained within the six-month induction. Although the drug-resistant cells were spindle-shaped with increased black granules in the cell processes and cytoplasm, their morphology was basically close to that of parental cells. As shown by cell growth curve in Fig 1, the growth of drug-resistant cells was relatively slower than that of their parental cells, and the Td of SK-Hep1/CDDP1, 2, and 3 cells was 29.59 h, 30.66 h and 32.18 h, respectively, which were significantly longer than the 25.41 h of parental cells (P<0.05).
Growth curve of SK-Hep1 cells and drug resistant cell lines. CDDP resistant SK-Hep1/CDDP1 cells, SK-Hep1/CDDP2 cells and SK-Hep1/CDDP3 cells were established by pulse treatment with high dose CDDP, and the growth of drug-resistant cells was relatively slower than that of their parental cells, and the Td of SK-Hep1/CDDP1, 2, and 3 cells was 29.59 h, 30.66 h, and 32.18 h, respectively, which were significantly longer than the 25.41 h of parental cells (P<0.05).
Drug resistance of SK-Hep1/CDDP cells
The IC50 to CDDP was 5.42±0.04μg/mL, 40.72±0.06μg/mL, 50.48±1.02μg/mL, and 70.61±1.06 μg/mL for SK-Hep1 cells, SK-Hep1/CDDP1 cells, SK-Hep1/CDDP2 cells and SK-Hep1/CDDP3 cells, respectively, and the RIs of SK-Hep1/CDDP1 cells, SK-Hep1/CDDP2 cells and SK-Hep1/CDDP3 cells were 8.52, 10.03, and 12.18, respectively, shown by WST-8 assay. Further experiments confirmed that the degree of resistance to DOX and 5-FU was also different among SK-Hep1/CDDP1 cells, SK-Hep1/CDDP2 cells and SK-Hep1/CDDP3 cells (Table 1).
Apoptosis of drug-resistant cells
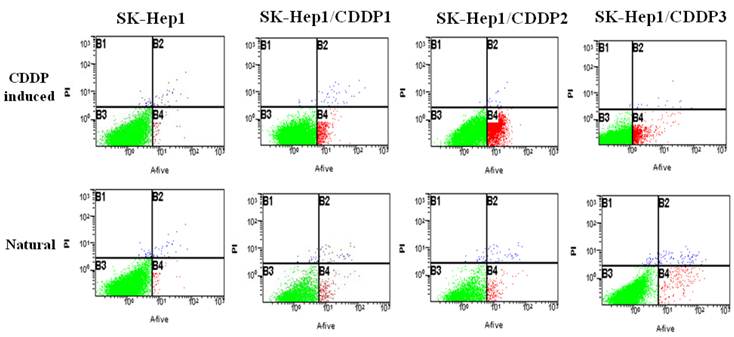
Natural and chemotherapy-induced apoptosis rates of parental and drug-resistant cells were detected by flow cytometry. Results showed that both natural and chemotherapy-induced apoptosis rates of SK-Hep1/CDDP1 cells, SK-Hep1/CDDP2 cells and SK-Hep1/CDDP3 cells were significantly lower than those of parental cells (P<0.01). (Fig 2, Table2)
Detection of cell cycle by flow cytometry
Cell cycles of parental and drug-resistant cells were detected by flow cytometry, and results showed that the S phase (DNA synthesis phase) in three drug-resistant cell lines was extended when compared with that in parental cells, but G1 phase (pre-DNA synthesis phase) was shortened in three drug-resistant cell lines, indicating that, with the increase in RI, cell cycle was gradually extended (P<0.01). (Table 3)
Translocation of hTERT into mitochondria in drug-resistant cells
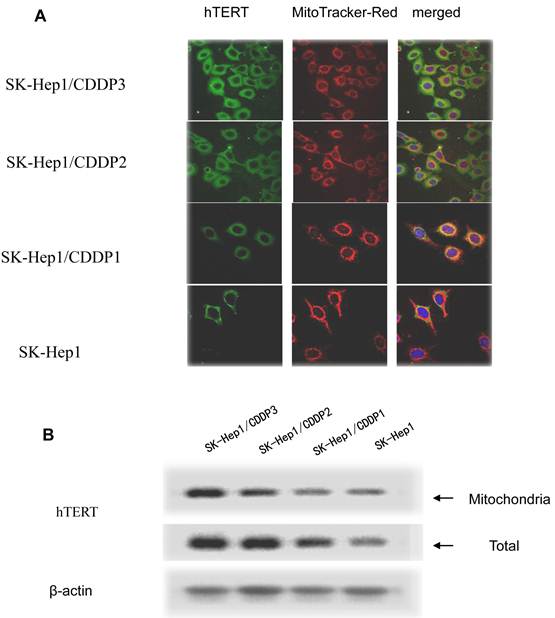
In drug-resistant cell lines, with the increase in RI, hTERT gradually translocated from the nuclei into the mitochondria. Colocalization of hTERT with nuclear and mitochondrial markers demonstrated that hTERT signal (green fluorescence) significantly clustered in the mitochondria (red fluorescence) in drug-resistant cell lines, indicating the mitochondrial translocation of hTERT (Fig.3A).
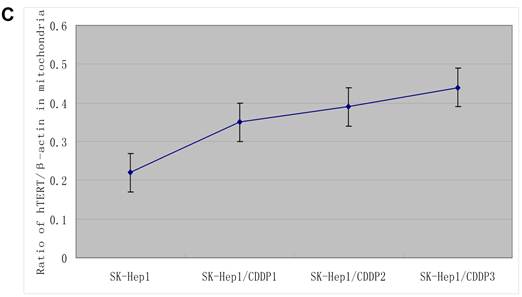
The hTERT protein in cells and in mitochondria was further detected by Western blot assay. Results showed that, with the increase in RI, although both the total and mitochondrial levels of hTERT protein in drug-resistant cells increased, the extent of increase in the former was significantly lower than that in the latter, further indicating the presence of mitochondrial translocation of hTERT in drug-resistant cells. (Fig.3B)
Sensitivities of SK-Hep1 cells and drug-resistant cells to chemotherapeutic drugs. Data are represented as mean±standard deviation (* P<0.01 vs SK-Hep1 cells).
| Drugs | SK-Hep1 | SK-Hep1/CDDP1 | SK-Hep1/CDDP2 | SK-Hep1/CDDP3 | |||
|---|---|---|---|---|---|---|---|
| IC50 (µg/mL) | IC50 (µg/mL) | RI | IC50 (µg/mL) | RI | IC50 (µg/mL) | RI | |
| CDDP | 5.42±0.04 | 40.72±0.06* | 7.51 | 50.48±1.02 | 9.31 | 70.61±1.06* | 13.76 |
| DOX | 0.62±0.08 | 2.12±0.15* | 3.42 | 2.75±0.11 | 4.92 | 3.42±1.04* | 5.58 |
| 5-FU | 11.42±0.42 | 23.75±0.08* | 2.08 | 38.28±0.35 | 3.35 | 50.33±0.04* | 4.41 |
Apoptosis rate from flow cytometry (%).*P<0.05 vs SK-Hep1.**P<0.01 vs SK-Hep1. a, P<0.01 vs SK-Hep1.
| Apoptosis rate | SK-Hep1 | SK-Hep1/CDDP1 | SK-Hep1/CDDP2 | SK-Hep1/CDDP3 |
|---|---|---|---|---|
| Natural | 1.77±0.35 | 1.10±0.18* | 0.73±0.25* | 0.37±0.04** |
| CDDP induced | 35.02±0.33 | 5.93±1.07a | 4.80±0.83a | 3.20±0.16a |
Cell cycle from flow cytometry (%).*P<0.01,vs SK-Hep1.
| Cell cycle | SK-Hep1 | SK-Hep1/CDDP1 | SK-Hep1/CDDP2 | SK-Hep1/CDDP3 |
|---|---|---|---|---|
| S phase | 32.12±3.35 | 41.02±2.18* | 42.22±3.46* | 45.16±4.67* |
| G1 phase | 58.68±2.07 | 42.58±5.01* | 38.18±3.07* | 33.07±2.82* |
| G2/M phase | 8.91±4.38 | 16.06±2.88* | 19.08±3.15* | 21.77±2.03* |
Detection of apoptosis by flow cytometry. Both natural and chemotherapy-induced apoptosis rates of SK-Hep1/CDDP1 cells, SK-Hep1/CDDP2 cells and SK-Hep1/CDDP3 cells were significantly lower than those of parental cells (P<0.01).
Mitochondrial translocation of hTERT. A: Presence of hTERT in the mitochondria. With the increase in RI, hTERT gradually translocated from the nuclei into the mitochondria. Colocalization of hTERT with nuclear and mitochondrial markers demonstrated that hTERT signal (green fluorescence) significantly clustered in the mitochondria (red fluorescence) in drug-resistant cells. B. Quantification in Western blot assay of hTERT by densitometry. Mitochondrial hTERT in drug-resistant cells increased with increase in RI.
Protective effect of mitochondrial hTERT on mtDNA and mitochondrial membrane potential
Translocated hTERT into the mitochondria in drug-resistant cells protected mtDNA from chemotherapy-induced damage. When SK-Hep1 cells, SK-Hep1/CDDP1 cells, SK-Hep1/CDDP2 cells and SK-Hep1/CDDP3 cells were under common chemotherapeutic stress, the amplification frequencies of their mtDNAs decreased with the increase in RI, indicating that mitochondria-translocated hTERT protected mtDNA and alleviate the damage. (Table 4)
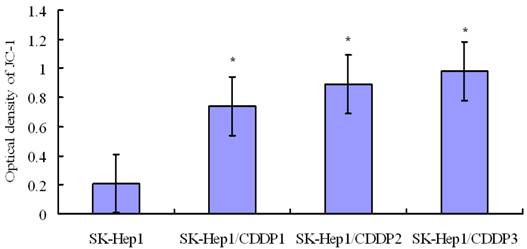
Detection of mitochondrial membrane potential by confocal laser microscopy indicated that mitochondrial membrane potential in SK-Hep1 cells decreased significantly after 24-h culture in medium containing 10 μg/mL CDDP, whereas the membrane potential in drug-resistant cells remained at a relatively high level after treatment. These findings suggest that mitochondrial translocation of hTERT may improve the mitochondrial function and reduce the level of mitochondrial reactive oxygen species (ROS), through which it is tightly coupled with mitochondrial function [5]. (Fig 4)
Length of telomere
Under chemotherapeutic stress (10 μg/mL CDDP), the length of restriction fragment of telomere gene was shortened in both drug-resistant cells and parental cells, although the speed of shortening in the former was slower than that in the latter, indicating that, under chemotherapeutic stress, hTERT in drug-resistant cells did not prevent the telomere gene from shortening (Table 5).
Amplification frequency of mtDNA from Real-time PCR. *P<0.05 vs SK-Hep1; **P<0.01 vs SK-Hep1.
| Condition | SK-Hep1 | SK-Hep1/CDDP1 | SK-Hep1/CDDP2 | SK-Hep1/CDDP3 |
|---|---|---|---|---|
| Normal | 1.00±0.12 | 0.75±0.08* | 0.43±0.11** | 0.08±0.02** |
| Under stress | 4.49±0.04 | 2.44±0.21* | 1.57±0.03** | 0.87±0.04** |
Length of telomere in cells under normal and stress conditions. *P<0.01 vs SK-Hep1.
| Condition | SK-Hep1 | SK-Hep1/CDDP1 | SK-Hep1/CDDP2 | SK-Hep1/CDDP3 |
|---|---|---|---|---|
| Normal | 1.33±0.38 | 1.70±0.25* | 2.00±1.02* | 3.33±0.08* |
| Stress | 0.13±0.14 | 0.62±0.02* | 0.80±0.58* | 2.13±0.11* |
Detection of mitochondrial membrane potential by flow cytometry following JC-1 staining. Mitochondrial membrane potential in SK-Hep1 cells decreased significantly after 24-h culture in medium containing 10 μg/mL CDDP, whereas the membrane potential in drug-resistant cells remained at a relatively high level after this treatment. *P<0.05 vs SK-Hep1 cells.
Discussion
MDR is a major obstacle of clinical chemotherapy of cancers. MDR involves two types of classical membrane transporters in cancer cells [17]. One is the ATP binding cassette (ABC) transporter superfamily, which can transport a particular substance (drugs) across the plasma membrane against the concentration gradient to escape the anti-cancer effect of chemotherapy [18] and the other is solute carrier transporter superfamily, which can regulate the absorption of anti-cancer drugs in cells.
In 1997, the study of Nason et al [19] confirmed that the drug resistance in cancer cells was related to the over-expression of hTERT. However, whether the hTERT over-expression in the mitochondria of cancer cells is related to the presence of drug resistance remains elusive.
In the present study, three drug-resistant human HCC lines (SK-Hep1/CDDP1 cells, SK-Hep1/CDDP2 cells and SK-Hep1/CDDP3 cells) with different RIs were established. By using immunofluorescence staining and confocal laser microscopy, our results demonstrated that mitochondrial expression of hTERT in drug-resistant cancer cells significantly increased with the increase in RI, suggesting that the mitochondrial translocation of hTERT might be related to MDR of cancer cells.
Haendeler et al [11] showed that the hTERT activity in HEK 293 cells was 60%, 20%, and 20% in the nuclei, mitochondria and cytoplasm, respectively. Recent studies [9, 20, 21] have also indicated that oxidative stress and drug treatment can lead to the hTERT translocation from the nuclei to the mitochondria protecting the mitochondrial function (protection of mtDNA, reduction mitochondrial membrane potential, etc.) and preventing apoptosis. The mtDNA damage has long been used as a sensitive indicator of cellular oxidative stress, and the mitochondrial function plays an important role in the determination of cell lifespan [22]. Saretzki et al [5] indicated that hTERT could improve the mitochondrial function and reduce oxidative stress, which was regarded as a new feature of hTERT.
Our findings also demonstrated that hTERT exerted protective effect on mitochondria after translocating into the mitochondria. Our results showed, after incubation of parental and drug-resistant cells in medium containing 10 μg/mL CDDP for 24 h, the amplification frequency of mtDNAs in drug-resistant cells was significantly lower than that in parental cells, indicating that the mtDNA damage in drug-resistant cells was significantly reduced. That is, mtDNA was protected by hTERT following its mitochondrial translocation. In addition, JC-1 staining of parental and drug-resistant cells showed that the mitochondrial membrane potential was not significantly reduced in drug-resistant cells but markedly declined in parental cells.
The specific function of hTERT translocation from the nuclei and its relationship with other subcellular organelles remain largely unknown. hHTERT protein has nuclear and nucleolar localization and nuclear export signals. Haendelers et al [9, 11] have confirmed the protective effect of hTERT mitochondrial translocation. Under normal conditions, hTERT can protect the telomeres, whereas under oxidative stress, hTERT protects the mitochondria. Under excessive stress, subcellular translocation of hTERT outside the nuclei may form a new regulatory mechanism of the catalytic activity of hTERT, especially at transcriptional level. Mitochondria may function synergistically with telomere. Under normal conditions, in various cell types, 20-30% of hTERT protein is found outside the nuclei, especially in the mitochondria.
To which extent hTERT translocates to other cytoplasmic compartments and how such process goes are poorly understood currently. Mitochondrial translocation of hTERT increases the mitochondrial membrane potential, reduces the cellular ROS level, improves the mitochondrial function and declines the copy number and damage to mtDNAs.
High level of mitochondrial translocation of hTERT leads to the reduction of nuclear hTERT, which results in compromised protection of telomeres. Under chemotherapeutic stress, the telomeres continue to shorten in the drug-resistant cells, however, at a reduced speed as compared to that in parental cells. This indicates that under the stress, the effect of mitochondrial translocation of hTERT is independent of the function of telomere and, therefore, can not maintain the telomere length.
Conclusion
Upon exposure of cancer cells to chemotherapeutic drugs, hTERT can translocate from the nuclei to the mitochondria playing important roles in mitochondrial protection, such as protection of the mitochondrial membrane potential and reduction of the oxidative stress and the oxidative damage to mtDNA. Cancer cells prevent apoptosis through the protective effect of hTERT on mitochondria. Therefore, mitochondrial translocation of hTERT may form a new mechanism of MDR of cancer cells.
Acknowledgements
This work was supported by National Natural Science Foundation of China (81101892) and Xinqiao Hospital Grant (1520).
Competing Interests
The authors have declared that no competing interest exists.
References
1. Pérez-Tomás R. Multidrug resistance: retrospect and prospects in anti-cancer drug treatment. Curr Med Chem. 2006;13:1859-1876
2. Szakács G, Paterson J. Targeting multidrug resistance in cancer. Nat Rev Drug Discover. 2006;5:219-234
3. Teodori E, Dei S, Martelli C, Scapecchi S, Gualtieri F. The functions and structure of ABC transporters: implications for the design of new inhibitors of Pgp and MRP1 to control multidrug resistance (MDR). Curr Drug Targets. 2006;7:893-909
4. Tomás-Loba A, Flores I, Fernández-Marcos PJ, Cayuela ML, Maraver A, Tejera A. et al. hTERT reverse transcriptase delays aging in cancer-resistant mice. Cell. 2008;135:609-622
5. Saretzki G. hTERT, mitochondria and oxidative stress. Exp Geronto. 2009;44:485-492
6. Kuranaga N, Shinomiya N, Mochizuki H. Longterm cultivation of colorectal carcinoma cells with anticancer drugs induces drug resistance and telomere elongation: An in vitro study. BMC Cancer. 2001;1:10-19
7. Li S, Crothers J, Haqq CM. Cellular and gene expression responses involved in the rapid growth inhibition of human cancer cells by RNA interference-mediated depletion of hTERT RNA. J Biol Chem. 2005;280:23709-23717
8. Bagheri S, Nosrati M, Li S, Fong S, Torabian S, Rangel J. et al. Genes and pathways downstream of hTERT in melanoma metastasis. Proc Natl Acad Sci USA. 2006;103:11306-11311
9. Ahmed S, Passos JF, Birket MJ, Beckmann T, Brings S, Peters H. et al. hTERT does not counteract telomere shortening but protects mitochondrial function under oxidative stress. J Cell Sci. 2008;17:1046-1053
10. Choi J, Southworth LK, Sarin KY, Venteicher AS, Ma W, Chang W. et al. TERT promotes epithelial proliferation through transcriptional control of a Myc-and Wnt-related developmental program. PLoS Genet. 2008;4:e10
11. Haendeler J, Dröse S, Büchner N, Jakob S, Altschmied J, Goy C. et al. Mitochondrial telomerase reverse transcriptase binds to and protects mitochondrial DNA and function from damage. Arterioscler Thromb Vasc Biol. 2009;29:929-935
12. Zhou Y, Ling XL, Li SW, Li XQ, Yan B. Establishment of a human hepatoma multidrug resistant cell line in vitro. World J Gastroenterol. 2010;16:2291-2297
13. Chen J, Kadlubar FF, Chen JZ. DNA supercoiling suppresses real-time PCR: a new approach to the quantification of mitochondrial DNA damage and repair. Nucleic Acids Res. 2007;35:1377-1388
14. Passos J, Saretzki G, Ahmed S, Nelson G, Richter T, Peters H. et al. Mitochondrial dysfunction accounts for the stochastic heterogeneity in telomere-dependent senescence. PLoS Biol. 2007;5:e110
15. Santos JH, Meyer JN, Mandavilli BS, Van Houten B. Quantitative PCR-based measurement of nuclear and mitochondrial DNA damage and repair in mammalian cells. Methods Mol Biol. 2006;314:183-199
16. Cawthon RM. Telomere measurement by quantitative PCR. Nucleic Acids Res. 2002;30:e47
17. Liu FS. Mechanisms of chemotherapeutic drug resistance in cancer therapy-a quick review. Taiwan J Obstet Gynecol. 2009;48:239-244
18. Moitra K, Lou H, Dean M. Multidrug Efflux Pumps and Cancer Stem Cells: Insights Into Multidrug Resistance and Therapeutic Development. Clin Pharm Therap. 2011;89:491-502
19. Nason-Burchenal K, Maerz W, Allopenna J, Allopenna J, Martin P, Moore MA. et al. Common defects of different retinoic acid resistant promyelocytic leukemia cells are persistent telomerase activity and nuclear body disorganization. Differentiation. 1997;61:321-331
20. de Magalhães JP, Chainiaux F, Remacle J, Toussaint O. Stress-induced premature senescence in BJ and hTERT-BJ1 human foreskin fibroblasts. FEBS Lett. 2002;523:157-162
21. Gorbunova V, Seluanov A, Pereira-Smith OM. Expression of human telomerase (hTERT) does not prevent stress-induced senescence in normal human fibroblasts but protects the cells from stress-induced apoptosis and necrosis. Biol Chem. 2002;277:38540-38549
22. Sedensky MM, Morgan PG. Mitochondrial respiration and reactive oxygen species in mitochondrial aging mutants. Exp Gerontol. 2006;41:237-245
Author contact
![]() Corresponding author: Dr. Xianlong Ling, Department of Gastroenterology, Xinqiao Hospital, Third Military Medical University, Chongqing 400037, China. Phone: 86-23-68774204; Email: docxianlongnet; Lei Wen, Email: mercury098edu.cn
Corresponding author: Dr. Xianlong Ling, Department of Gastroenterology, Xinqiao Hospital, Third Military Medical University, Chongqing 400037, China. Phone: 86-23-68774204; Email: docxianlongnet; Lei Wen, Email: mercury098edu.cn
Received 2012-5-24
Accepted 2012-8-19
Published 2012-8-30