ISSN: 1449-1907International Journal of Medical Sciences

Int J Med Sci 2007; 4(4):179-189. doi:10.7150/ijms.4.179 This issue Cite
Research Paper
The Geography of Chronic Obstructive Pulmonary Disease Across Time: California in 1993 and 1999
Robert Lipton, Anirudhha Banerjee ![]()
Prevention Research Center, 1995 University Ave. Suite 450, Berkeley, CA 94704, USA
Abstract
We investigated changes in the geography of Chronic Obstructuve Pulmonary Disease (COPD) hospitalization charges in California over the period of 1993 and 1999. There is little information available at less than the county level for this increasingly costly disease in California. We found, using a uniform grid unit method, (4X4 and 16X16 mile urban and rural grids respectively, using zip codes as the base source for information) positive relationships between COPD charges and age, percentage Hispanics, and number of tobacco outlets. Further, inverse relationships were found between the incidence of COPD charges and income level and the percentage of the population with undergraduate degrees. When examining “hotspot” grid units, we found that COPD was clearly associated with minority/immigrant status and depressed socio-economic measures, suggesting the need for better smoking interventions among persons of color and the poor. In summary, the Los Angeles area had a marked increase in hotspots both in 1993 and 1999, and also experienced a significant increase in COPD hospitalization charges between 1993 and 1999. Transforming zip code level data into a uniform grid allows for relatively simple comparisons across time, without such a transformation, such temporal comparisons are extremely difficult to implement. This more, “fine grained” geographical analysis allows public health planners a better platform than is typically available to assess changes in COPD.
Keywords: chronic obstructive pulmonary disease, spatial analysis, uniform grid, tobacco related disease, hot spots
1. INTRODUCTION
Chronic obstructive pulmonary disease (COPD) morbidity and mortality represent a major public health concern both in the U.S. and worldwide. As of 2002, 16 million U.S. residents were estimated to suffer from COPD, primarily from chronic bronchitis. Moreover, this problem appears to be worsening, as the prevalence of COPD is increasing in the elderly and female populations [1]. Overall, COPD-related mortality has markedly increased, from the twelfth cause of death in 1990 to its current position as the fourth leading cause of death in the U.S. and worldwide [2, 3, 4]. Approximately 120,000 adults (25 years of age and older) died from COPD in 2000 in the US. Although the COPD death rate for women doubled between 1980 and 2000, the age-adjusted death rate for men was 43% higher. Since 2000, yearly death rates for women have been higher than for men.
The increasing incidence of COPD is reflected in increasing health care costs to treat and care for patients. The total cost of COPD in the U.S. was approximately $32 billion dollars in 2002. And these costs are far from complete, as it is estimated that less than half of U.S. COPD cases are diagnosed (i.e., 14 to 46 percent),with females much less likely than males to be diagnosed. While hospitalization costs comprise the bulk of the cost burden for COPD disease, additional high costs are associated with long-term oxygen therapy, the only effective therapy for decreasing COPD-related deaths [4].
How might these increased costs be considered in a global context? The global burden of disease study conducted by the World Bank estimates that by the year 2020, COPD will be the number three killer worldwide, and the number five ranked disease for disability-adjusted life years lost (DALYs) [1]. Similarly, Izquierdo (2003) conducted an economic analysis of a large international survey, Confronting COPD in North America and Europe, and found the annual cost of COPD to the healthcare system was Euro 3,238 per patient, plus indirect costs amounting to Euro 300 per patient [5]. In Spain, a significant proportion of the economic burden of COPD on the Spanish healthcare system was associated with inpatient hospitalization (Euro 2,708), which accounted for almost 84% of the total direct cost of the disease. The impact of COPD on the healthcare system may also be due to under-diagnosis and treatment of COPD, suggesting the need for improved early detection and primary care. Earlier diagnosis of COPD could help ameliorate more serious and costly complications, Lipton et al, 2005. The sub-analysis of costs from the survey showed that patients with severe COPD were associated with considerably higher total societal costs than patients with mild disease (Euro 9,850 versus Euro 1,316 per patient). Izquierdo (2003) concluded that introducing interventions to reduce patients' progression to severe COPD could help reduce the economic impact of the disease [5].
How do we account for these increases in rates of COPD? Chronic obstructive pulmonary disease (COPD) is a condition characterized by progressive airflow limitation, which causes considerable morbidity and mortality worldwide. Between 80 and 90% of COPD cases are due to cigarette smoking, while additional cases are due to serious lung infections, environmental causes, or genetic conditions [5,6]. Yet the prevalence of COPD is poorly understood and the healthcare costs associated with the disease are poorly characterized. Few studies have attempted to quantify the impact of the disease on patient health, the healthcare system, caregivers and family members, and society as a whole [6] and little is known about its behavioral, socio-economic or environmental etiology.
COPD in California
As the nation's most populous state, California has experienced a great deal of population growth in the last decade, and approximately 10 percent of the U.S. population resides in the state. Moreover, it is a state characterized by significant cultural and economic diversity and thus provides an opportunity to consider the distribution of the disease relative to a number of socio-demographic, environmental and behavioral (most notably smoking) characteristics. Approximately 1.6 million people are afflicted with COPD within the state of California [6]). Given the fact that COPD is a very expensive disease to treat as well as costly in regard to premature morbidity and mortality, it is imperative that we develop a thorough understanding of the dimensions of this disease, both in terms of costs and prevalence. Motivated by this concern, this analysis will examine the geographic distribution of COPD in California for the years 1993 and 1999 relative to background demographic, environmental and behavioral characteristics in the state.
An additional feature of this study is the use of geospatial methodology, which has the potential to improve the estimation of COPD prevalence. At present, relatively little is known about the spatial distribution of COPD prevalence and disease-related hospitalization charges in California over time, particularly at any level of analysis smaller than the county. Possible geographic differences in COPD can easily be obscured at this relatively large areal level. Therefore, in this analysis, we examined COPD hospitalization charges by smaller geographic areas, e.g. Zip Code Tabulation Area (ZCTAs) units.
Our use of geospatial methodologies also provides tools for integrating socio-demographic characteristics and tobacco use information across geographic areas that are not possible with more traditional non-spatial methodologies. Further, mapping of population density, major roads, air pollution data, can, depending on the needs of researchers and planners, be easily included. In addition, by using spatial modeling our analysis identifies geographic areas with higher-than-expected hospitalization charges related to COPD. The panel design, which compares hospitalization charges for two time periods, 1993 and 1999, also allows us to assess changing patterns of COPD healthcare charges in a time of rapid population growth. Lastly, our analysis is augmented by a novel approach toward interpolating Zip Code Tabulation Area (ZCTA) units into a uniform geographic grid that allows us to compare consistent geographic areas over time. This research can help public health and policy planners more clearly identify where high levels of TRD occur in the state. Indeed, this approach allows for the efficient identification of clusters of high rates of disease while controlling for salient socio-demographic measures.
2. METHODS
Health Data
As defined by the U.S. Census, Zip Code Tabulation Areas (ZCTA) are “areas that approximate the areas covered by the U.S. Postal Service's five-digit or three-digit ZIP Code” [7]. All information used in this analysis was available at the ZCTA level, and for this analysis we initially used all 1,527 ZCTA units for 1993, and all 1,707 ZCTA units for the entire state of California in 1999. We geo-coded addresses by ZCTAs for the 1999 data and joined them with the U.S. Census Bureau summary files 3 (SF-3) for ZCTAs. One of the benefits of using ZCTAs is that the SF-3 Census 2000 data contain detailed information for socio-demographic variables. Zip code level information was then transformed into uniform grid information (as discussed at length below) for both time periods. The asymmetric nature of the number of zip codes prompted us to choose a regular grid that was symmetrical and suitable for panel data analysis.
We collected annual audited Hospital Discharge Data (HDD) for all inpatients discharged from hospitals licensed by the State of California, as submitted to the Medical Information Reporting for California System [8]. According to HDD, there were approximately 3,664,629 million patient records available in 1993, and 3,775,711 million patient records available in 1999. These data contain pertinent information for diagnosis, reason for hospital stay and charges for stay. Using these records, we used hospitalization counts of COPD, defined as ICD-9 codes 490-492, 494, 496, as a way to estimate COPD charges. Due to re-admittance, our method is therefore not an exact estimate of COPD related hospitalization charges, but rather an approximation of initial charges. Since hospital admissions data do not code for readmission, readmission issues are not addressed in total charges. However, it can be assumed that biased geographic variability of readmission rates are insignificant; i.e., that differences in readmission rates are randomly distributed throughout the state. Similarly, although total charges are not complete, they are assumed to be distributed in an unbiased manner throughout the state.
The main point of this analysis is to robustly describe the spatial pattern of COPD charges; we are not attempting to etiologically explain this distribution as much as we are attempting to give health planners better information about the geography of this illness in California. Asthma was explicitly excluded from this analysis because asthma is not as specific to smoking as are other diseases typically included in the spectrum of illnesses falling under the rubric of COPD.
We should also mention that our information regarding COPD charges excluded data from the Kaiser hospital network (accounting for approximately one-sixth of the patient population in California), and data on patients insured at Shriner Hospital. However, these insurance companies are located in urban areas in California with consistent proportions of members across geographic areas, and their absence does little to skew the total charges by geographic area. The Hospital Discharge Data provides robust numbers for illness by ICD-9 definitions (Lipton et al, 2005).
Socio-demographic Variables
Age, income, education, ethnicity/race, household information, and immigrant status were obtained from United States Census data from the years 1990 and 2000. Data from these years corresponded most closely with Hospital Discharge Data from 1993 and 1999.
Smoking Prevalence Data
Tobacco outlet information was estimated from California Alcohol Beverage Commission information from 1993 and 1999. We collected data from three types of outlets: restaurants, bars and off-premise stores (e.g., liquor stores, grocery stores, etc). With few exceptions, this latter category also sells tobacco products, and thus we used off-premise alcohol outlets as a surrogate estimate for number of tobacco outlets. Clearly, this is a conservative estimate of the number of tobacco outlets throughout the state as tobacco can be bought at locations other than off-premise alcohol outlets.
Spatial Modeling
Areas that are close in proximity are usually more alike, across a variety of demographic and environmental factors, then areas that are farther away from each other. When including areal information, such as income by zip code or education by census tract in an analysis, not taking into account area proximity could result in less precise results (statistical bias). To be clear, the placing of an administrative geographic matrix such as zip codes over the actual places people live requires a spatial adjustment of some sort. Indeed, correlated measurement error between spatial units often occurs in analyses of geographic data and can be a source of substantial bias in statistical tests. Given the fact that measurement errors between adjacent units tend to be correlated however, means that spatial autocorrelation or over-sampling errors can be corrected using spatial statistical models. Generalized least squares (GLS) estimators are available for this purpose and provide unbiased estimates of effects and diagnostics for this form of correlated measurement error [9, 10, 11, 12].
Moran's “I” statistic (MC) is a weighted correlation coefficient used to detect departures from spatial “unbiasness.” It measures spatial autocorrelation using a non-parametric procedure [13]. Using Moran's “I” statistics with this data, it was evident that large-scale spatial autocorrelation existed if Hospital Discharge Data were aggregated at the ZCTA level. The MC for total COPD charges was 0.75 in 1999, while the expected value for MC was ‑0.0004 (or approximately the theoretical mean of zero). For 1993, the MC was 0.73 with the same expected value of zero. This relatively high level of spatial bias required "adjustment" before regression results could be coherently assessed. Spatial regression is defined as non-linear regression that requires “weighting” to correct for autocorrelation. In this regard, it was possible to adjust for spatial autocorrelations using S3 (a set of Mathematica ™ commands developed for space-time regression models) [14], as the software, by definition, adjusts for autocorrelation bias.
Transforming Zip Code Level Data Into A Geo-Spatial Grid
Due to its primarily administrative and political nature, Zip code information is quite difficult to use for panel data analysis and public health purposes. Using irregular area units (like zip codes) for calculating disease risks poses problems of geo-statistical consistency. Changing the boundaries of collection units or grouping them differently produces different spatial patterns and gives rise to the Modifiable Areal Unit Problem or MAUP [15]. The ecological inference problem (or ecological fallacy; [16]), which refers to the failure to incorporate relevant, spatial information about individuals that changes the summary statistics, is a more generalized form of the MAUP.
According to Gotway [17], the MAUP and ecological fallacy are special cases of a mathematically well-defined problem known as the change of support problem (or COSP). COSP addresses the "specification bias" that can violate the properties of statistical inference and underpins the basis of probability theory [18, 19]. Gotway and Young [17] outline a combination of spatial smoothing and geostatistical upscaling or aggregation of data with point support to avoid statistical pitfalls associated with the COSP. One way to minimize the effects of the COSP is to collect point addresses of health events so that they are not affected by scale changes. Flexible aggregation of these points with the help of a grid (as opposed to ZCTAs or census tracts) neutralizes the effect of COSP. Although simple comparisons across time (panel data) are almost impossible with zip code analysis, they can be rendered in a straight forward fashion with the grid approach as used in our analysis.
To this end, we used a spatial overlay that applies a linear transformation of the zip code data to the grid, employing a “4 x 4” mile square grid for urban areas and a “16 x 16” mile grid for rural areas. This overlay procedure estimated the attributes of one or more features by superimposing them over other features, and determining the extent to which there was overlap between the grid and a spatial unit–in this instance, the degree of overlap between a spatial unit and a zip code. Information for each zip code was then proportionally divided into their share of the grid by estimating the ratio of the area overlaid. Statistically, this equates to a transformation using a uniform probability density function from one area to another area of support [19, 20, 21, 22]
For this study, there were 1,527 zip code areas in 1993, and 1,707 zip code areas in 1999; after the spatial overlay procedure, both years had 2,224 grid units with exactly the same shape and size. The advantages of using a uniform grid structure for a temporal analysis are evident; for example, differential statistical support is eliminated, thereby minimizing COSP [17]. A possible disadvantage associated with this procedure is that some information will be lost when converting zip code areas into grid areas; however, the stability of the new units over time compensates for this by improving statistical support and minimizing statistical misspecification.
Challenges with Ecological Analyses
COPD total hospitalization charges were used to identify outlier grid units using a generalized least squares (GLS) regression model that controls for spatial autocorrelation. Comparing values between grid units requires density adjustment to correct for variances in grid unit populations at risk. This is traditionally done by comparing rates like per capita hospitalization charges or counts per 100,000 population when such linear adjustments sufficiently control for variances in area. However, in a regression model, adjusting for density is achieved by including an independent variable which does not require the restrictive assumption of linearity when controlling for density. In this study, the unadjusted dependent variable (total COPD charges in a grid unit) used to identify the outlier grid units was subsequently adjusted by including an independent variable (age 45 or greater) to provide an appropriate density correction. This approach limits the effects of over-smoothing and the linear assumption of density (which is a function of dividing by population) that can result when both independent and dependent density measures are created using a common population measure.
Analytic Approach
Our study was designed to produce relevant and timely information for further epidemiological research on COPD and provide evidence on the geo-spatial distribution of COPD to guide public health/public policy efforts. In this regard, we describe mean differences across grid units for socio-demographic, HDD, and smoking measures. Additional maps are presented showing the distribution of COPD hospitalization charges, for each time point (1993 and 1999), across the state (i.e., Figures 1 & 2). Modeling serves to control for spatial autocorrelation across spatial grid units. Models are generated comparing independent socio-demographic variables, and tobacco outlet information. Using this modeling we identified grid units with higher-than-expected COPD hospital admission rates and COPD hospitalization charges (e.g. “hotspots”). For these “hotspots” we then compared differences and similarities for socio-demographic variables in 1993 versus 1999.
3. RESULTS
Crude Data
In 1993, there were 68.8 COPD cases per 10,000 population, with charges of approximately $121 per capita. In 1999, total COPD cases rose to 81.7 per 10,000 population while total charges increased to $193 per capita, adjusted for total inflation (Table 1). This increase in charges could be due to a combination of factors, and may be influenced by population increase and/or an increase in healthcare costs associated with COPD. For this same time period, estimated tobacco outlets in the state increased by approximately 4% (from 60,690 in 1993 to 62,878 in 1999 respectively). As presented in Table 1, all changes between 1993 and 1999 were significant (using a studentized T-test; p<0.05).
Descriptive statistics for selected measures for the entire state of California.
| 1993 | 1999 | Percent change between years | |
|---|---|---|---|
| COPD Counts per 10,000 | 68.8 | 81.7 | 18.8% |
| COPD Charges per capita | $121 | $193 | 59.5% |
| Population | 29,667,299 | 33,871,250 | 14.2% |
| Age: 45 plus | 8,942,955 | 10,541,161 | 17.9% |
| Hispanic | 7,541,652 | 10,966,501 | 45.4% |
| Bachelor's degree or higher | 4,349,393 | 8,521,435 | 95.9% |
| Median Income | 37,401 | 56,416 | 50.8% |
| Tobacco Outlets in the state | 60,690 | 62,878 | 3.6% |
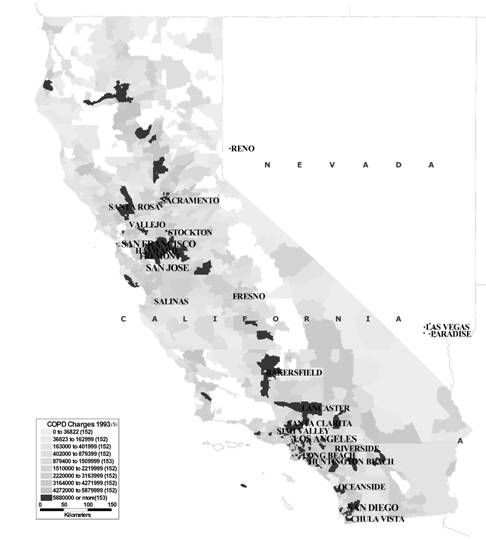
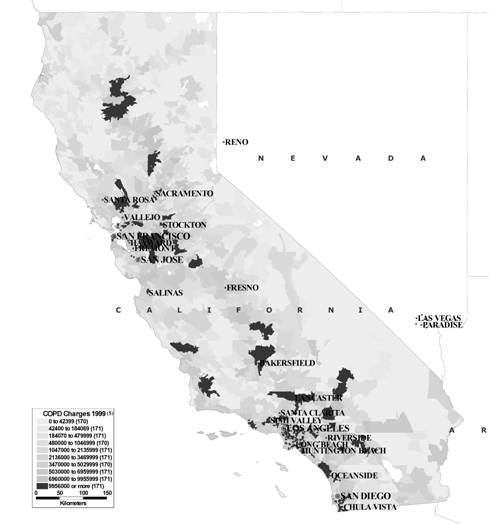
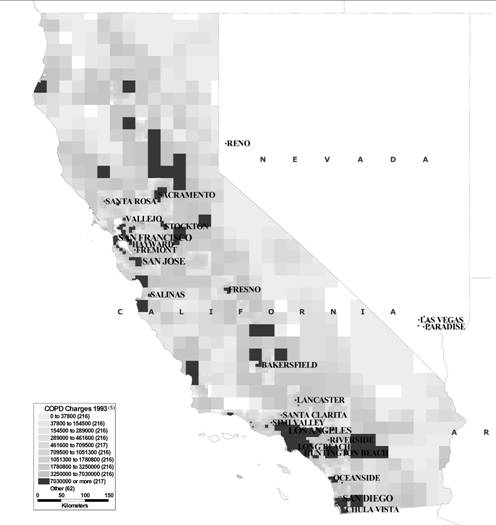
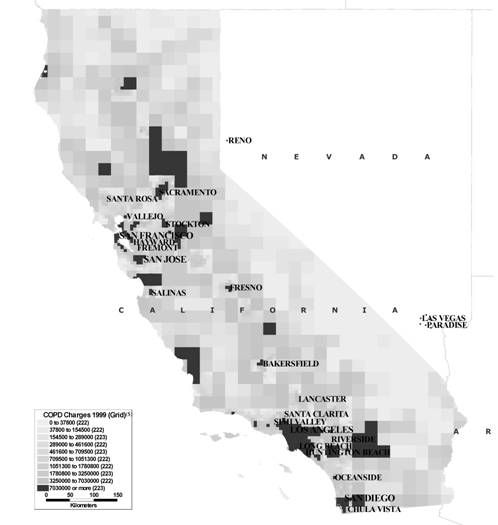
In Figures 1 & 2, COPD hospitalization charges are shown by ZCTA area for 1993 and 1999. Figures 3 & 4 show COPD hospitalization charges by uniform grid areas as described in the methods section. It should be noted that the grid-based maps are more easily comparable across years than ZCTA units, and indeed, the maps can be overlain directly upon one another. Other than that, the maps are quite similar with respect to their representation of the distribution of geographical areas with high levels of COPD charges. In all maps, the central valley of California, the south eastern portion of the state, and northern California reported high levels of COPD, especially in comparison to more urban coastal areas, such as the Los Angeles metropolitan area and the San Francisco Bay Area.
COPD charges 1993 (ZCTA deciles)
COPD charges 1999 (ZCTA deciles)
COPD charges 1993 (grid deciles)
COPD charges 1999 (grid deciles)
Spatial Model
In this analysis, we examined generalized linear models that controlled for spatial autocorrelation related to selected independent variables and COPD hospitalization charges in both 1993 and 1999. In order to provide a basis of comparison, we also included information for a 1999 model that uses ZCTA units in Table 2, although the remainder of the analysis will only include grid areal units. For all models, positive relationships were found for percentage of the population greater than 45 years of age, percentage population Hispanic, and for the number of tobacco outlets. In contrast, negative relationships were found between COPD charges and the percentage of the population with a bachelor's degree, as well as for populations with higher median family income (i.e., socioeconomic measures).
As shown in Table 2, the pseudo R-square (a measure of reduced variance; [23]) was approximately 0.79 for the 1999 ZCTA model and 0.94 for the 1999 grid unit data, demonstrating that the grid unit model offers a superior method of controlling variance due to spatial autocorrelation in comparison to a ZCTA model–a statistically desirable result. The 1993 grid model for COPD related charges had a pseudo R-square value of 0.96 that was similar to the 1999 value of 0.94. Furthermore, as the pseudo R-squared is significantly higher for the grid models compared to the ZCTA model, this may indicate a better model fit for the grid unit models, with certain assumptions. However, more research is needed to make a definitive theoretical claim.
Spatial Modeling of COPD Measures for California, 1993 and 1999*
| Measures | Zip Code model for COPD related charges, 1999 | Grid Model for COPD related charges, 1993 | Grid Model for COPD related charges, 1999 |
|---|---|---|---|
| Maximum Likelihood Coefficients | |||
| Percentage Age 45 plus | 457.10 | 360.95 | 499.53 |
| Percentage Hispanic | 24.25 | 26.46 | 46.35 |
| Percentage with bachelor's degree | -19338.49 | -11998.19 | -20962.83 |
| Median family income | -11.57 | -8.95 | -5.27 |
| Tobacco outlets per area | 4838.17 | 514.18 | 964.30 |
| Model Parameters | |||
| constant | 1214112.98 | 464428.87 | 418230.26 |
| ML Estimate of Spatial Autocorrelation (Rho) | 0.54 | 0.733209 | 0.752336 |
| Pseudo R-Squared [(1-Sigma2(UF)/Sigma2(y))] | 0.79 | 0.96 | 0.94 |
* All the numbers were different from zero at the 95-percent confidence level.
Hotspot Analysis
For both 1993 and 1999 grid models, residuals were identified that were more than two standard deviations from the model-based expectancy, using a Cook's distance calculation of T >= 1.65 or T <= -1.65. There were 90 of these “hotspots” in 1993 and 117 “hotspots” in 1999 (T >= 1.65) based on hospitalization charges. In these hotspot areas, both 1993 and 1999, significant increases were found for all independent variables (Table 3), except for number of tobacco outlets per grid unit. When looking solely at hotspot values for 1993 and 1999, we found marked increases in COPD hospitalization charges per capita for populations with relatively lower percentages of persons with bachelor's degrees.
Average Hot spots grid areas for higher-than-model-based expectations of COPD related Charges, 1993 and 1999.
| Hotspots 1993 (n=90) | Hotspots 1999 (n=117) | Percent change in hotspot | |
|---|---|---|---|
| COPD Counts per 10,000 | 71.5 | 97.4 | 36.3% |
| COPD Charges per capita | 133 | 267 | 100.8% |
| Age: 45 plus* | 2,357,132 | 2,562,773 | 8.7% |
| Hispanic* | 2,636,930 | 3,362,217 | 27.5% |
| Bachelor's degree or higher* | 1,055,019 | 1,899,883 | 80.1% |
| Median Income* | 33,501 | 48,549 | 44.9% |
| Tobacco Outlets | 16,616 | 16,089 | -3.2% |
* Information based on 1990 and 2000 census information
Although the two areas have quite similar urban densities and population heterogeneity, we found a preponderance of hot spots clustered in the Los Angeles (LA) area, in contrast to the San Francisco Bay Area, for both 1993 and 1999. Based on model expectancies, there were also markedly more grid units in the Bay Area that had lower than expected COPD hospitalization counts (cold spots) compared to the LA area.
We found that in 1993, model-identified hot spot grids had significantly higher COPD charges per capita, percentage population Hispanic, and number of tobacco outlets per grid unit, compared to all other grid units (Table 4). Furthermore, although the difference was relatively small, hot spots had lower median incomes than other grid areas. In 1993, relative to all other grids, cold spots had significantly lower COPD charges, and percentage of Hispanic population. In addition, cold spots had populations with significantly higher median incomes, percentage population with bachelors degrees, and fewer tobacco outlets per grid unit; however, there were no significant differences between hot spots and cold spots with respect to the percentage of residents aged 45 years plus. When examining 1999 data, (Table 5) most measures were found to be similar to 1993 data although percentage Hispanic population was found to be, opposite to 1993 results, higher in cold spot areas than for all other areas. Further, average number of tobacco outlets per area was found to be much higher for 1999 cold spots compared to 1993. As for the 1993 results, non-cold spot averages were significantly smaller. For both time periods, the cold spot and non-cold spot differences were much larger than for hot spot and non-hot spot areas.
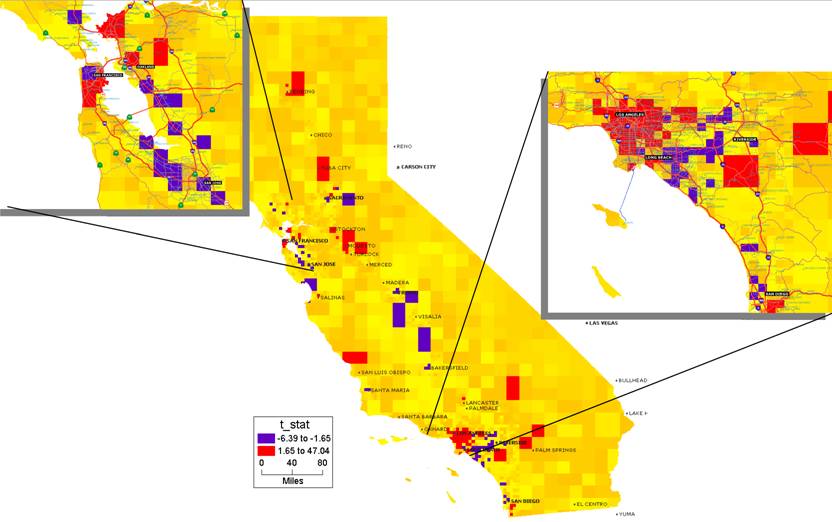
COPD change hotspots between 1993-1999 showing LA and SF bay areas
COPD charges hot spots and cold spots: independent variable comparisons, 1993
| 1993 Hotspot vs Rest and Coldspot vs Rest Averages | ||||
|---|---|---|---|---|
| 1993 | Hot Spot | Rest | Cold Spot | Rest |
| COPD COUNT per capita | 0.78% | 0.66% | 0.53% | 0.72% |
| COPD Charges per capita | $149.03 | $111.79 | $ 84.86 | $128.89 |
| Age 45 PLUS (percentage) | 31% | 30% | 30% | 30% |
| Hispanics (percentage) | 30% | 24% | 23% | 26% |
| Bachelors degree or higher (percentage) | 14% | 15% | 18% | 14% |
| Median income per capita | $32,866 | $33,873 | $42,968 | $33,416 |
| OUTLETS per grid unit | 179 | 21 | 112 | 23 |
COPD charges hot spot and cold spot independent variable comparisons with all other grid areas in California, 1999
| 1999 Hotspot vs Rest and Coldspot vs Rest Averages | ||||
|---|---|---|---|---|
| 1999 | Hot Spot | rest | Cold Spot | rest |
| COPD COUNT per capita | 0.97% | 0.76% | 0.71% | 0.85% |
| COPD Charges per capita | $250.34 | $172.19 | $157.74 | $202.40 |
| Age 45 PLUS (percentage) | 30% | 31% | 31% | 31% |
| Hispanics (percentage) | 36% | 31% | 38% | 31% |
| Bachelors degree or higher (percentage) | 23% | 26% | 26% | 25% |
| Median income per capita | $50,281 | $52,713 | $59,255 | $52,245 |
| OUTLETS per grid unit | 139 | 22 | 158 | 22 |
Comparisons between 1993 and 1999
Spatial modeling (using S3, spatial GLM regression module; [14]) was used to examine differences in COPD hospitalization charges in 1993 and 1999. After controlling for independent measures (i.e., age, race, education, income, and tobacco outlet densities), mean differences in COPD hospitalization charges between 1993 and 1999 were significant in several areas on the state grid (Table 6 and Figure 5). Using a minimization algorithm as described in Griffith (1988), the general least square (GLS) estimation is implemented in the Mathematica™ shell, and we calculated standard errors of estimates [23,24]. As estimated in the GLS model, the Cook's distance significance (T-stat) measure was used to identify the hot spots and cold spots. In this model, (Table 6) percent population 45 years and older, percentage population Hispanic, and percentage population with a bachelor's degree or higher were found to be significantly positively associated with COPD charges. In contrast, we found significant negative relationships between COPD charges and both median income and number of tobacco outlets.
Statistics for spatial model describing differences between 1993 and 1999 COPD charges and independent variables
| U & F t-Statistics for Cook's Distance Measure | s3 93-99 grid diff |
|---|---|
| Age 45 plus | 11.94 |
| Hispanic | 11.73 |
| Bachelors degree or higher | 5.15 |
| Average_Family Median Family income | -1.81 |
| Tobacco outlets | -11.33 |
| t(Const) | 1.1 |
| statistical measures | s3 93-99 grid diff |
| Pseudo-R-Squared = 1-[Sigma2(UF)/Sigma2(y)]= | 0.85 |
| Moran coefficient of untransformed y: MC | 0.7 |
| Exp. value for MC if no spatial autocorr.: E(MC) | -0.0004 |
* all variables were significantly different than 0 at the alpha=0.05 level.
We then compared average COPD charges between 1993 and 1999 grid units, and generated a T-statistic to determine grid units that had significantly higher or lower COPD charges in 1993 compared to 1999. Compared to 1993, we found that areas in the LA Metropolitan Statistical Area (LA MSA) had a greater incidence of grid areas with significantly higher levels of COPD charges in 1999 (Figure 5). San Diego County and some areas in the central valley were additional regions that exhibited significant increases in COPD charges.
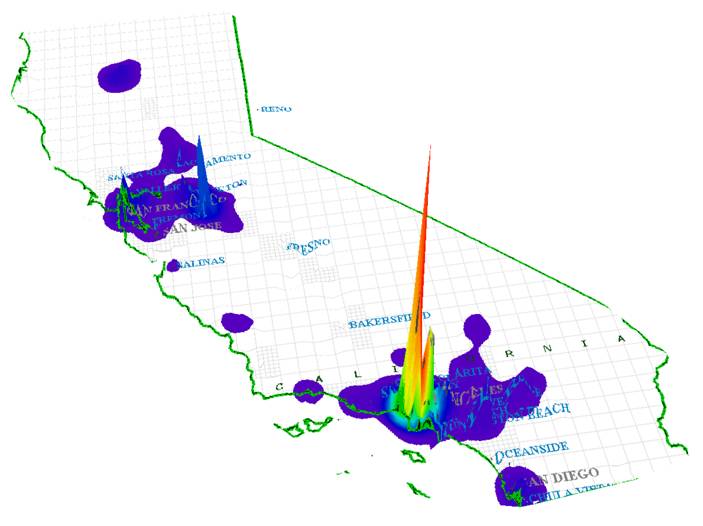
In contrast, areas that exhibited significant decreases in COPD charges included the central valley and the San Francisco Bay Area. Although there were some isolated pockets of decreased charges in Los Angeles city, the areas of significant increases in COPD charges in the LA MSA were far more numerous. On this latter point, Figure 6 is a three-dimensional representation of the marked increase in COPD charges for 1999 in the Los Angeles metropolitan area compared to the rest of the state. There were significant decreases as well, in relatively smaller areas of LA.
Changes in COPD Hotspots 93-99
4. DISCUSSION
Using parametric modeling, we have demonstrated in this analysis that geography matters, both descriptively and analytically. The conventional approach of dealing with geography as an urban/rural variable is shown to be inadequate after this study reveals that the two urban areas (San Francisco Bay Area and Los Angeles) have opposite COPD outcomes. Furthermore, those places with higher levels of COPD charges are also likely to have low median household incomes and few members of their population who are college graduates. COPD charges have also been found to be positively associated with the number of tobacco outlets in a given area.
“Hotspots”, those grid areas identified as higher (than model-based expectancies) for COPD charges, had markedly decreased median incomes and lower percentages of population aged 45 or older. Hotspot areas increased between 1993 and 1999 (from 90 to 117 respectively) and there were increases in raw numbers for almost all independent measures. This was particularly the case for the percentage population with bachelor's degrees and COPD charges per capita. While much of this change is expected as a result of population growth in California, conversely, we found a general decrease for the number of tobacco outlets, which could reflect general decrease in tobacco use during this time period as well as a secular trend to in which tobacco outlets become more concentrated in large retail stores such as supermarkets. (Table 3).
Methodologically, we found that the use of a uniform grid structure was advantageous for several reasons. First, a uniform grid allows for easier and more consistent comparisons across time (panel data) compared to typical administrative units such as ZCTA's, and spatial autocorrelation is more easily assessed and controlled than when using ZCTA's. This is seen in the Moran's “I” spatial autocorrelation coefficient comparison for 1999, in which more spatial autocorrelation was measured using the grid units (0.75) than when using the ZCTA's (0.54). Furthermore, the pseudo R-squared for the spatial model (as an approximation of model fit/variance explained) was also much higher for the grid unit model. It should be noted that although the grid unit method uses a modeling approach to assign values to grid units for socio-demographic and COPD information, the general patterns between the ZCTA and grid units are quite comparable, as can be seen in Figures 1 - 4.
Clearly, spatial autocorrelation was important in this analysis. Relatively high spatial autocorrelation, as measured by Moran's “I” coefficient of 0.73 and 0.75 for grid models in 1993 and 1999, respectively, indicates that a non-spatial parametric analysis would have, in all likelihood, reduced our ability to identify the influence of important socio-demographic and tobacco-related covariates (on COPD hospitalization charges per capita). The fact that, when modeling for both years, we found a negative/inverse relationship between median family income, education and COPD hospitalization charges, while identifying a positive relationship for percentage population Hispanic, suggests that class and ethnicity merit further scrutiny. This is particularly the case given the fact that Hispanic identification was found to be significant in hot and cold spots and thus imply differences (possibly class based) in the Hispanic community that bear further scrutiny.
When comparing 1993 and 1999 changes in COPD hospitalization charges and socio-demographic measures in a model based context using S3, similar results were found for the separate 1993 and 1999 outcomes. Notably, median income was negatively related to significant increases in COPD charges. This, combined with the positive relationship found for percentage Hispanic population, suggests that places where there are poor people of color are more highly affected by COPD. Moreover, Los Angeles, (Figure 6) shows a significant increase in COPD charges between 1993 and 1999; given the cost of COPD care, this finding alone is cause for concern and should be a focus of public health and public policy in California.
It should be noted that the relatively straight-forward comparisons made, both graphically and in the parametric model, were only possible as a result of the transformation of ZCTA areal units to a uniform grid. This grid approach relies on a modeling procedure to assign socio-demographic values and Hospital Discharge Data based on zip code level information. This estimation procedure was found to have results that were comparable to the original ZCTA information, albeit while simplifying statistical analysis and allowing for comparisons over time that would otherwise be impossible.
We will reiterate one major limitation of the present analysis. Specifically, this study relies on a cross-sectional analysis of relationships between COPD charges and other socio-demographic factors. We are thus limited in our ability to determine etiological relationships between COPD and other measures. We do not have the ability to see changes in the disease over time or to assess how exposure [to what—hypothesized etiological agents such as tobacco??] may result in a specific outcome. This is particularly true for diseases such as COPD that have relatively long incubation periods between exposure and disease. Given the complexity of COPD etiology, our analysis should be seen as helping to direct future research that is more longitudinal in nature.
The current study suggests that geography is a factor (and not just urban versus rural) when examining the relationship between socio-economic/demographic measures, tobacco use, and COPD rates and related healthcare charges. The complex hierarchy of geographic space was taken into account with the help of spatial GLM modeling. The higher levels of COPD hospitalization charges in grid areas with relatively lower income and education, as well as higher percentages of people of color and immigrants, should be the focus of more public health research and public policy decision-making. This is especially true, as the increase in COPD charges between 1993 and 1999 appears to go beyond expected increases due to population growth.
Although this is a preliminary study, it should help future research initiatives in which we will model point source (from EPA's toxic release inventory facilities (TRI)) and non-point pollution sources (from California Air Resource Board data). Moreover, the uneven increases in high levels of COPD charges in the state, both in rural and urban areas, after spatially controlling for a selection of socio-demographic measures, may help focus public health planning efforts. From environmental and social justice perspectives, the over-concentration of “hotspots” in poor and minority neighborhoods is a matter of significant concern. More investigation is needed to determine why these areas have higher COPD charges over time and may provide cost-effective means for future health education and COPD prevention efforts.
Acknowledgements
This research was supported by the California Tobacco Related Disease Research Program (TRDRP), Grant #11RT‑0093. We would like to thank Kathleen Yu for her editorial assistance.
CONFLICT OF INTEREST
The authors have declared that no conflict of interest exists.
References
1. Gulsvik A. The global burden and impact of chronic obstructive pulmonary disease worldwide. Monaldi Archives for Chest Disease. 2001;56:261-264
2. Anto JM, Vermeire P, Vestbo J, Sunyer J. Epidemiology of chronic obstructive pulmonary disease. European Respiratory Journal. 2001;17:982-994
3. Dahl R, Lofdahl CG. The economic impact of COPD in North America and Europe. Analysis of the Confronting COPD survey. Introduction. Respiratory Medicine. 2003;97(suppl C):S1-S2
4. Faulkner MA, Hilleman DE. The economic impact of chronic obstructive pulmonary disease. Expert Opinion on Pharmacotherapy. 2002;3:219-228
5. Izquierdo JL. The burden of COPD in Spain: Results from the Confronting COPD survey. Respiratory Medicine. 2003;97(suppl C):S61-S69
6. Halpern MT, Stanford RH, Borker R. The burden of COPD in the U.S.A.: Results from the Confronting COPD survey. Respiratory Medicine. 2003;97(suppl C):S81-S89
7. Peters A, MacDonald H. Unlocking the Census With GIS. Redlands, CA: ESRI Press. 2004
8. Medical Information Reporting for California System (MIRCal). OSHPD (California Office of Statewide Health Planning and Development). http://www.oshpd.cahwnet.gov/HID/MIRCal/index.htm
9. Cliff AD, Ord JK. Spatial Processes: Models and Applications. London: Pion Ltd. 1982
10. Griffith DA. Advanced Spatial Statistics. Dordrecht: Kluwer. 1988
11. Gruenewald PJ, Millar AB, Roeper P. Access to alcohol: Geography and prevention for local communities. Alcohol Health and Research World. 1996;20:244-251
12. Gruenewald PJ, Stockwell T, Beel A, Dyskin EV. Beverage sales and drinking and driving: The role of on-premise drinking places. Journal of Studies on Alcohol. 1999;60:47-53
13. Moran PAP. The interpretation of statistical maps. Journal of the Royal Statistical Society. Series B. Statistical Methodology. 1948;10(2):243-251
14. Ponicki WR, Gruenewald PJ. S3: Spatial Statistical System (version 4.0). Berkeley, CA: Prevention Research Center. 1998
15. Openshaw S, Taylor PJ. A million or so correlation coefficients: three experiments on the modifiable areal unit problem. In: (ed.) Wrigley N. Statistical Applications in the Spatial Sciences. London: Pion. 1979:127-144
16. Robinson WS. Ecological correlations and the behavior of individuals. American Sociological Review. 1950;15:351-357
17. Gotway CA, Young L.J. Combining Incompatible Spatial Data. Journal of the American Statistical Association. 2002;97458:632-648
18. Cressie N. Change of support and the modifiable areal unit problem. Geographical Systems. 1996;3:159-180
19. Hogg RV, Craig AL. Introduction to Mathematical Statistics. New Jersey: Prentice-Hall. 1995:293-301
20. Flowerdew R. Green. Statistical methods for inference between incompatible zonal systems. In: (ed.) Goodchild M, Gopal S. The Accuracy of Spatial Data Bases. London: Taylor and Francis. 1989:239-247
21. Mugglin AS, Carlin BP. Hierarchical modeling in geographic information systems: Population interpolation over incompatible zones. Journal of Agricultural, Biological, and Environmental Statistics. 1998;3:117-130
22. Best NG, Ickstadt K, Wolpert RL. Spatial Poisson regression for health and exposure data measured at disparate resolutions. Journal of the American Statistical Association. 2000;95:1076-1088
23. Upton GJG, Fingleton B. Spatial Data Analysis by Example, Vol. 2, Categorical and Directional Data. New York: John Wiley and Sons. 1989
24. Upton GJG, Fingleton B. Spatial Data Analysis by Example, Vol. 1, Point Pattern and Qualitative Data. New York: John Wiley and Sons. 1985
Author contact
![]() Correspondence to: Robert Lipton, Ph.D., Research Scientist, phone: 510 883 5755, fax: 510 644 0594, email: rliptonorg
Correspondence to: Robert Lipton, Ph.D., Research Scientist, phone: 510 883 5755, fax: 510 644 0594, email: rliptonorg
Received 2007-5-2
Accepted 2007-6-13
Published 2007-6-28